


Home » Knowledge platform » Documents and studies » OSR Tools » Geographic Information Systems
Geographic Information Systems (GIS) are tools used in many fields of knowledge because of their usefulness in handling geographic information and associated data to perform analyses that allow for decision-making.
The Irrigation Sustainability Observatory uses GIS to manage large amounts of graphical information. This information generally derives from the work of the Ministry of Agriculture, other official bodies, and a combination of both. This allows for the study and analysis of various components and variables that directly or indirectly influence irrigation, as well as their monitoring, with the main objective of optimizing resource use and improving the productivity and sustainability of irrigation. To be successful, it is essential to ensure that the information is as up-to-date as possible, which requires complementary fieldwork and office work.
The following document contains the main technical concepts of these tools and practical applications from a general point of view and in irrigation in particular, which will help to contextualize the application of GIS.
Just as a word processor is used to write documents and work with words on a computer, a Geographic Information System (GIS) is used to work with spatial information. It basically consists of:
There would be two other elements: the people making the decisions in that work and the methods used to perform it correctly.
With a GIS application you can open maps, create or edit spatial information and perform analysis tasks between different elements of geographic data.
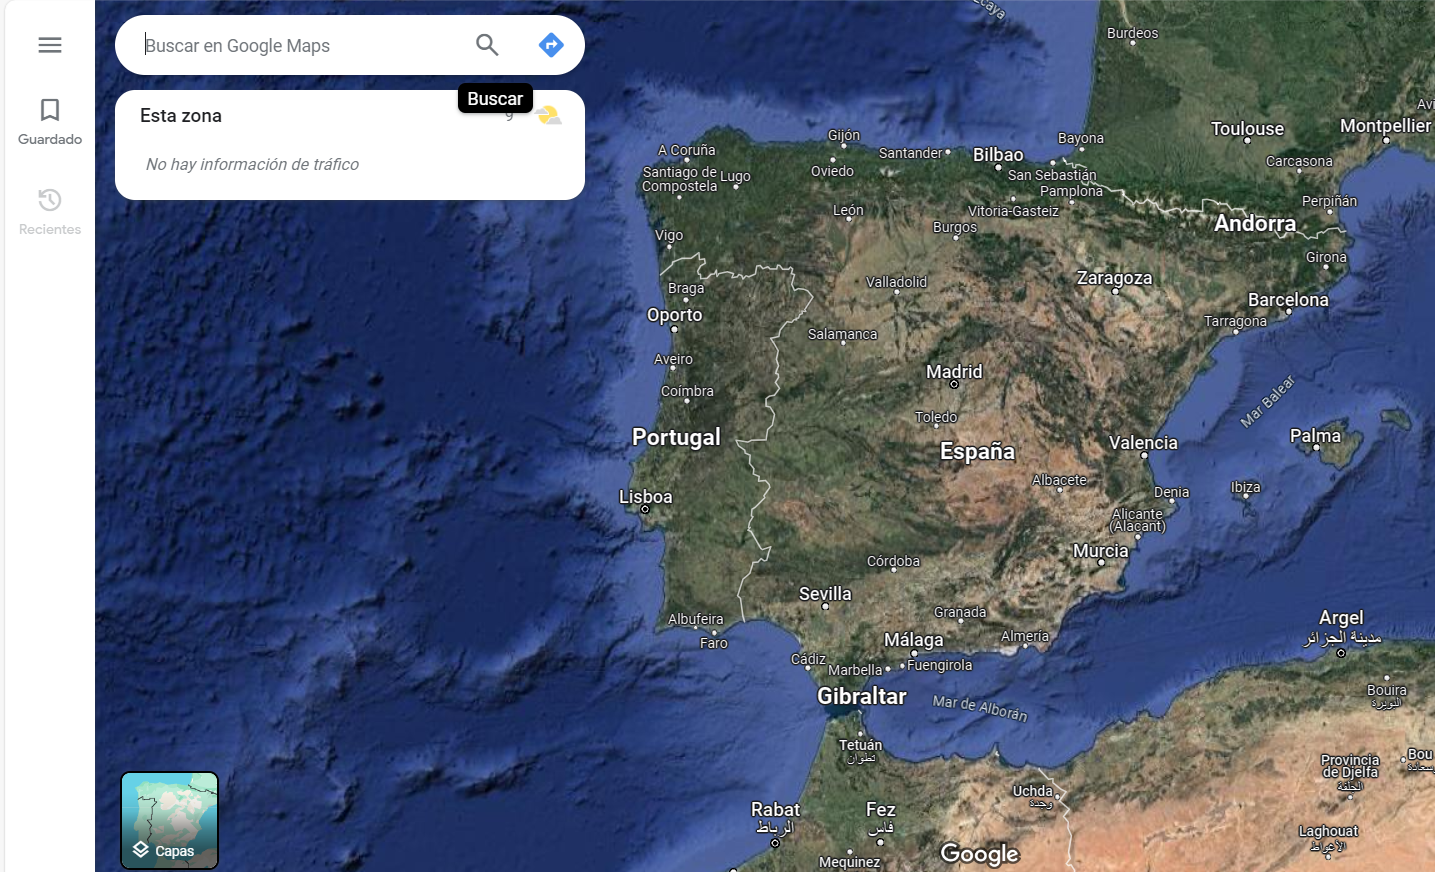
Figure 1. Example of a Geographic Information System (Google Maps, NASA Images, 2024).
Contrary to popular belief, the origins of GIS date back to the 1960s, with Canada being the pioneering country in its development. By the 1970s, it had become firmly established, and thanks to numerous technological advancements, it has become an invaluable tool in a multitude of professional sectors.
A GIS could be defined as a coherent storage system for spatial information that can be updated, modified, and analyzed with minimal effort.
The definition of a Geographic Information System can also be approached from different points of view.
An integrated set of computer means and methods, capable of collecting, verifying, storing, managing, updating, manipulating, retrieving, transforming, analyzing, displaying and transferring spatially referenced data about the Earth.
Computerized model of the real world, in a reference system linked to the Earth to meet specific information needs.
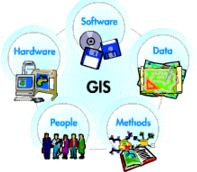
Figure 2. Components of Geographic Information Systems.
GIS applications are programs with a graphical user interface (GUI) that can be manipulated using the mouse and keyboard and allows the visualization and management of geographic data.
These types of applications facilitate access to numerous analysis tools for the exploitation of geographic data, allowing the creation of new layers, tables, or maps that support further analysis, help resolve and diagnose different situations, and thus make decisions.
There are numerous GIS applications, ranging from the simplest, with visualization capabilities but few analysis options, to the most complex and sophisticated with a high economic cost.
Currently there are two possibilities for using GIS software, through license payment as is ArcGIS created by the company ESRI (Environmental Systems Research Institute) or free and open source software such as QGIS.
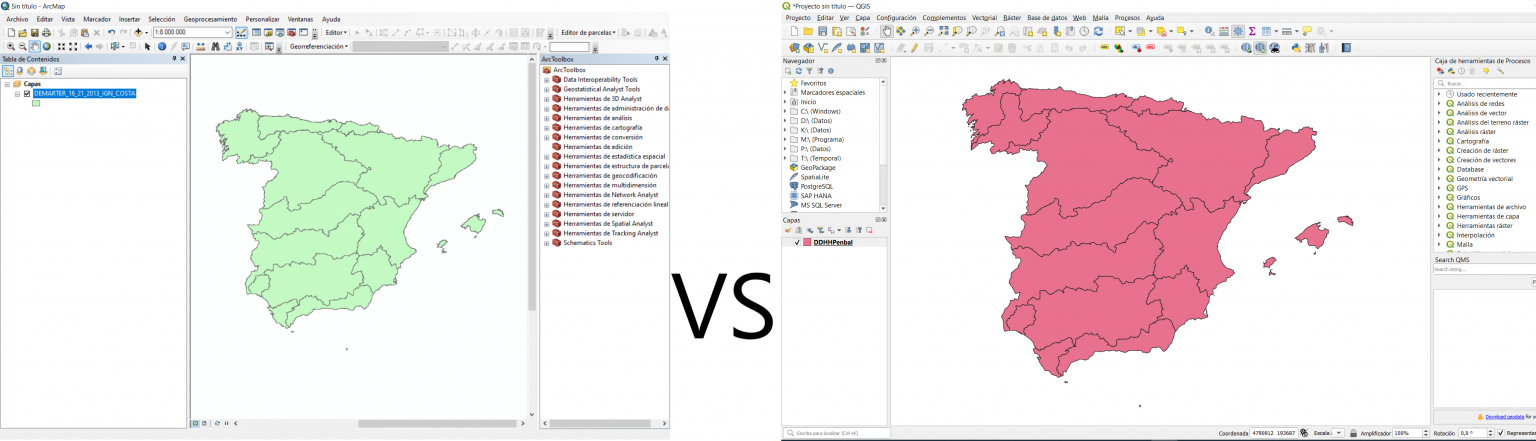
Figure 3. ArcGIS interface (left) and QGIS interface (right).
Geographic data is a representation of real-world entities. This modeling can be done using two different methods: vector modeling or raster modeling.
In a GIS, geographic features are often expressed as vectors, while preserving the geometric characteristics of the figures. Real-world modeling is achieved through three types of spatial objects: points, lines and polygons.
The choice of which object to use depends on the nature of the entity being represented and the scale at which it must be represented. For example, a lake can be represented as a polygon, a river as a line, and a water intake as a point at a given scale, but that same river can also be represented as a polygon at a larger scale.
In the following figure you can see part of a simple plan in which different types of spatial objects are represented on an orthophoto according to their topology of point, line and polygon, referring to a modernization of irrigation in the Irrigation Community of Páramo Medio (León-Spain).
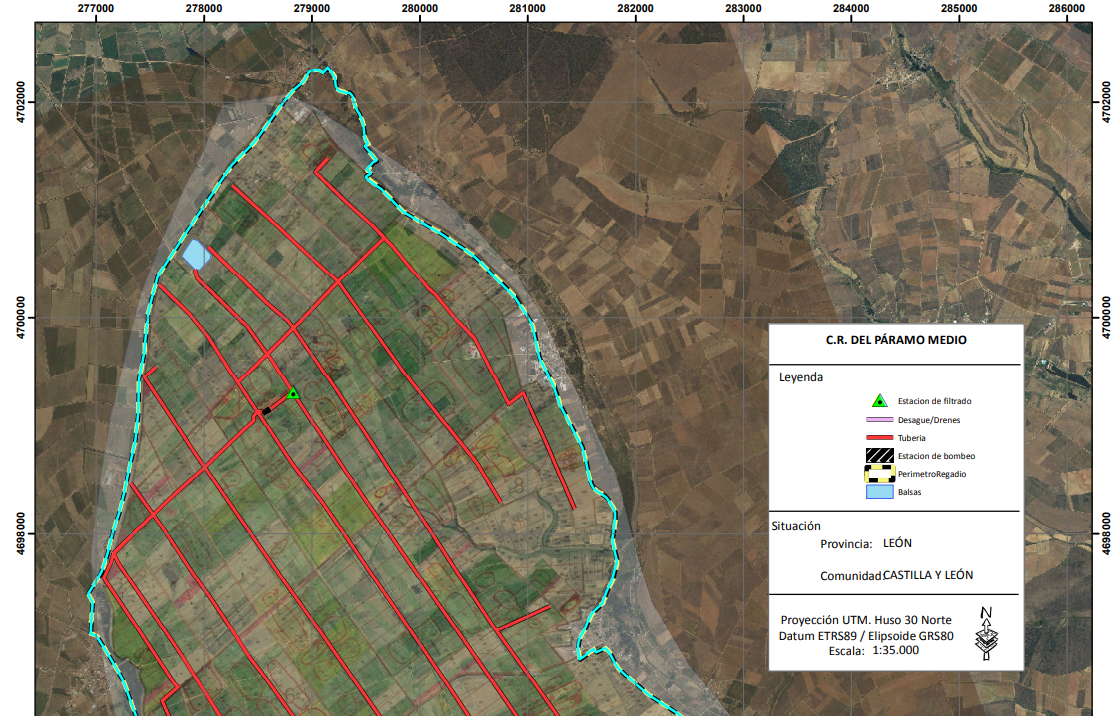
Figure 4. Example of a Sentinel image from June 2, 2023, in northern Badajoz (true color).
This is the most widespread file type for storing vector data.
A shapefile (layer) It can contain a single type of spatial object (point/line/polygon) and stores both the coordinates that describe the geometry of the real-world entity, and the alphanumeric attributes that define it.
To store all this information, a single systemhapefile (layer) It is composed of at least 3 files with the same name but different extensions:
| Extension | Description | Obligation |
|---|---|---|
| .shp | Main file that stores the geometry of the entity. | Mandatory |
| .dbf | Table in which the attributes of each entity are stored. | Mandatory |
| .shx | Index file that stores the geometry index of the entity | Mandatory |
| Not mandatory, but highly recommended | ||
| .sbn | Associated spatial index file | Optional |
| .prj | Stores information about the Reference System (RS) | Optional |
| .xml | Register the file metadata | Optional |
Figure 5. Table with the file extensions specific to shapefiles.
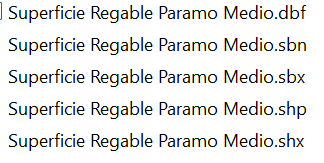
Figure 6. Example of viewing a shapefile (shp) from the browser.
In a raster model, real-world entities are structured in a matrix of cells (or pixels) organized in rows and columns, where each cell contains a value that represents specific information; height, slope, temperature, cost, time, etc.
In general, aerial photographs, satellite images, and scanned maps are represented under this model.
The raster structure is also widely used when numerous layers of information of different natures need to be crossed to obtain a value that helps us interpret the geographical reality or make a decision about it.
In this way, a hydrographic network can be represented as a raster where cells containing a river have a specific value and cells where there is no network have a null value.
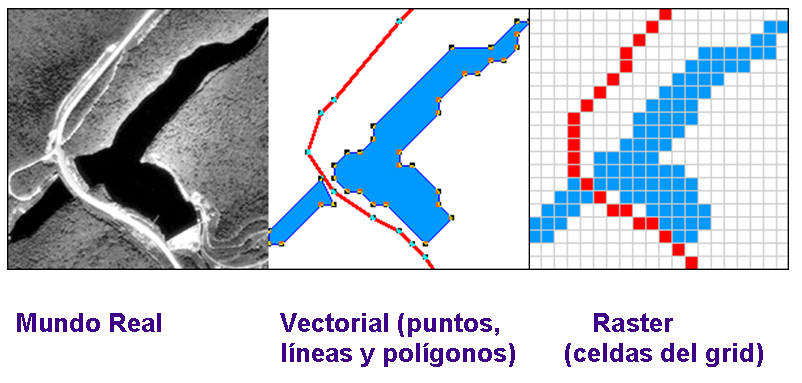
Figure 7. Comparison of the modeling of the same area, as a vector model and as a raster model.
Alphanumeric data enriches geographic data by providing information associated with a real-world entity. This data is collected in attribute tables, which are linked to the vector or raster file. Two types of alphanumeric data are distinguished: spatial and non-spatial data.
This is alphanumeric information that characterizes geographic data represented geometrically in a vector (point, line, or polygon). This type of data accompanies the vector.
They contain alphanumeric information without necessarily having a geographic character. They expand the information of the geographic data; for example, a polygon in a forest inventory can also have a value that functions as an identifier and information about tree species, or a polygon referring to an irrigated area can contain specific information about that area (e.g., the following figure). In raster data, the cell value can store attribute information, but it can also be used as an identifier referring to the records in a table.
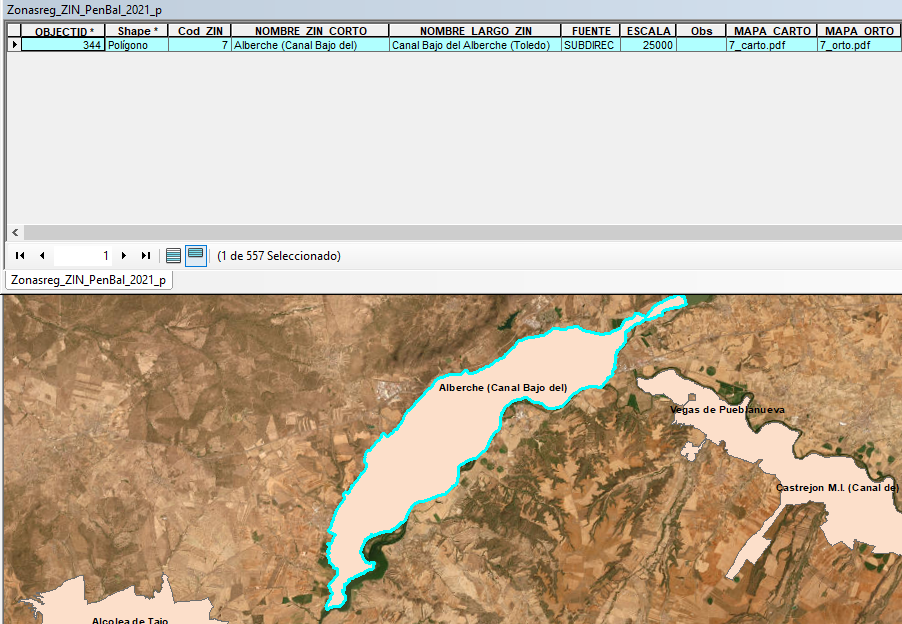
Figure 8. Example of information associated with the Canal Bajo del Alberche irrigation area (Toledo-Spain) collected in the attributes table.
Once the definition of a Geographic Information System and the types of data it relies on are known, a standard and simple workflow model can be established that is repeated in any GIS analysis task.
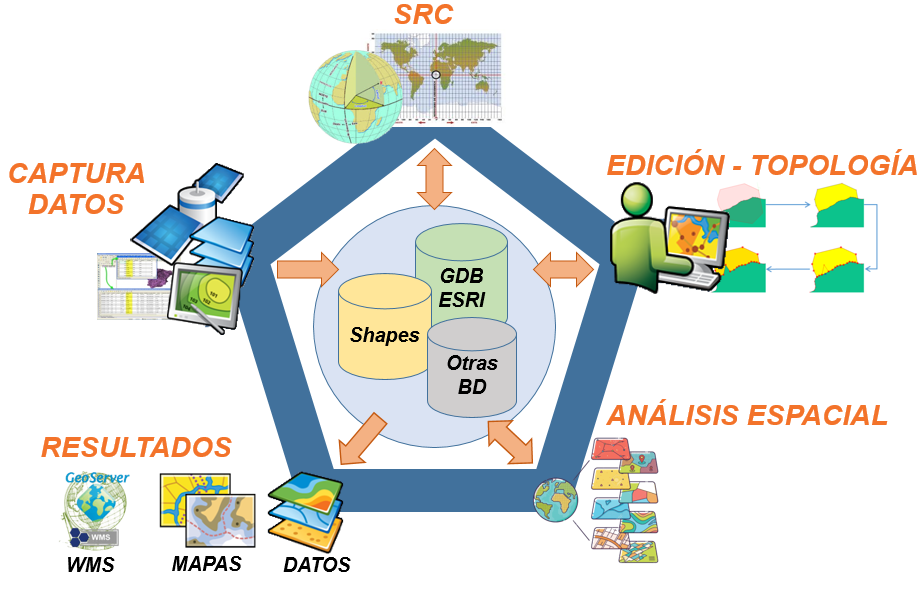
Figure 9. Example of information associated with the Canal Bajo del Alberche irrigation area (Toledo-Spain) collected in the attributes table.
This is the phase in which the geographic and alphanumeric data that feeds our GIS data repository is captured or created. The origin of this data is very varied; from layers already existing in other systems, field data collection, generation of layers from geocoded lists, or integration of satellite data, for example.
Once the new geographic data is available in a coordinate system, the first step will be to verify its Coordinate Reference System.
As previously mentioned, this data models a real-world entity, and therefore, an essential requirement is that this modeling be based on the correct spatial location of the represented entity. There are different reference frames (RFs), and it will be crucial to know which one is used in the data, as well as the transformation processes between the different RFs.
Once the data has been correctly located in space, its validity is verified, and if necessary, the corresponding edits are made.
This edition can be of two types; vector and alphanumeric.
Verification of the accuracy of the represented data: scale and update.
If necessary, appropriate corrections should be made, or another data source that better suits the system's needs should be located.
Topology. The editing of a vector entity must be carried out taking into account the topological relationships established based on the spatial reality represented.
If this reality does not allow overlaps of different elements (for example, the same location cannot be simultaneously inside and outside a single space), the corresponding geometric entity must respect this condition.
This type of editing can be automatic, manual, or a combination of both.
Verification of the validity of the data present in the attribute tables or associated data, and where appropriate, the correction of erroneous or outdated records.
This editing can be done manually, although there are also tools to facilitate editing, and it depends on both the GIS application and the database-linked tools used.
The spatial analysis of our system's data, or geoprocessing, is the fundamental piece of this flow, and it is what leads to obtaining answers and solutions to the problems raised.
As a result of this process, new data will be obtained that will feed the repository and that can again be the subject of subsequent analyses.
In addition to data that will be stored in our repository, the result of the editing and analysis work can generate paper maps or data that can be served via the web (WMS). In this sense there are many official and unofficial sites that offer these services, among which the website of the Spatial Data Infrastructure of Spain stands out (IDEE) which includes the main services of all Spanish administrations.
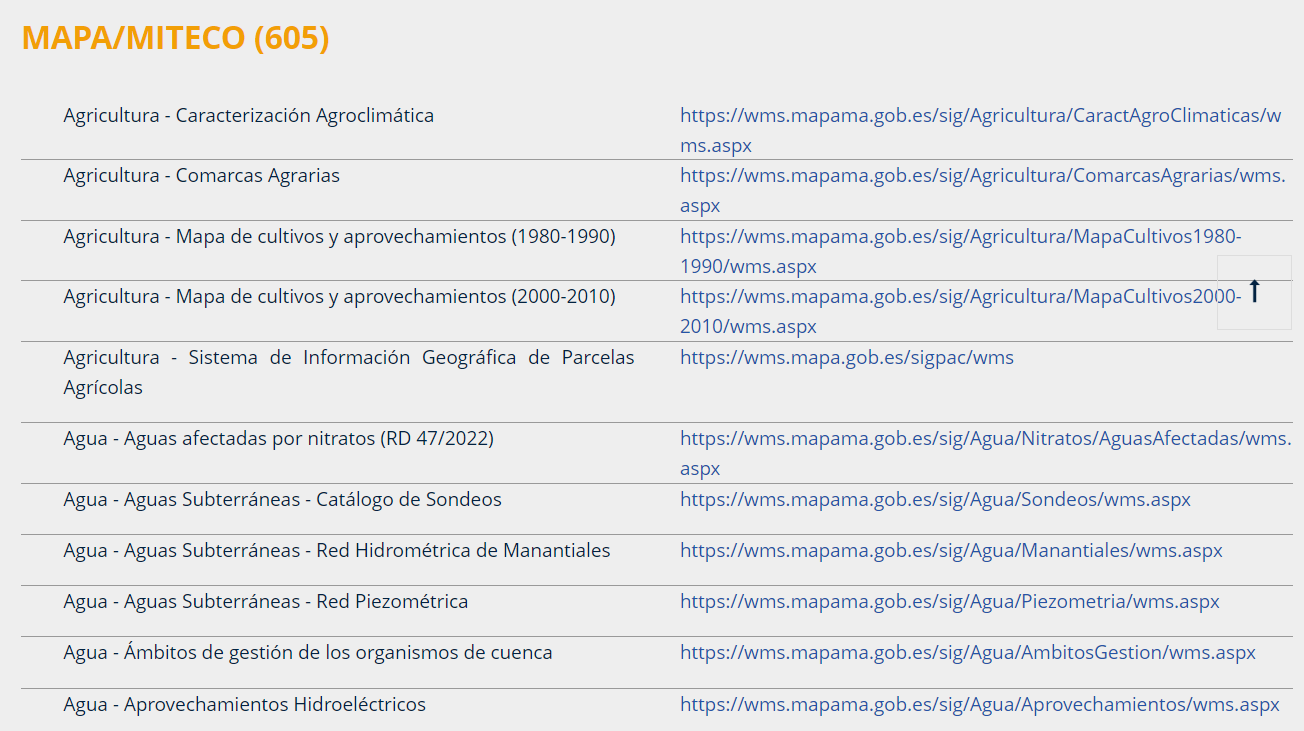
Figure 10. Example of WMS services offered by IDEE on its website https://www.idee.es/
Given the characteristics of GIS and as has already been mentioned, its use has many fields that are open to its application and scope.
The Irrigation Sustainability Observatory uses these GIS tools as a fundamental complement, from the representation of different graphic entities on maps to specific analyses based on cross-referencing different layers to obtain information to be used in subsequent calculations.
The following is a very brief description of some of the uses and applications of Geographic Information Systems.
Geographic Information Systems (GIS) are often mistakenly confused with programs used to create maps. While it's true that they can be used for this purpose, it represents only a small part of the potential of GIS.
Based on source data, compiled and provided by online vendors, etc., and adapted to a specific GIS project, maps can be created at different scales, sizes, and with varying features, as determined by the consulting firm for a particular study. The quality and accuracy of the resulting maps depend on the consulting firm's technical expertise and the experience of the GIS operator.
The purpose of these maps is very diverse. Some examples include: support maps for verification, stakeout, or field work; results maps for studies; etc.
Below are two types of maps with different map sources, such as raster images served by WMS servers (e.g., satellite imagery), layers, or coverages of different topologies. Basic representation elements can be added to the maps, such as north orientation, legend, title block with logos, titles, numerical scale indicating paper size, graphic scale, labeling, etc.
Example 1: Map created from the digitization of a paper plan. Area of General Interest of Alange. Summary of activities: scanning, georeferencing, digitization, adjustments, and integration into the Areas of General Interest layer. The adjusted plan is shown below, incorporating information gathered from legal documents for adjustments. The map is based on the National Topographic Map and includes north orientation symbols, a coordinate grid, a legend, a title block with logos, a description, a scale, and titles.
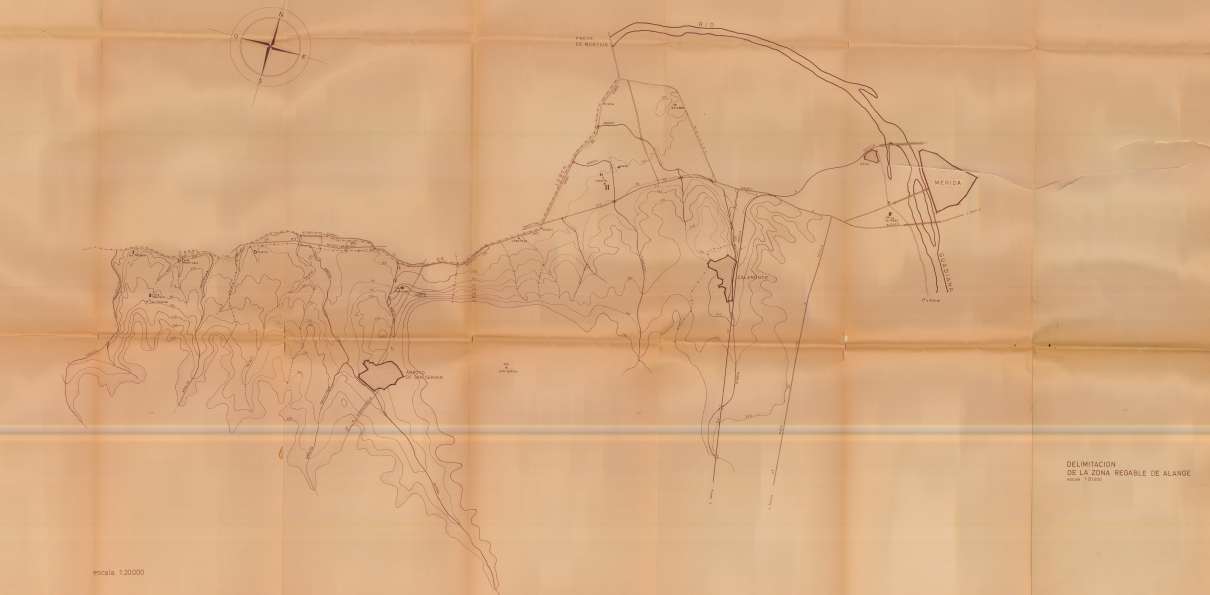
Figure 11. Original paper map of the Alange Irrigation Zone (Badajoz-Spain) for digitization and integration into a Geographic Information System. Source: OSR.
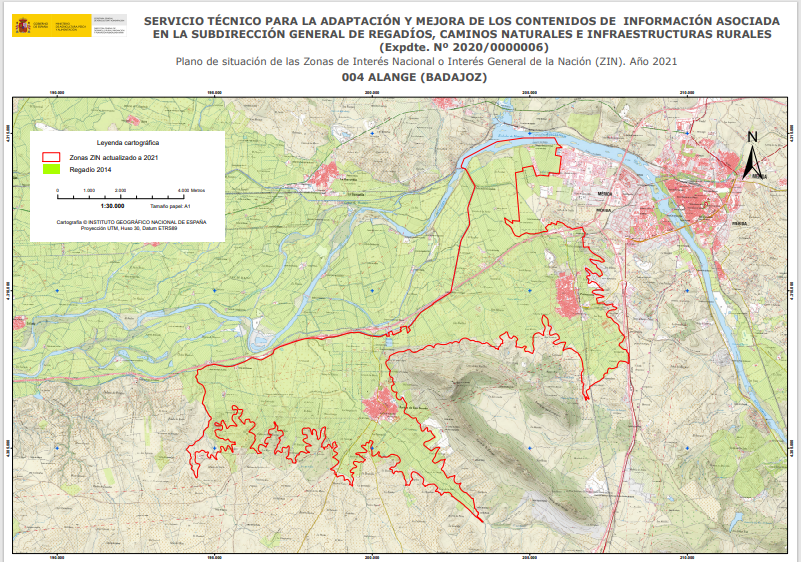
Figure 12. Example of a map generated from the Alange Irrigation Zone (Badajoz, Spain) by digitizing and integrating paper data into a layer (e.g., shapefile) or geodatabase (GDB) of a Geographic Information System. Source: OSR
The previous point anticipates the foundation of geographic information systems, which is the creation of these graphic layers. Continuing with the previous example, from a process of gathering information—both graphic (plans like the one in the figure, in digital format, in other formats, etc.) and alphanumeric data derived from official documents, calculations, and so on—different layers are generated. These layers have various uses, one of which, and one that is becoming increasingly common, is online service via servers that enable the integration of this information into a GIS project. There are also portals for displaying this information, commonly known as geoportals.
The Ministry of Agriculture has a Geoportal It contains a large amount of information and is currently being updated with new additions. The following example shows the same area as the previous example (Alange Irrigated Area) integrated into the Geoportal and available to any internet user, who can consult the metadata and information associated with the displayed spatial dataset.
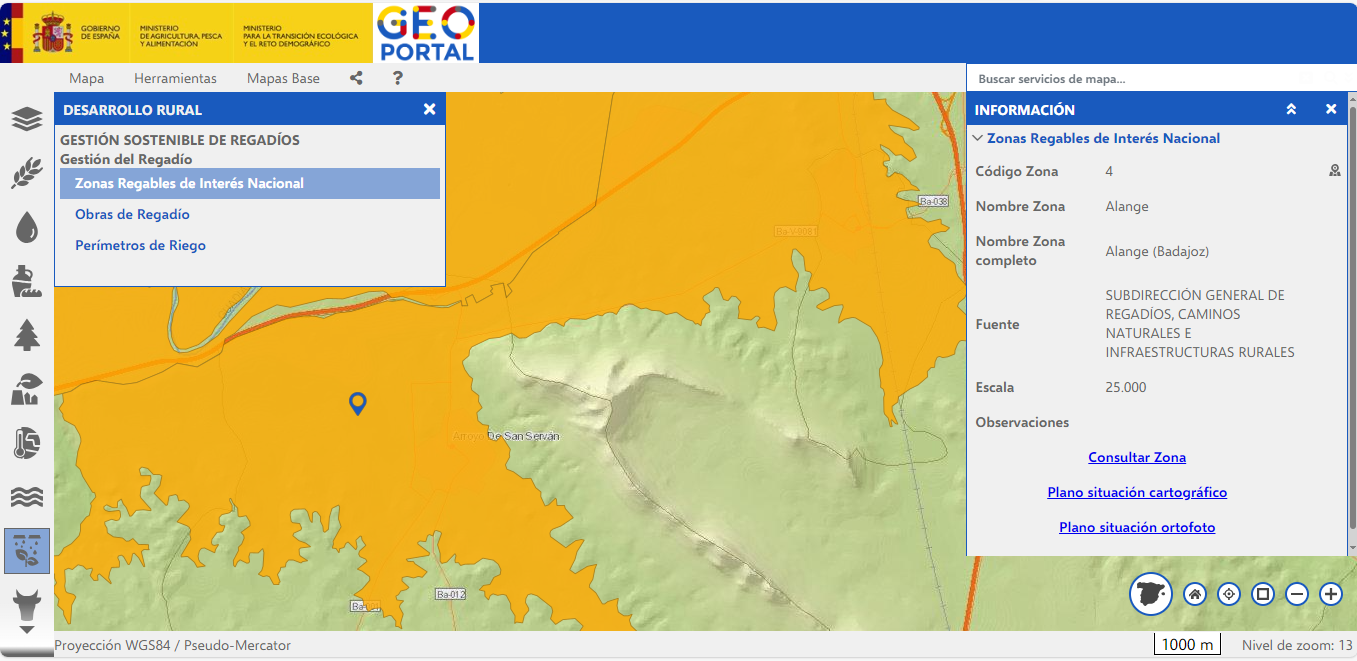
Figure 13. Visualization of the National Interest Irrigated Areas layer using the Geoportal. Access to supplementary information for the area consulted (Alange Badajoz Irrigated Area, Spain). Source: MAP: https://sig.mapa.gob.es/visor/#/visor2/geoportal
In general, for most studies that refer to the territory (e.g., municipalities, provinces, river basins, aquifers, etc.) it is necessary to assess the geographical information associated with layers that can be superimposed and thus have the possibility of interpreting that data and reaching conclusions that are decisive for the specific study.
It is important to emphasize again that Geographic Information Systems should be used as a support tool, and the use of the resulting information is the responsibility of the consultancy conducting the study. It is recommended that the graphic outputs be accompanied by the title of the study and the author in order to always contextualize the information shown.
A basic example of cross-referencing would be calculating the geographic areas of irrigated land per municipality relative to the total area of each municipality. This would require one layer with polygon topology of the municipalities and another with polygons representing irrigated areas. By cross-referencing these layers with existing GIS software tools, the available data would be exported to other formats and manipulated. In practice, the data is exported in a format compatible with spreadsheets or databases like Access, and then the necessary operations are performed.
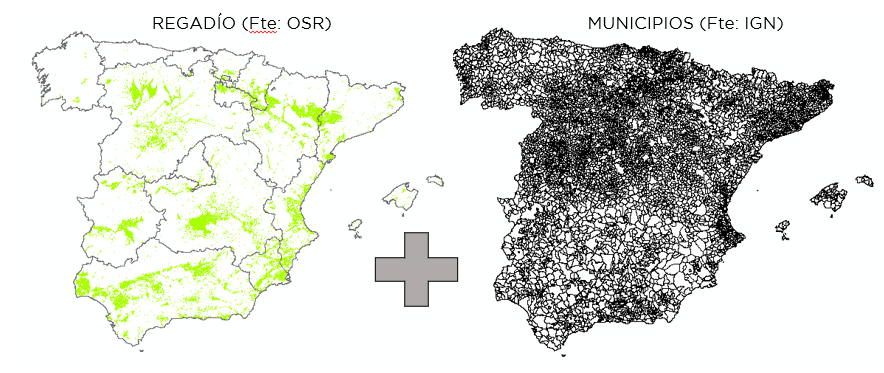
Figure 14. Irrigation layer from the Irrigation Sustainability Observatory (OSR) and municipality layer from the National Geographic Institute.
The result, after a few simple operations, would be similar to the following:
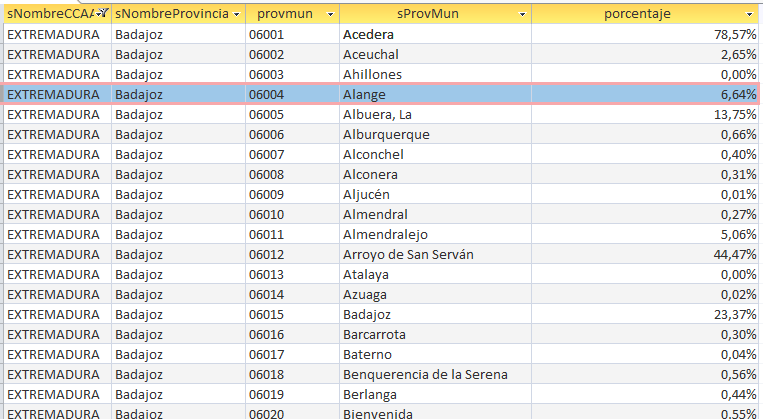
Figure 15. Example of the results for the percentage of irrigable land by municipality, derived from GIS layers and processed using spreadsheets and/or databases. Source: OSR.
The following is a list of links that provide access to information on Geographic Information Systems available at the Ministry of Agriculture:
SigPac Viewer V 4.11 (mapa.gob.es)
Geographic Information System for Agricultural Data (mapama.gob.es)
Geographic Information System for Agricultural Parcels (SIGPAC) (mapa.gob.es)
Foods from Spain (mapama.gob.es)
Marine Mapping Viewer (mapama.gob.es)
Geographic Information System of the Ministry of Agriculture, Food and Environment (youtube.com)