


NATIONAL IRRIGATION PLAN H-2008
1 Justification for a National Irrigation Plan
1.1 Historical background of irrigation policy in Spain
Historically, irrigation has been linked to the development of agriculture in the great Mediterranean civilizations. In Spain, irrigation was introduced and widely developed centuries ago to take advantage of the natural light and heat conditions of the Mediterranean basin, and there are numerous historical references to the promotion of irrigation.
However, state intervention in irrigation development has its contemporary origins in the late 19th century, driven by the Regenerationist movement. It was precisely this school of thought that elevated water policy to the status of a central policy and a fundamental element for overcoming Spain's economic backwardness. This water policy was to be understood broadly as an accelerated process of transformation from extensive and traditional agriculture to intensive and modern agriculture through irrigation.
The general canal plan advocated by Joaquín Costa was the ideological basis of the first National Plan of Hydraulic Works drafted by Gasset in 1902. This Plan assigned the construction and financing of hydraulic works to the State, thus marking itself as the spearhead of state interventionism in irrigation policy that would culminate in the Law of 1911 still in force.
During the first decades of the 20th century, and especially under the dictatorship of Primo de Rivera, water policy underwent significant development under the Count of Guadalhorce, who is also credited with creating the Hydrographic Confederations, a model of organization, planning and participation in water management whose most original element is the definition of the hydrographic basin as the basic unit of action.
Costa's ideas found in Lorenzo Pardo the water expert who, in the Ebro Basin, as head of the Hydrographic Confederation, translated the ideological principles of regenerationism into technical projects and construction works. However, what truly cemented Pardo's position as a pioneer of modern hydrological planning in Spain was the drafting of the 1933 National Plan for Hydraulic Works. Until then, all hydraulic works plans had been mere catalogs of more or less coherent projects, whereas the 1933 Plan presented an integrated vision of hydrological planning.
In 1939, the National Institute of Colonization (INC) was created, and the Law for the Colonization of Large Areas was passed. At this time, irrigation policy became linked to colonization policy, whose fundamental objective was the settlement of colonists on lands expropriated in the Large Irrigated Areas developed by the State. The 1939 Law intended that the planning and execution of colonization projects would be carried out in collaboration between the INC and private enterprise. The application of this law was largely unsuccessful, as this collaboration never materialized. Consequently, in the 1940s, public irrigation development was almost nonexistent, barely reaching 20,000 hectares, precisely at a time when food shortages were a serious problem and the need to increase agricultural productivity was imperative (the period of autarky). In contrast, the Law of Reserves was far more successful, allowing for a significant expansion of irrigation based on private development. Nearly 100,000 hectares were transformed through this law in just a few years of the 1940s.
The Colonization Law of 1939 gave way to the Law of Large Irrigated Areas of 1949, still in force, which entailed total state intervention in large-scale irrigation projects. According to the new law, the state decided which large areas would be developed, promoted the development, and carried out and financed all the necessary works and investments. The application of the new law, along with a significant budget allocation for the public development of irrigation systems, bore fruit in the 1950s and even more so in the 1960s, when irrigation policy became the key policy for modernizing agriculture and increasing and diversifying food production during a period of strong economic growth and dietary changes. The budget allocated to irrigation policy reached its peak in that decade, within the framework of the Development Plans. Thus, in the 1950s, 192,000 hectares were transformed by public initiative, and in the 1960s, nearly 350,000 hectares.
In the 1970s, the pace of irrigation development remained high, before beginning a slow decline in the 1980s that intensified in the 1990s, largely due to budget constraints. In the mid-1980s, irrigation development became the responsibility of the regional governments, although the central government retained jurisdiction over Irrigated Areas of National Interest. Despite the financial contributions of both levels of government, the total budget allocated to irrigation decreased significantly from that point onward, leading to a sharp drop in the rate of development.
Government support for private irrigation conversion has been another constant feature of Spanish irrigation policy, primarily affecting systems whose conversion was easy and inexpensive, most of them well-fed. This policy began in the 1940s with the reserve system (compensatory prices) and continued in subsequent decades with other incentives (subsidies, soft loans, tax breaks, technical assistance, and others). It can be said that a significant portion of privately owned irrigation systems have benefited from this type of support to undertake the conversion.
In summary, the balance of public irrigation transformation throughout the 20th century is as follows: 316,000 hectares transformed through the 1911 Law, 992,000 hectares through the 1949 Law (later consolidated into the 1973 Law on Agrarian Reform and Development), and 95,000 hectares through initiatives by the Autonomous Communities. To these figures should be added the 695,000 hectares converted to irrigated land by private initiatives with public subsidies, representing a significant percentage of the total of almost 1,300,000 hectares transformed by private initiatives. Few countries can boast such a record of results, reflecting the importance that Spanish economic and agricultural policies have historically placed on irrigation.
1.2 The importance of irrigation in Spain
Irrigation has played a key role in the Spanish agricultural economy, especially since 1940. During the years of food rationing (the period of autarky), irrigation, transformed by private initiative through the policy of reserves, improved the supply of basic foodstuffs such as sugar, potatoes, and cereals. In the 1950s, when Spanish agriculture began its economic takeoff, irrigation became at the forefront of the agricultural modernization process. It was precisely in irrigated agriculture that the use of modern means of production took hold most strongly, where the substitution of labor by capital occurred most intensely, and where agricultural productivity increased most rapidly.
But perhaps the period in which irrigation played the most decisive role was the economic development of the 1960s. Rapid economic growth and a sharp increase in per capita income led to a shift in the Spanish diet, with a decrease in the consumption of some foods (cereals and legumes) and an increase in others (sugar, meat, milk, vegetable oils, fruits, and vegetables). The agricultural production imbalances of those years (production exceeding consumption and consumption exceeding production) caused inflationary pressures and a growing imbalance in the agricultural trade balance. The significant public reforms in irrigation during the 1960s provided an opportunity to overcome this situation, since the diversification of production afforded by irrigation made it possible to meet the new food demands of a more urbanized population with greater purchasing power than that of the 1940s and 50s.
In subsequent years, irrigation continued to play a key role in the mature phase of the agricultural modernization process. Thanks to the increased agricultural productivity generated by irrigation, a shrinking agricultural workforce has been able to feed a growing and increasingly demanding urban population in terms of the variety, quantity, and quality of food it requires. As a result of the proactive irrigation policy, the final agricultural output currently contributed by irrigated Spanish production accounts for more than 501,000 tons of total final agricultural output, while irrigated land occupies only 131,000 tons of usable agricultural land.
At the same time, irrigation has contributed to the shift in the trade balance from a deficit in the 1960s, 70s, and part of the 80s to a surplus in the 1990s. Irrigation has been crucial in making the supposed advantages that some agricultural products offered in a scenario of joining the EEC a reality. Thus, once the export restrictions established for the transitional period were overcome, the significant surge in the agricultural trade balance during the second half of the 1990s was mainly due to the strong expansion of exports of irrigated products, and especially fruits and vegetables. Therefore, irrigation is partly responsible, along with other factors, for the agricultural trade balance going from a coverage rate of 82% in 1985 to one of 110% in 1999, and for the percentage of exports on Final Agricultural Production going from representing 30% to 56% in the same period.
But the importance of irrigation in the Spanish agricultural economy is not only relevant from a macroeconomic perspective, as we have just seen, but also from a microeconomic one. Indeed, the conversion to irrigated land, whether public or private, has meant economic survival for many farmers. Given the structural problems of Spanish agriculture, characterized by the small size of farms, many farmers have been able to increase their production and agricultural income thanks to irrigation. Sometimes, converting all or part of the farm to irrigated land has been the only way to remain in agriculture. This is especially true for small-scale private conversions, often carried out with public subsidies, which have allowed for the irrigation of part of the farm through wells or direct intakes from surface water sources.
To understand the contribution of irrigation at the farm level, it suffices to say that, on average, one hectare of irrigated land produces six times more than one hectare of dryland and generates four times the income. In the intensively irrigated areas of the Mediterranean and southern Atlantic coasts, these differences are much greater, which explains the strong expansion of private irrigation over the last 25 years. In contrast, in the irrigated areas of inland Spain, the impact of public transformations carried out since the 1940s is much greater. But irrigation not only allows for a higher income but also a more secure one. This is due to two factors: firstly, the greater diversification of production that irrigation allows, thus avoiding the risk of dryland monoculture; and secondly, it reduces the climate risk of arid and semi-arid drylands, where the variability of annual and seasonal rainfall causes severe economic losses.
If we now analyze the contribution of irrigation from the perspective of rural development, the figures are equally telling. One of the main objectives of rural development policy is job creation and retaining the rural population, and irrigation makes a decisive contribution to achieving this goal. The primary contribution of irrigation is its greater generation of direct employment, since on average one hectare of irrigated land requires 0.141 ATUs (Annual Work Units), while one hectare of dryland only needs 0.037 ATUs. Therefore, the average workforce potential of irrigated land is more than three times that of dryland farming. These differences are much greater in the agriculture of the Mediterranean and southern Atlantic coasts, where one hectare of irrigated land generates up to 50 times more employment than one hectare of dryland.
However, the direct employment generated by irrigation is neither the only nor, often, the main contribution of irrigation to rural development. Indeed, a substantial part of the primary processing agri-food industry is located near the agricultural raw material production centers in order to reduce transport costs and losses, as well as to guarantee the supply of processing plants. This is the case for the sugar industry, dehydrated animal feed, fruits and vegetables, potatoes, cotton, tobacco, and other products. But many of these products are grown in the continental and Mediterranean irrigated areas of our country, so irrigation generates a high level of employment in the agri-food industries that rely on the produce from the surrounding irrigated areas.
Therefore, areas with extensive irrigation often have high levels of employment in the agricultural and agri-food sectors, ranging from 20% to 40% of the total employed population. This is particularly evident in areas with intensive irrigation (the Ebro Valley, Murcia, the Valencian Community, and the Andalusian coast), but it can also be observed in other inland areas of Andalusia and in the large irrigated areas of Autonomous Communities such as Castile and León and Extremadura.
In many rural areas, not only coastal but also inland, irrigation has fostered a significant agri-food sector, playing a key role in generating income and employment in rural communities. The economic and social fabric supported by this sector has kept these rural areas alive, resulting in higher population density, a younger population, lower unemployment rates, and higher activity levels. Comparing the demographic and occupational structure of inland rural areas with and without irrigation reveals striking results regarding the importance of irrigation as a driving force for rural development. It is no surprise that in these areas there continues to be strong social demand for improving existing irrigation systems or even expanding irrigated land, as experience demonstrates that irrigation is a key element for maintaining the rural population.
Another element to consider when assessing the importance of irrigation is its role in rural land management. The irregular rainfall, typical of a Mediterranean climate, the low flow of rivers, a consequence of small basins, and the predominance of a territorial model based on an agricultural economy, spatially organized into numerous poorly connected rural settlements, meant that in most of Spain, the availability of water for irrigation has historically been the essential difference between the wealthiest and most underdeveloped rural areas, and the fundamental aspiration of all regions as a lever for improving their relative position and quality of life.
The establishment or presence of irrigation systems generates an activity that occupies space within the territory and is therefore conditioned by its characteristics, while simultaneously transforming that space. In this sense, irrigation fulfills a social function as a factor in territorial balance. Indeed, irrigation can curb rural exodus from areas at risk of abandonment or at least population loss, and, as has been demonstrated in some transformed areas, it has even acted as an element of demographic recovery. Thus, irrigation contributes to maintaining a certain territorial balance by retaining population in the area, which in declining rural areas is a fundamental objective to prevent abandonment and the consequent degradation of the land, landscape, natural resources, and environment.
Thus, multifunctional irrigation, characterized by its ability to retain population, organize land use, and maintain rural areas, can be considered a fundamental component of the new European agricultural model enshrined in Agenda 2000. This multifunctional irrigation is defined in the current National Irrigation Plan as social irrigation, and it deserves public support for the important services it provides to society as a whole.
Finally, the importance of irrigation as a water user in Spain cannot be overlooked. Indeed, the irrigation sector is the main user of water in our country. Therefore, any action plan or measure to improve water management in Spain necessarily involves improving the management and use of water in irrigation. When discussing possible measures to improve water use efficiency in Spain, all eyes turn to irrigation. This is essential, because although irrigation contributes only 2.1% of GDP and employs 4.1% of the working population, it consumes 801% of available water resources—resources that are increasingly scarce and degraded, and whose sustainable management is fundamental for environmental conservation. This gives irrigation a central position in water and environmental policies. It will not be possible to increase water use efficiency, recover overexploited aquifers, preserve valuable wetlands, or improve water quality without improving agricultural water use.
1.3 The new institutional framework for water and irrigation
Following the entry into force of Law 29/1985 of August 2, on Water, water policy in Spain has undergone a long evolution, culminating in the recent approval of the National Hydrological Plan Bill in the Congress of Deputies. The approval of Law 29/1985 marked a historic milestone, not only because it repealed a law passed in 1879, but also because it enshrined the public domain status of all waters and granted hydrological planning a fundamental role in the management and administration of water resources and river basins. The planning process completed its first stage with the approval of the River Basin Management Plans through Royal Decree-Law 1664/1998 of July 24.
Although of lower legal standing than the National Hydrological Plan, river basin management plans incorporate elements of fundamental importance for the future of irrigation in Spain. These include the definition and objectives for guaranteeing water allocations to irrigated areas, the regulation of water use during periods of scarcity, projects aimed at increasing the water supply and, therefore, maximizing the potential growth of the irrigable area within the basin, and finally, water conservation objectives achievable through modernization and rehabilitation projects in irrigated areas. The approval of the National Hydrological Plan Law concludes the process initiated on January 1, 1986, with the entry into force of Law 29/1985, while also establishing the growth of irrigable areas for the next twenty years in those basins that, in accordance with the Law, are eligible to do so. Thus, although with different timeframes, irrigation planning is subordinate to the works and projects included in the National Hydrological Plan Law and linked to the provisions of said Plan.
The amendment to Law 29/1985 on Water, through the approval of Law 13/1999 of December 13, by raising the standards for the regulation and preservation of public water resources, poses new challenges for agricultural water use. The mandatory installation of water consumption meters, the possibility of increasing or decreasing fees and tariffs based on the flow rates consumed by irrigators, and the contracts for the transfer of water rights are essential elements for rationalizing agricultural use, but they are difficult to implement without modernizing obsolete, deteriorated, or structurally unsound irrigation systems.
The accelerated pace of legal modifications culminated in the approval at the end of 2000 of the Water Framework Directive 2000, after which a period began, concluding in 2012, for Member States to demonstrate their improved compliance. The desire and need to rationalize agricultural water use is implicitly or explicitly present in all current planning elements and legal texts. However, fulfilling this need is severely limited, if not impossible, in older irrigation systems or those undergoing structural and social deterioration and aging. It is inconceivable that the effort and awareness of irrigators in older communities or irrigation districts would be sufficient to undertake modernization projects, without which the changes to our legal framework cannot be implemented. This National Irrigation Plan is inspired by the growing need to rationalize the use of water in all Spanish irrigable areas, new or old, harmonizing the objectives of water policy with the improvement in the living conditions of irrigators, rural development and the increase of their competitiveness in agricultural markets.
1.4 Need for general irrigation planning
Irrigation planning in Spain is a mandatory task, due to all the factors indicated below, without the order in which they are presented implying any order of priority.
The first factor is the need to incorporate into irrigation policy the profound institutional, social, and economic changes that have occurred in the last fifteen years and that are influencing the evolution of irrigation in Spain. Among these changes, the following stand out: the transfer of functions and services for agricultural reform and development from the central government to the regional governments, including those related to irrigation; Spain's accession to the EU, with full participation in its Regulations and Directives, within which its own policies must be developed; the strategic importance that the current Water Law confers on hydrological planning; and the consideration of water as an economic good (a scarce resource), which means that agriculture must compete with other water uses, among which environmental concerns have strongly influenced social demands. And finally, the growing trend towards globalization and the progressive opening of agricultural markets, which requires improving the productive efficiency and competitiveness of the agri-food chain, starting with the first link, which are the agricultural holdings, in whose competitiveness irrigation is a decisive factor.
The second factor is the need to frame the development of irrigation within the Common Agricultural Policy (CAP) and the sustainable development enshrined in Article 2 of the Treaty of Amsterdam. The current CAP maintains a significant level of support for the main productive sectors, but limits, in each of them, the national, regional, or individual amount of production, land area, or livestock that can receive the corresponding support through price or direct aid. Only fruits and vegetables, wine, and industrial livestock farming (pigs and poultry) are excluded from this approach; these sectors do not receive direct aid or price guarantees. However, in the case of wine and certain fruits, there are specific prohibitions on new plantings and/or grubbing-up aid, which limits production expansion, at least for some varieties. Approximately 801% of dryland and 651% of irrigated land are subject to some form of supply limitation (quotas, allocations, premium entitlements, base areas, base livestock numbers, or maximum guaranteed quantities). These production limitations necessitate national policies for coordination and management to prevent potential overshoots and the resulting penalties.
In a single market, the uncontrolled increase in irrigated agricultural production in some regions ultimately has a negative impact on all others due to falling agricultural prices or widespread penalties in aid for overproduction. This interrelationship between regional agricultural production requires public authorities to organize and coordinate their actions to prevent imbalances in agricultural productivity, particularly those that could arise from the transformation and disorderly growth of irrigated land. Therefore, a national framework for irrigation action is necessary, serving the sustainable development of rural areas, a coherent policy for regulating production and markets, and the efficient management of a scarce resource such as water.
The third factor is the legal mandate for irrigation planning in Spain. This legal mandate stems from the 1985 Water Law and, more recently, from Royal Decree 1664/98, which approved the River Basin Management Plans. Indeed, the Water Law establishes that the River Basin Management Plans and the National Hydrological Plan must take into account the various sectoral plans and must include the basic regulations on improvements and transformations in irrigation that ensure the best use of all available water resources and land. The Royal Decree that approved the River Basin Management Plans in 1998 is even more explicit, establishing that the construction of hydraulic infrastructure promoted by the General State Administration will be subject to current regulations on environmental impact assessment, budgetary provisions, and the corresponding sectoral plans when their specific regulations so stipulate. In particular, regarding irrigation, the actions and investments of the General State Administration will adhere to the programs, deadlines and forecasts established in the National Irrigation Plan, in force at any given time.
The fourth factor is the parliamentary mandate to carry out irrigation planning in Spain. Indeed, taking into account the importance of irrigated agriculture in hydrological planning, given its status as the main water user, the Congress of Deputies adopted an Agreement in 1994 urging the Government to draw up an Agricultural Irrigation Plan that would include the irrigated areas to be improved, new irrigation systems, transformations for social reasons, water consumption and conservation, the influence of the CAP reform and the GATT agreements on irrigated crops, as well as the necessary profitability studies.
The mission to carry out this parliamentary mandate was not without enormous technical, legal, and political difficulties. Technical difficulties arose from the lack of complete information on the state of existing irrigation systems in Spain; legal difficulties stemmed from the complex network of rules and regulations governing water and irrigation planning in Spain; and political difficulties arose from the distribution of powers regarding irrigation, derived from the State of Autonomies.
The development and approval of a National Irrigation Plan by the Government of Spain is based on Article 149.1.13 of the Spanish Constitution, which establishes as an exclusive competence of the State "The basic principles and coordination of the general planning of economic activity." This power legitimizes the Government of Spain to propose an irrigation plan that, in accordance with constitutional doctrine, is based on consensus, cooperation, and collaboration between the State and the Autonomous Communities in a shared task involving two areas of competence dedicated to the promotion and orderly development of irrigation in Spain.
To comply with this parliamentary mandate, the necessary work and studies to develop an Irrigation Plan began in late 1994. Thus, in February 1996, the Council of Ministers approved a Preliminary Draft of the National Irrigation Plan with a timeframe extending to 2005. The completion of baseline studies on the actual state of existing and planned irrigation systems, the need to align irrigation action plans with EU policies, and finally, the joint development process with the Autonomous Communities of Rural Development Programs for the period 2000-2006, all prompted an update of the aforementioned Preliminary Draft, both in terms of its specific objectives and its implementation timeframe. When defining this new time horizon, it was taken into account that obtaining community funding required the new horizon of the PNR to coincide with the programming period of the community structural funds, whose planning covers the period 2000-2006 but whose execution extends until 2008.
The Rural Development programs (2000-2006) include actions for the Improvement of Agricultural Structures, encompassing water resource management measures in agriculture. Therefore, these programs receive the corresponding European funding to co-finance investments in irrigation, both in Objective 1 regions (Andalusia, Asturias, the Canary Islands, Castile-La Mancha, Castile and León, Extremadura, Galicia, Murcia, and the Valencian Community) and in regions outside Objective 1 (Aragon, the Balearic Islands, Catalonia, La Rioja, Madrid, Navarre, and the Basque Country), as well as in Cantabria as a transitional region.
1.5 General principles and guidelines of a new irrigation policy: national irrigation plan
Irrigation planning must respond to a series of general principles and guidelines that incorporate institutional, economic and social changes, as well as new trends, conceptual approaches and criteria included in the Treaty on European Union and in the Regulations and Directives that directly or indirectly affect the development of irrigation.
The general principles of the National Irrigation Plan Horizon 2008 are sustainability, cohesion, multifunctionality, competitiveness, equity, flexibility, co-responsibility and coordination.
The principle of sustainability applies to new irrigation systems as well as to the improvement and consolidation of existing ones, and encompasses not only environmental sustainability, but also economic and social sustainability. Indeed, an irrigation system will not be sustainable if its production is not profitable or if farmers in irrigated areas abandon rural communities.
The principle of cohesion involves planning a set of social irrigation systems, the purpose of which is to retain population in declining rural areas (rural development) and thus contribute to reducing the differences in income and quality of life between these fragile rural areas and developed rural and urban areas.
Multifunctionality is another general principle that should inform irrigation planning. This involves applying to irrigation this new concept introduced by Agenda 2000 within the definition of the European agricultural model. Therefore, irrigation must fulfill not only the traditional function of food production, to which we must now add the production of safe and high-quality food, but also new functions such as the conservation of natural resources—in this case, water resources—the landscape, and the rural environment, or the retention of population in depressed rural areas to prevent their complete abandonment, which in turn is related to the principle of economic and social cohesion.
Competitiveness is an essential principle that is also related to the principle of sustainability: only competitive irrigation is sustainable. However, it is necessary to delve deeper into the definition of this principle to incorporate certain elements that must be taken into account in the drafting of the National Irrigation Plan (NRP). Today, international competitiveness is greatly distorted by legal, institutional, and political factors. Indeed, the condition of “ceteris paribus”The fundamental principle for comparing the competitiveness of agricultural production in different countries is not being met, as there are significant differences in agricultural, social, and environmental policies, as well as diverse legal regulations and institutional organization between countries, which seriously disrupt analyses of agricultural competitiveness. The World Trade Organization (WTO) attempts to prevent distortions through agricultural policy, but has yet to address those stemming from labor, environmental, social, and other regulations.
Equity, as a general principle of planning, can be interpreted in its territorial sense or from the perspective of users. The former can be considered included within the principle of cohesion, and therefore will not be emphasized. As for the latter, this principle means that a balance must be maintained between user groups so that the benefits for some do not negatively affect others or distort markets, which would be detrimental to farmers and consumers. An illustrative example of the application of this principle is the conversion to irrigated land of large areas where the dominant production orientation is based on crops supported by CAP subsidies subject to limitations.
The principle of flexibility must be incorporated into planning to adapt it, without rigidity, to the changing conditions of the agricultural sector and the extended maturation periods of irrigation systems, within an initial timeframe of 2008 that coincides with the implementation period of the European funds already approved for the 2000-2006 period. This principle is fundamental, given that recent and successive political crises (the collapse of the USSR, the Balkan crisis, uprisings in Asian countries, political instability in Latin American countries, and protests against globalization) and economic crises (Mexico, Russia, Indonesia, Brazil, Japan, and Argentina) occur almost unexpectedly and, above all, at a dizzying pace. No one can predict how global geopolitical balances, economic situations, food security, international regulations and organizations, migration and capital flows, the biotechnological revolution, and other factors will evolve in the future. The only way to protect oneself from so many uncertainties is through flexible planning that is reviewed periodically.
The principle of shared responsibility stems from the fact that powers regarding irrigation are shared between the central government and the regional governments. In practice, this principle translates into the participation of both levels of government in the planning, implementation, and financing of irrigation projects. Logically, the counterpart to shared responsibility is cooperation, meaning that such projects must be planned and agreed upon between the Ministry of Agriculture, Fisheries and Food and the relevant regional departments of the autonomous communities with jurisdiction over irrigation.
Finally, the principle of institutional coordination must be applied to achieve the essential coherence in the actions of agricultural and water authorities, both national and regional. This will undoubtedly have a multiplier effect on the combined effectiveness of hydrological and irrigation planning. The current coherence between these two planning frameworks will represent a definitive step forward in improving water management in Spain. We must not forget that irrigation planning is a short- and medium-term plan with a time horizon subject to the current situation, but with sufficient flexibility to adapt to the expectations set forth in hydrological planning.
***
In accordance with these general principles, the National Irrigation Plan must be more than just a catalog of public works and actions distributed across the territory according to proportionality criteria based on certain indicators; it must be the expression and reflection of a new irrigation policy that aims to develop rural areas, integrating productive activity with the conservation of natural resources and respect for the environment, in accordance with the following guidelines:
To strengthen the territory, preventing or reducing population loss, abandonment, and aging in rural areas, especially in declining areas where the transformation of small plots of land is of great interest for retaining the working population and creating and maintaining agricultural employment. The economic activity indirectly linked to production in these irrigated areas will also contribute to ensuring the maintenance of basic services and diversifying labor and capital income linked to the regions where they are located.
Improving farmers' living standards by increasing labor productivity and farm income, and promoting the economic growth of their operations. This will help attract young farmers with sufficient training and skills to enhance the competitiveness of irrigated farms and encourage more efficient water use.
To organize agricultural production and markets, consolidating a competitive, sustainable, and diversified agri-food system, and adapting it to the CAP, especially its production restrictions and limitations. The irrigation plan is thus inspired by an integrated vision of agri-food final goods production, according to which improvements in standardization and quality, and greater alignment with end markets, not only result in greater profitability for farms, but also allow processing and distribution industries to compete more effectively in the European single market.
Improving irrigation water distribution and application infrastructure aims to rationalize water resource use, reduce agricultural pollution of surface and groundwater, and promote the modernization of irrigation systems by incorporating technological innovations that allow for less water-intensive irrigation techniques. The irrigation plan views water management as a continuous process, traversing a long path from the reservoir or aquifer to the plant. Along this path, numerous opportunities exist to improve the productivity of the resources used, but its complexity necessitates the application of integrated methods. Without these methods, it is impossible to identify the most effective combination of actions for each circumstance and budgetary constraint.
Incorporate environmental criteria into land and water management to prevent degradation, allow the recovery of aquifers and valuable natural spaces (wetlands), protect biodiversity and landscapes, and reduce desertification processes.
***
These principles and general guidelines lead to new orientations in irrigation policy which, in a balanced way, are intended to be promoted with this National Irrigation Plan in terms of priorities and co-responsibility for the actions to be developed.
First, the improvement, modernization, and consolidation of existing irrigation systems, especially those aimed at rationalizing water use, are considered priorities, and in the medium term, the initiation of large-scale transformations in new irrigated areas is excluded. The only new transformations contemplated in these guidelines are small-scale irrigation projects in disadvantaged or relatively underdeveloped rural areas, with the aim of creating jobs, retaining population, and diversifying production, thus contributing to the socioeconomic organization and balance of the territory. In areas where transformation plans are currently underway, these plans will continue on a moderate scale, but with selective criteria based on profitability, optimization of existing investments, and productive, social, and environmental sustainability.
Secondly, the implementation of the actions will be shared and coordinated among the various public administrations with jurisdiction over irrigation. This coordination is ensured in this sectoral planning, as the Ministry of Agriculture, Fisheries and Food (MAPA) and the Autonomous Communities agree on territorial objectives, coordinate actions, and jointly establish the implementation instruments, among which the specific collaboration agreements stand out.
Finally, the new guidelines reinforce the co-responsibility of irrigators in the actions that affect them, since the current support mechanisms are expanded with new possibilities to expedite and finance projects for the improvement, modernization and consolidation of irrigated areas.
These guidelines introduce a reasonable balance between the productive, social and territorial functions of irrigated agriculture in a way that is compatible with the provision of environmental public goods.
2 Development of the PNR: methodological synthesis and general structure
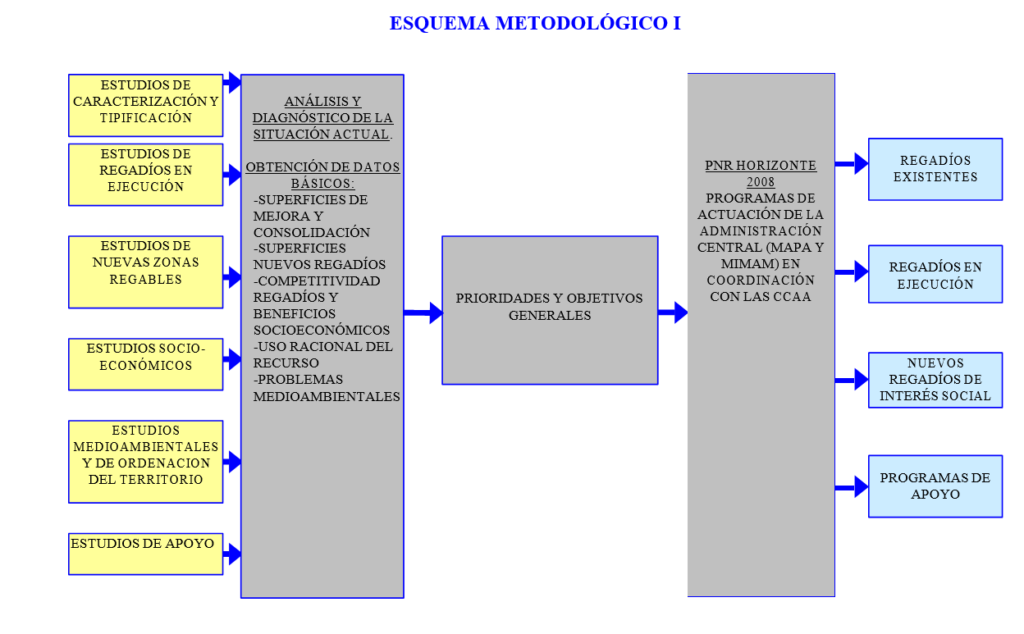
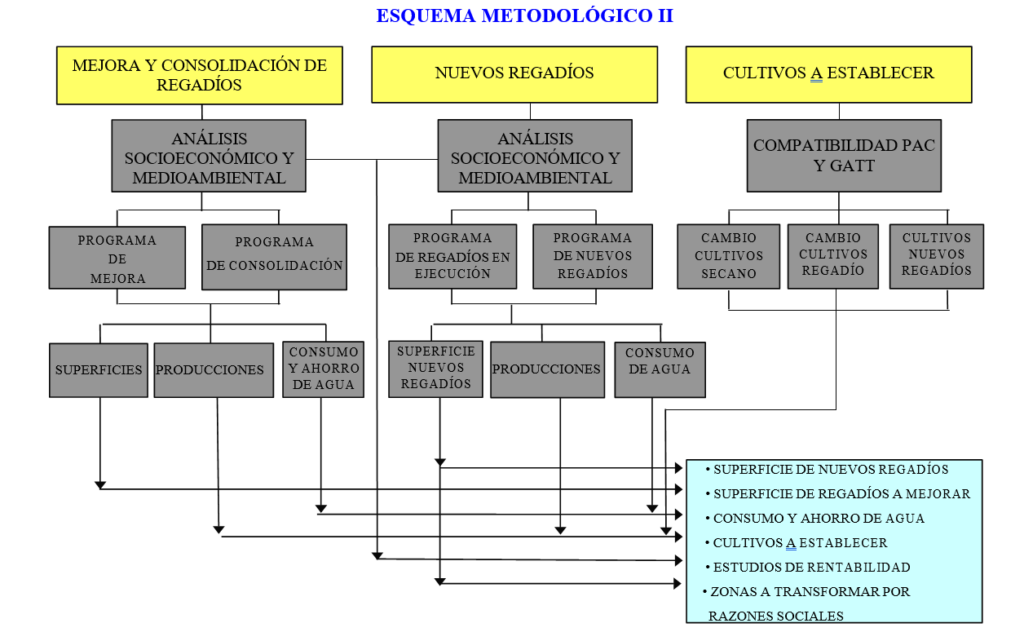
The technical process of developing the National Irrigation Plan (PNR) followed a sequence of several interconnected phases, which unfolded within a context of regulatory and institutional changes impacting sectoral irrigation planning. The development sequence, corresponding to the various chapters that structure the Plan, was as follows:
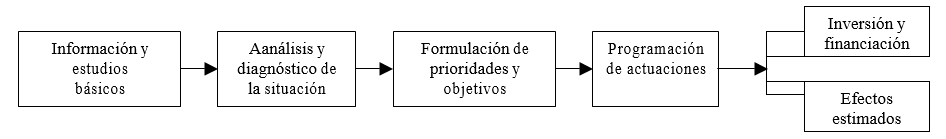
This sequence is outlined in a more detailed way in the two attached diagrams.
- Basic information and studies
The planning and programming of actions must be based on prior, multidisciplinary and as broad information as necessary, regarding its physical and territorial base and all the complex relationships and cross-effects between economic development, regional balance and productive, social and environmental sustainability.
Therefore, the collection, updating and processing of information and statistical data obtained from different sources on the physical and human environment, different aspects of the agricultural economy and environmental issues was carried out, with which graphic and documentary databases have been created, whose management and exploitation is carried out through the Geographic Information System (GIS) of the Ministry of Agriculture, Fisheries and Food.
Based on all this information and all the studies carried out, Chapter 3 summarizes the most characteristic aspects of agriculture in relation to irrigation. The first sections of the chapter provide data on the natural conditions in which agricultural activity takes place (section 3.1) and describe the demographic context of rural areas and the influence of irrigation on demographic trends and rural employment (section 3.2).
The following sections of the chapter attempt to situate agriculture within its macroeconomic figures, the contribution of agricultural activity to the economy and general employment (section 3.3) and its productive structures of physical and economic dimension (section 3.4).
References to the food industry and trade are necessary since they are the destination of a large proportion of many irrigated crops and are crucial for their future (sections 3.6 and 3.7 respectively).
In irrigation planning, especially when new developments are involved, it is essential to study potential production options and market prospects. Section 3.5 describes the different sectors regulated by Common Market Organizations (CMOs), analyzes their situation in Spain, and assesses the production possibilities compatible with increased irrigation. These assessments should be considered estimates subject to revision at any time, given the interdependence between product markets, a characteristic of the agricultural sector (consider, for example, how the BSE crisis offers new opportunities to produce irrigated plant protein for livestock feed that did not exist just a few years ago).
Finally, section 3.8 considers, due to their impact on irrigation, environmental policies and limitations and relates irrigable areas to territories subject to different levels of conservation protection.
- Analysis and diagnosis of the current situation
Having established the physical, social, economic, and environmental context in which agriculture operates, it is necessary to analyze, on the one hand, the situation of irrigated lands and diagnose the most relevant problems of those currently in operation or under development, and on the other hand, the potential for initiating new transformations. To this end, studies have been conducted in various areas, among which the following are the most significant:
– Characterization and classification of existing irrigation systems in areas under transformation and other potentially irrigable areas.
– Economics of agricultural holdings linked to irrigation.
– Water demand and consumption.
– Environmental
– Energy
Based on these previous studies, Chapter 4 summarizes the conclusions obtained. Thus, sections 4.2, 4.3, and 4.4 evaluate, respectively, irrigable and irrigated areas from various perspectives (irrigation systems, water source, allocations, infrastructure status, etc.), irrigable areas under development (administrative status, area characteristics, irrigation systems, soil, current production of the works, etc.), and new potentially irrigable areas.
To complete the diagnosis of the situation, in the following sections of chapter 4 an economic analysis of the farms in relation to irrigation is made (4.5), the problems of groundwater are studied (4.6), the distribution of irrigation in the different territorial spaces is analyzed (4.7), the state of the environment in relation to irrigation is summarized (4.8), the consumption and the overall demand of water is studied (4.9) and irrigation is evaluated in light of energy planning (4.10).
- Priorities, objectives and programming
The final step in planning is formalizing the priority of actions within the considered timeframe, determining the objectives to be achieved, and scheduling the necessary administrative procedures, timeline, funding, investments, etc. This is precisely the content of Chapter 5, which in section 5.2 establishes the priority and general objectives, and in section 5.3 specifies the actions, broken down into three types of actions (improvement, irrigation projects underway, and community irrigation projects), duly territorialized, and a support program (training, irrigation system evaluation, environmental monitoring, etc.).
Section 5.4 quantifies and territorializes the investments necessary to achieve the proposed objectives and the planned financing.
Finally, section 5.5 evaluates some of the expected effects of implementing the National Irrigation Plan, such as water consumption and savings, energy effects and the impact on employment.
3 Basic references of the agricultural sector and irrigation
3.1 The physical environment: climate, soil and water
Knowledge of basic resources is essential for any type of planning, and in particular for irrigation.
The physical factors that influence the development of irrigated agriculture are primarily climate, soil, and water. Climate, in terms of sunlight and temperature, determines the types of crops that can be planted and the productivity of irrigated land. Soil is less limiting, since irrigated areas tend to coincide with the best soils, and the area of land suitable for irrigation is much larger than that permitted by water resources and socioeconomic constraints. Water influences the development of irrigated agriculture based on its quality and availability.
3.1.1 Climate: precipitation and temperatures
The Iberian Peninsula as a whole falls within the temperate Mediterranean climate zone, characterized by cold winters and warm summers, with rainfall concentrated in spring and autumn and drought during the summer months. Despite these general features, there is a wide range of regional climates related to altitude, the complex topography of the territory, and its exposure to Atlantic fronts and Mediterranean influence.
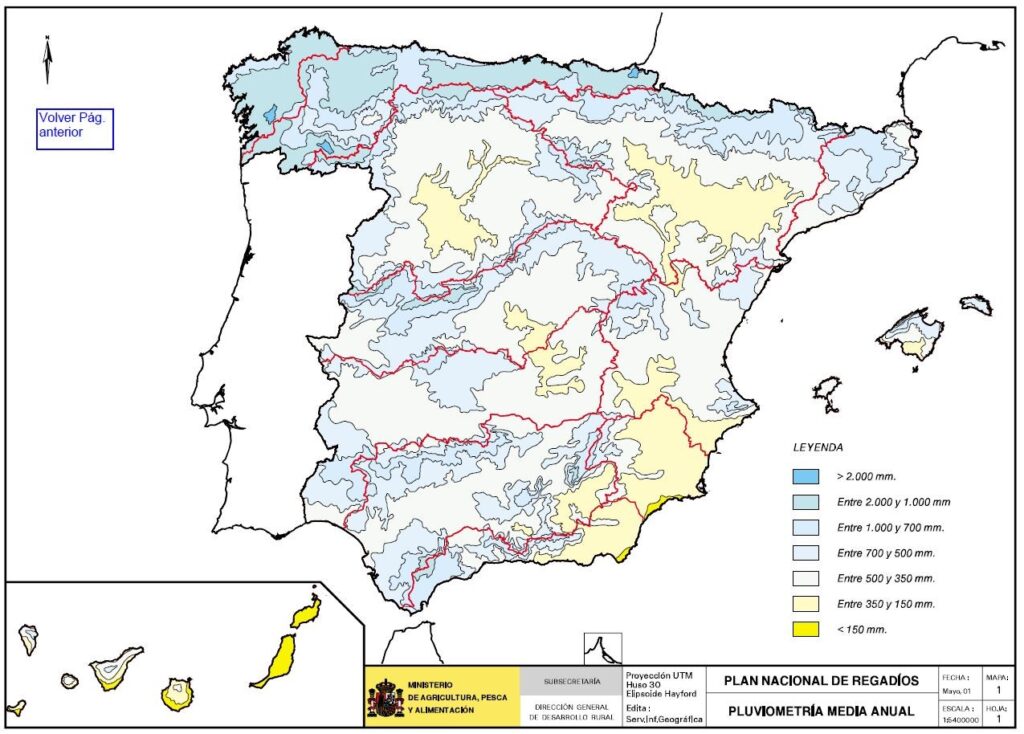
The existence of two distinct zones in the peninsula in terms of rainfall is clear: the "dry Spain" located in the south and the "humid Spain" located in the north.
The "humid Spain" region has average rainfall exceeding 800 mm, occasionally reaching 2,000 mm, and extends across the northern Iberian Peninsula from Girona to A Coruña, associated with the Galician, Cantabrian, and Pyrenean mountain ranges. It corresponds to the Galicia-Costa, Northern, and northern basins, as well as the northern part of the Internal Basins of Catalonia and the northern part of the Ebro basin. In inland areas associated with mountain ranges, humid zones are found amidst considerably drier areas. For example, the highest rainfall on the Iberian Peninsula, with 2,000 mm/year, is found in the Guadalquivir basin, specifically in the Sierra de Grazalema (Western Andalusia). Rainfall exceeding 700–800 mm/year also occurs in the Gredos Mountains, higher elevations of the Iberian System, the Guadarrama Mountains, the Sierra de Gata, the Sierra de Cazorla and Sierra de Segura, and other areas.
"Dry Spain" (400-600 mm) comprises the northern and southern plateaus, the Ebro basin (excluding the Pyrenees), the Levante region, the Guadalquivir basin, the southern basin, and most of the archipelagos. In the southeast and certain inland areas, the driest regions of the peninsula are found, with rainfall below 400 mm and sometimes even less than 200 mm.
The transition from dry to humid Spain takes place along intermediate zones, with rainfall between 600-800 mm, mainly in the foothills of the mountain ranges.
Regarding the seasonality of rainfall, one can differentiate between the Mediterranean regime, with maximums in spring and autumn, which extends mainly through the eastern part of the peninsula, and the oceanic regime, with winter maximums, which extends through the western and Cantabrian areas.
Summer drought occurs throughout the peninsula, although it is more acute in the southern half.
Analysis of temperatures reveals that annual averages exhibit significant variability in their spatial distribution, influenced by altitude and continentality. Regarding temperature fluctuations, the following can be distinguished:
Areas with a marked temperature range encompass the two plateaus and the Ebro Valley. Maritime influence is greatly diminished, and radiation mechanisms result in significant cooling during winter, with temperature inversions in the valleys where cold air accumulates and radiation frosts are frequent. In summer, these same processes cause a strong warming of the surface and the air in contact with it.
Areas along the northern edge and much of the Atlantic coast have mild winters and cool summers as a result of the Atlantic influence that is present throughout the year.
Areas of the Mediterranean coast have warm winters due to the maritime influence and the orographic sheltered position against the cold northern flows, and very hot summers due to the small size of this sea and the frequent inversions of warm air.
3.1.2 Agroclimatic types
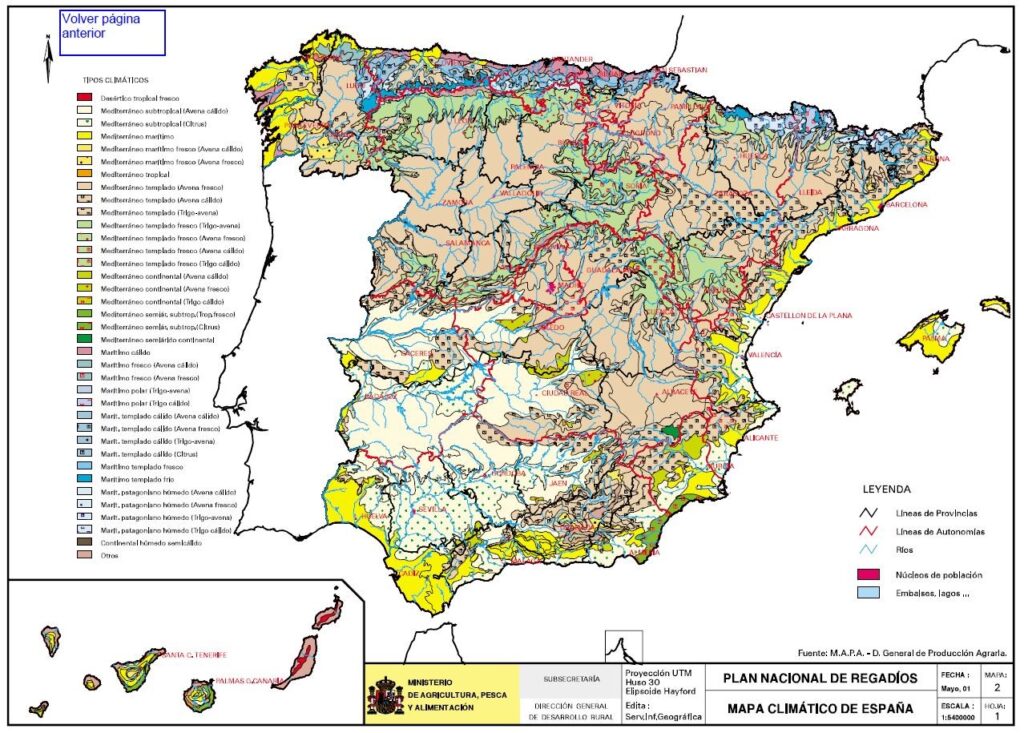
The climatic characterization of the country has been carried out based on the Papadakis agroclimatic classification obtained from the National Agroclimatic Atlas.
The system developed by Papadakis is based on the principle and originality of defining the nature and potential of a climate in terms of the crops that can grow there. To this end, and in accordance with the ecological needs of cultivated plants, it orders them according to their winter and summer temperature requirements, as well as their resistance to frost and drought. This allows for the definition of a zone or season using specific indicator crops whose requirements are known and met within that zone.
He considers that the fundamental characteristics of a climate that affect the development of crops are two: the thermal regime in its two aspects, winter type and summer type, and the humidity regime.
In relation to the major climate types or ecoclimates, the following fundamental groups are represented in Spain: the Mediterranean, which with its various variants occupies the largest surface area, the maritime, the continental and, finally, the desert which is present in a reduced area in the Canary Islands.
In the corresponding chapter dedicated to the characterization and classification of existing irrigation systems, the distribution and location of irrigation systems in the different climatic types predominant in the country are detailed.
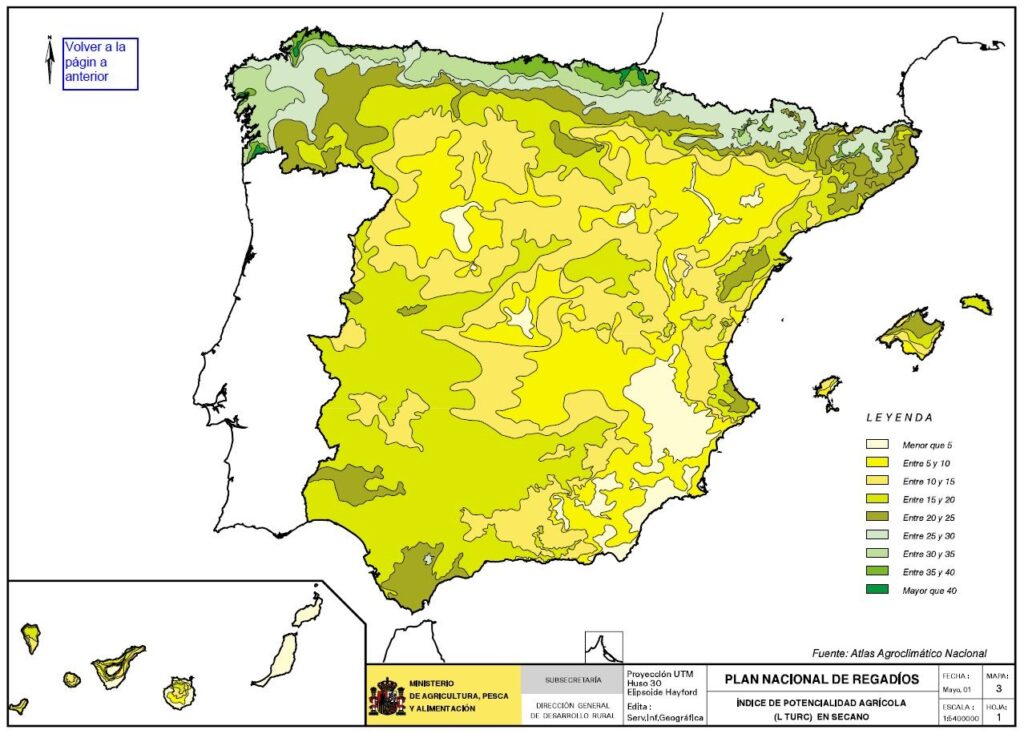
3.1.3 L. Turc's Agricultural Potential Climate Index
Turc's climate index of agricultural potential allows one to establish the productive potential of a territory and to compare this potential between different areas.
The method is based on the existence of a correlation between the values of certain climatic variables, over a given period (a month, a season, a year) and the production, expressed in metric tons of dry matter per hectare, of a plant adapted and cultivated under normal current technical conditions, that is, on well tilled and fertilized soil.
Although the production-index relationship differs for different crops, it is clear that only the numerical value of the index allows for ranking areas according to their higher or lower productive capacity. Within this framework, a distinction will be made between the results obtained under dryland conditions and those obtained under irrigation (assuming that water supply does not act as a limiting factor).
Comparing the annual index for dryland and irrigated land in the same location allows us to establish the overall increase that the transformation to irrigated land represents from a productive point of view in the area considered.
Secondly, once the growing conditions are established, whether dryland or irrigated, the index facilitates the comparison of interzonal productive potentials with respect to a given crop, expressing the differences attributable to any of the climatic factors integrated in its elaboration, in strictly productive terms.
The Turc index for dryland ranges, for the entire national surface, between values below 5 and close to 45. The lowest indices are located in both sub-plateaus and in the southeast and the highest indices in the coastal areas of the Cantabrian and, more specifically, in the Cantabrian-Pyrenean mid-mountain area.
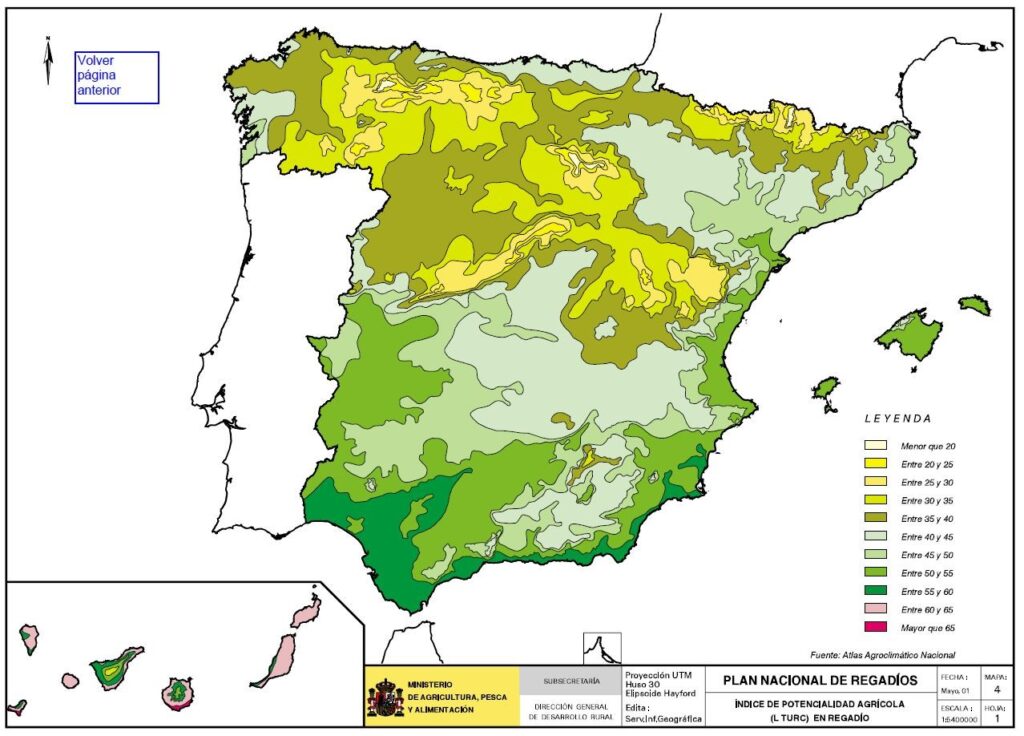
For irrigation, the lowest indices are found in the inland highlands with values close to 15. The maximum potential corresponds to the entire Mediterranean coastal strip and its Atlantic continuation, extended to the Guadalquivir depression, with index values around 60. In this area, the maximum agricultural potential corresponds to the southeast and islands of the Canary archipelago where the value exceeds 60 and in some stations reaches over 65.
3.1.4 The soil
For the general study of land characteristics, the CSIC's 1:1,000,000 soil map, covering the entire national territory, was used. Its units can be converted to their equivalents in other classifications (USDA and FAO Soil Surveys). Land use studies at a scale of 1:100,000 and the crop and land use maps and agro-ecological classifications at a scale of 1:50,000, carried out by the Ministry of Agriculture, Fisheries and Food, were also considered, as were land use studies conducted by the Directorate General for Rural Development in the different river basins. The general characteristics of the land, currently under irrigation and in areas potentially slated for conversion, were also evaluated.
The objective is to provide an overview of current irrigation systems, with their problems due to limitations in their physical parameters, climate, soil and irrigation water, and, on the other hand, to provide an overview of the lands in the different basins for new transformations.
The study by basin shows the high climatic potential of the southwest, south, Mediterranean coast, and archipelagos with soils suitable for irrigation. Even when the soil is not suitable, the creation of artificial soils is a fairly common practice.
It often appears that the soil factor is not the most limiting factor for the implementation of various irrigation systems, with water being more important, both in quality and quantity, and the climate as a determining factor for certain crops.
3.1.5 Water
The water resources of peninsular Spain, with its nearly 500,000 km² surface area, are determined by its topography, climate, and geographical location. The average annual rainfall of 684 mm, equivalent to 346,000 hm³/year, results in an average runoff of 220 mm, providing a volume of natural resources in an average year of 111,000 hm³. Of this, slightly more than 82,000 hm³ are surface water and approximately 29,000 hm³ are groundwater, with roughly 2,000 hm³ corresponding to aquifers that drain directly into the sea.
Of the country's total water resources, only 91% are usable in their natural state, with a uniform demand. This percentage drops to less than 51% for variable irrigation demand, where needs during the dry months significantly exceed those during the wet months. This has necessitated the construction of numerous dams (1,174) with a total reservoir capacity, including smaller ones, of 56,000 hm³, although the available regulated resources are reduced to 43,000 hm³. Not all natural resources could be economically regulated; the potential regulation ceiling is estimated at around 70,000 hm³.
The geographical distribution of water resources is highly uneven. The northern zone, comprising 111% of the Spanish peninsular area, contributes 401% of the resources, but at a high cost for their use. The remaining 891% of the area supplies 601% of the resources, has below-average runoff, and exhibits varying values within it (the Ebro, Duero, Tagus, and Eastern Pyrenees have higher values). Similarly, coverage per capita varies (the Levante coast and the Canary Islands have the lowest rates).
From the perspective of resource management, the national territory is divided into river basins defined in the Water Law as the territory in which waters flow to the sea through a network of secondary channels that converge into a single main channel.
River basins can be inter-community when the territory they comprise belongs to several Autonomous Communities and intra-community when they are included in a single Autonomous Community.
The intercommunity basins are organically dependent on MIMAM, and the intracommunity basins (Galicia Costa, Internal Basins of Catalonia, Balearic Islands and Canary Islands) have been transferred to the respective Autonomous Administrations.
For the purposes of natural resources, watersheds are divided into hydrographic zones and subzones. For the management of available resources, in order to meet water demands, they are divided into exploitation systems and subsystems. A summary of both zoning classifications is shown in the following table.
HYDROGRAPHIC BASINS: SURFACE AREA (km²)2), ZONES AND MANAGEMENT SYSTEMS
| Basin | Area (km2) | Zones (resources) | Management systems | |||||||||
|---|---|---|---|---|---|---|---|---|---|---|---|---|
| Number of Zones | Number of Subzones | Number of Systems | Number of Subsystems | |||||||||
| Galicia Coast | 13.916 | 2 | — | — | — | |||||||
| North | 40.813 | 6 | 13 | 28 | 35 | |||||||
| Douro | 78.056 | 5 | 12 | 4 | 12 | |||||||
| Block | 55.769 | 14 | 77 | 5 | 10 | |||||||
| Guadiana | 59.873 | 9 | — | 5 | — | |||||||
| Guadalquivir | 63.085 | 10 | 20 | 15 | — | |||||||
| South | 18.391 | 5 | 16 | 5 | 16 | |||||||
| Safe | 18.631 | 14 | 34 | 1 | — | |||||||
| Júcar | 42.904 | 9 | — | 9 | — | |||||||
| Ebro | 86.098 | — | — | 28 | 32 | |||||||
| Catalonia CI | 16.493 | 3 | 13 | 4 | 9 | |||||||
| Balearics | 4.700 | — | — | 4 | — | |||||||
| Canary Islands | 25.994 | — | — | 16 | 25 | |||||||
3.1.6 Summary
Spanish agriculture operates under more difficult physical conditions than other agricultural systems with which it has to compete.
Extreme temperatures, both in winter and summer, hinder alternative crops or place them in marginal situations.
Rainfall is not only scarce across much of the country, but it is also unevenly distributed throughout the agricultural year. The vulnerability of Spanish agriculture to the physical environment is reflected in the nearly 3.5 million hectares of agronomic fallow land annually; this figure is similar to that of irrigated land, which represents the effort made to, on the one hand, cope with the scarcity of water, an essential element for productive activity, and, on the other hand, take advantage of the favorable sunlight and light conditions of the Mediterranean climate.
The physical diversity of the regions is very high and determines very diverse types of agriculture, with a certain productive specialization, which gives rise in many regions to a great economic and social dependence on a specific crop (olive groves and vineyards, for example).
3.2 Demographics and working population
3.2.1 Introduction
In studies of economic development problems, the demographic conditions of territories affected by growth processes are considered a critical factor for the success of any programs or measures that may be conceived, whether we are talking about development strategies embedded in a plan or about more spontaneous, endogenous initiatives. In both cases, the sustainability of investments depends very essentially on the human resources committed to the project.
Implementation of irrigation involves one of the rural development measures with the strongest territorial impact, clearly affecting the populations concerned, modifying population expectations in the immediate term and opening up other expectations with long-term repercussions.
A category that is both demographic and economic is the fraction of the total population that can engage in economic activity, that is, those who actively participate in economic life. The evolution of the active population, as well as its structure and distribution across the territory, provides a measure of productive potential, of the employment capacity that can be effectively mobilized by a development initiative such as the irrigation of an area or region.
Demographic potential and labor potential shape the framework of development programs that consider the territorial resonance of their action programs.
Within the framework of irrigation planning, which by its very nature has a direct impact on the territory, it is necessary to consider the following significant headings: Evolution and annual growth or regression rates of the population and territorial distribution of the population, the evolution of the agricultural population and its relationships with the activity as a whole as well as its relationships with the transformation into irrigated land.
3.2.2 Evolution in the Spanish population
The Spanish population has evolved differently than in neighboring countries, in a context of higher growth rates for Spain. However, in recent years this growth pattern has changed, representing a shift in trend. Currently, the Spanish population growth rate is comparable to that of the EU and even slightly lower if immigration is excluded.
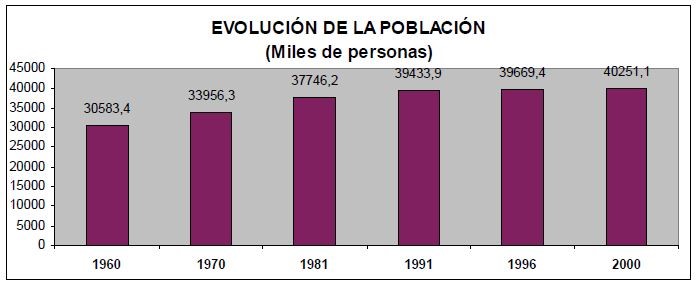
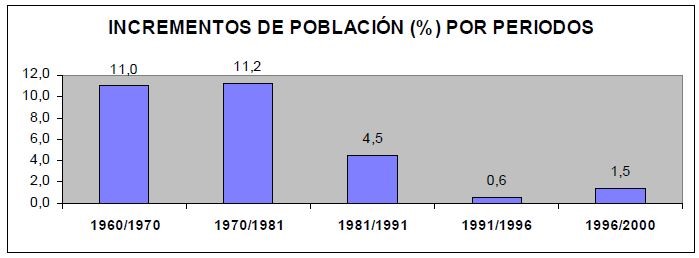
The Spanish population has increased from 30,583,466 inhabitants in 1960 to 40,251,100 inhabitants in 2000. However, the population has evolved towards a decrease in growth rates, which have gone from 1.011% per year between 1960 and 1981 to 0.44% per year between 1981 and 1991, continuing its negative evolution between 1991 and 1996 when it reached 1.5% per year.
In the last period analyzed there has been some recovery of this regressive trend, caused mainly by the growth of immigration, which however does not prevent the estimates of growth rates from being negative from the year 2011 onwards, if the current demographic trends are maintained and in the absence of migratory movements.
Viewed as a whole, the Spanish population has evolved as shown by the following indicators, which clearly express a process of approximation to the demographic parameters of all European countries.
DEMOGRAPHIC INDICATORS
| Indicators | 1960 | 1970 | 1981 | 1991 | 1996 | 1998 |
|---|---|---|---|---|---|---|
| Crude Birth Rate (‰) | 21,6 | 19,5 | 14,1 | 10,1 | 9,23 | 9,37 |
| Crude Mortality Rate (‰) | 8,7 | 8,3 | 7,8 | 8,6 | 8,95 | 8,88 |
| Vegetative Growth (‰) | 12,9 | 11,2 | 6,3 | 1,5 | 0,28 | 0,49 |
| Life expectancy at birth (years) | 69,8 | 72,3 | 75,6 | 76,9 | 78,3 | * |
| Survival Rate > 65 years (number per 100,000) | 74,5 | 78,1 | 82,4 | 84,1 | 85,8 | * |
The demographic change that has occurred in Spain in the last forty years has meant a fall in the gross birth rate of 12.2 points (from 21.6 to 9.4 births per thousand inhabitants) while the mortality rate has remained stable, which has led to a strong aging process, with effects of different intensity depending on the degree of rurality of the population centers.
Both the growth in life expectancy at birth, which has experienced an increase of 8.5 years in the period 1960-1996, and the survival rate of the population over 65 years of age, which has grown by 11.3 points, clearly express the conditions of foreseeable evolution of the population and its foreseeable repercussions on the structure of social services.
There has been a trend in the rates of natural growth towards demographic stagnation, going from an annual population contribution of 12.9‰ to the incorporation of less than half a point in 1998. (0.49‰).
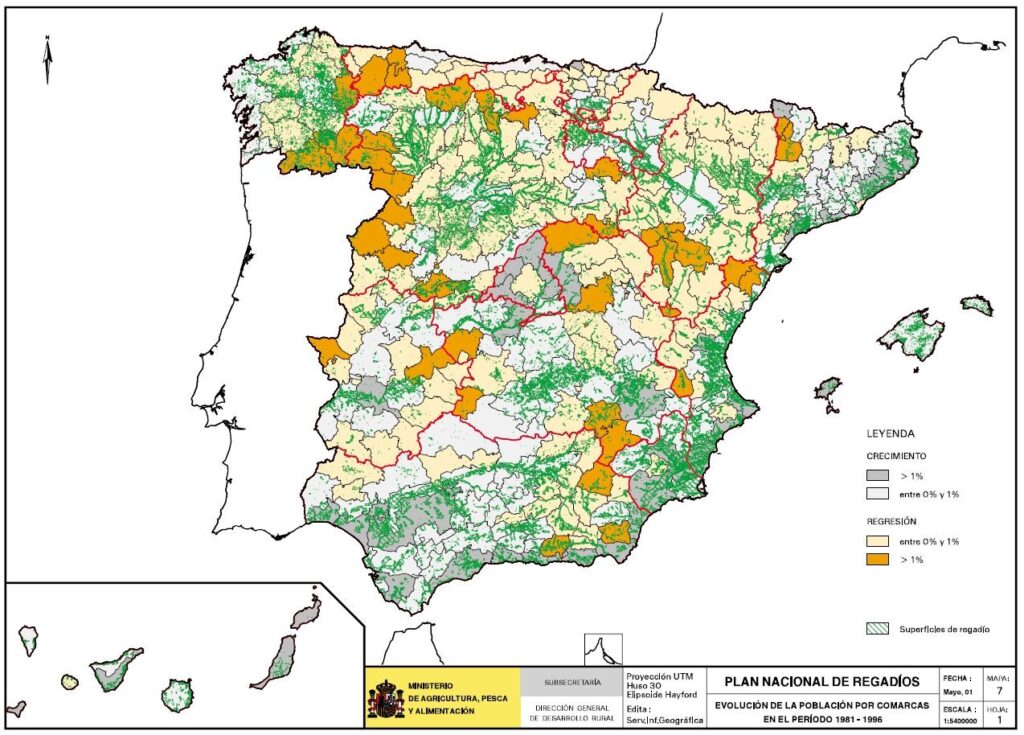
Beyond the global perspective considered above, map no. 7 shows the evolution of the Spanish population on the territorial basis that constitutes the agricultural regionalization prepared by the Ministry of Agriculture, Fisheries and Food and published in 1996, which is considered the most appropriate to relate to the irrigated areas.
The cumulative annual population growth rates at the district level between 1981 and 1996 (or their negative values: demographic decline) allow us to observe its evolution and highlight the trend toward depopulation of inland districts, with a steady transfer of population to coastal regions and large urban areas. The trend at the district level refers to 1996, as it is the last year for which official population register data is available until the next population census in October 2001.
The population loss during the period 1981-1996 is clearly evident in the districts covering the territory known as inland Lusitania, extending to the irrigated area of the Lower Guadiana Valley. In this area, a demographic recovery occurred and continued southward to the irrigated area of the Chanza River. Many mountainous districts of the Central, Iberian, and Betic Systems are experiencing severe depopulation, all of which have very little irrigated land, with the exception of some older irrigated areas (such as El Rosarito).
Comparing population densities between the two periods mentioned allows for a more nuanced understanding of the information provided regarding the evolution of annual population growth rates by relating population to the territory occupied. Maps nyou Figures 5 and 6 reflect the regional population densities of the years 1991 (Census) and 1996 (Register), establishing four recognized categories of rurality limits: The first, according to the Commission's criteria (Directive 466/86/EEC), sets the population limit for disadvantaged areas at 50% of the national average density, which is why the interval in which the average density of Spain is found is different in each map (77 inhabitants per km2 in 1991 and 79 in 1996).

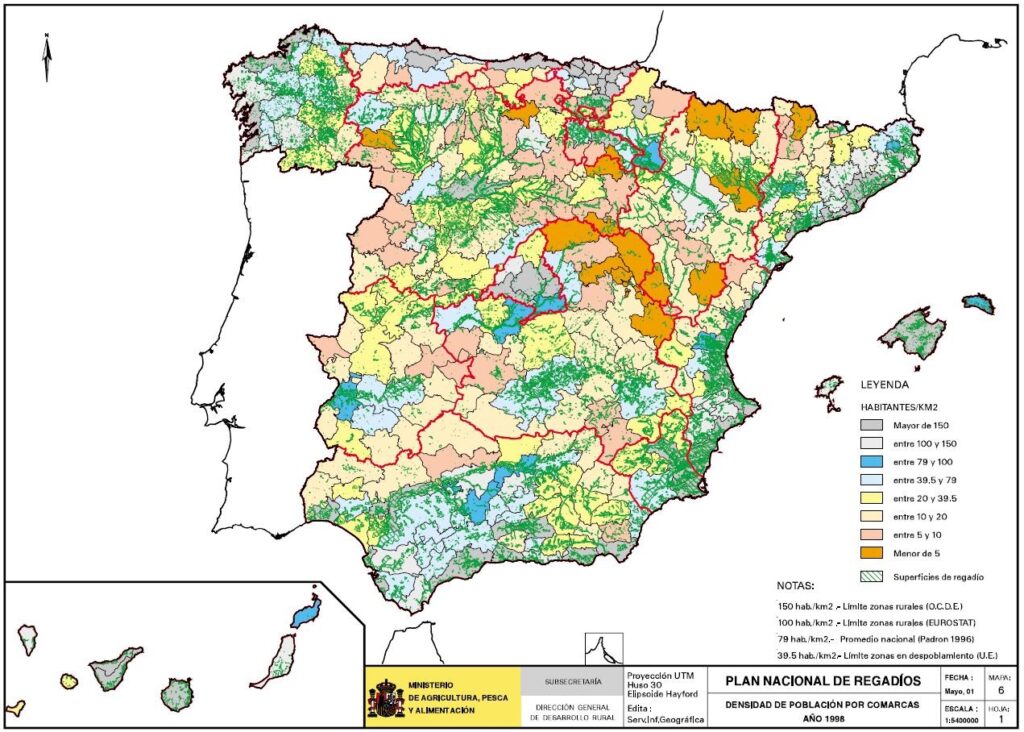
The maps incorporate the rurality limits according to Eurostat and the OECD respectively, located at 100 and 150 inhabitants/km²2 which have been widely used by their respective bodies for the formulation of their territorial strategies or their studies and reports.
The maps show the regions with the most serious depopulation problems (regions with population densities of less than 10 inhabitants/km²).2 ) in the profiles of the mountain systems, although the threat to the central system and the Rioja mountain ranges and some areas of the cereal-growing plateau of Castile and León should be emphasized. The series of districts that make up inland Lusitania, which do not have the support of irrigated agriculture, are also within the threatened areas, with population densities of less than 20 inhabitants/km².2 which can be considered as the upper limit of the threatened areas.
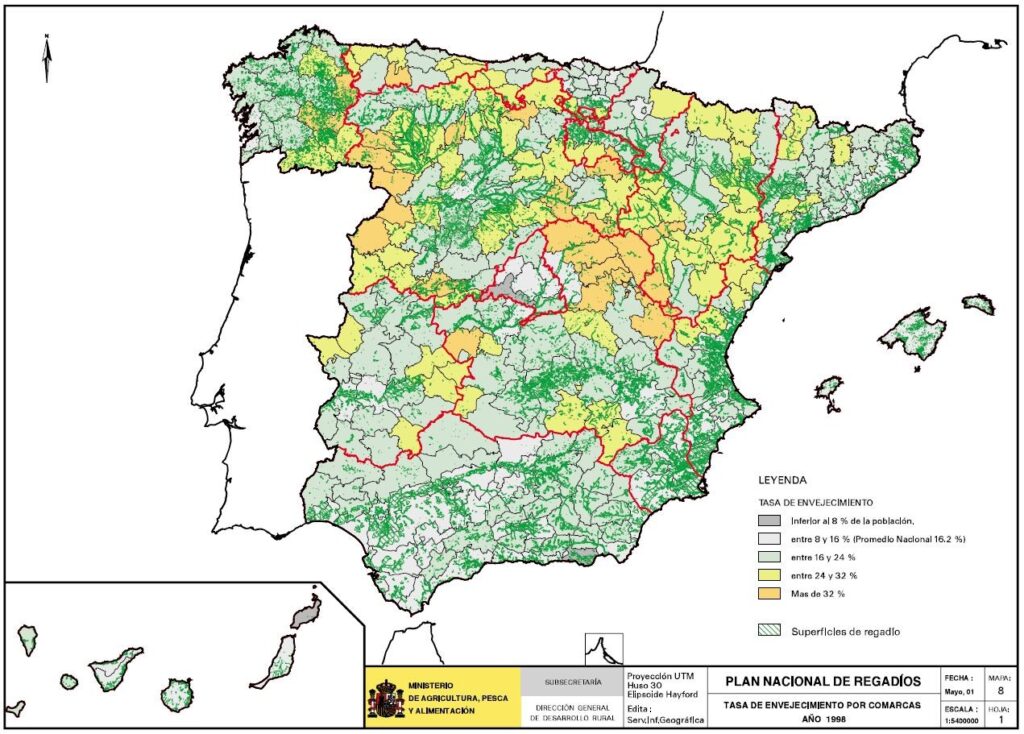
Map 8 details the uneven distribution of the population from the perspective of the proportion of people of retirement age, which is concentrated in areas that have suffered the most severe demographic erosion, resulting in lower population densities. These areas are therefore simultaneously older and more depopulated, reaching levels of serious decline in mountainous regions. Both Castiles show significant signs of aging, mitigated by the presence of irrigated areas in some districts, a phenomenon also observed in the Ebro Valley. The areas with the least aging cover only the portion of the territory in the coastal districts of the Mediterranean and South Atlantic arcs where the greatest territorial complexity coincides with metropolitan areas, areas of great tourist importance, and irrigated areas of significant economic importance. The Guadalquivir basin presents a unique case in this territorial distribution, possibly attributable to the demographic vitality of that region.
3.2.3 Population evolution in rural areas
The European Union has established in its structural action policy a definition of rural space that does not imply a simple geographical delimitation but refers to the economic and social fabric that encompasses diverse activities and includes natural and cultivated spaces, as well as villages, towns, small cities and regional centers. (Future of the Rural World, 1988, 39) This definition, covering a very large territory (more than 80% of the surface area of the European Union), has required more operational definitions based on population density or the number of inhabitants.
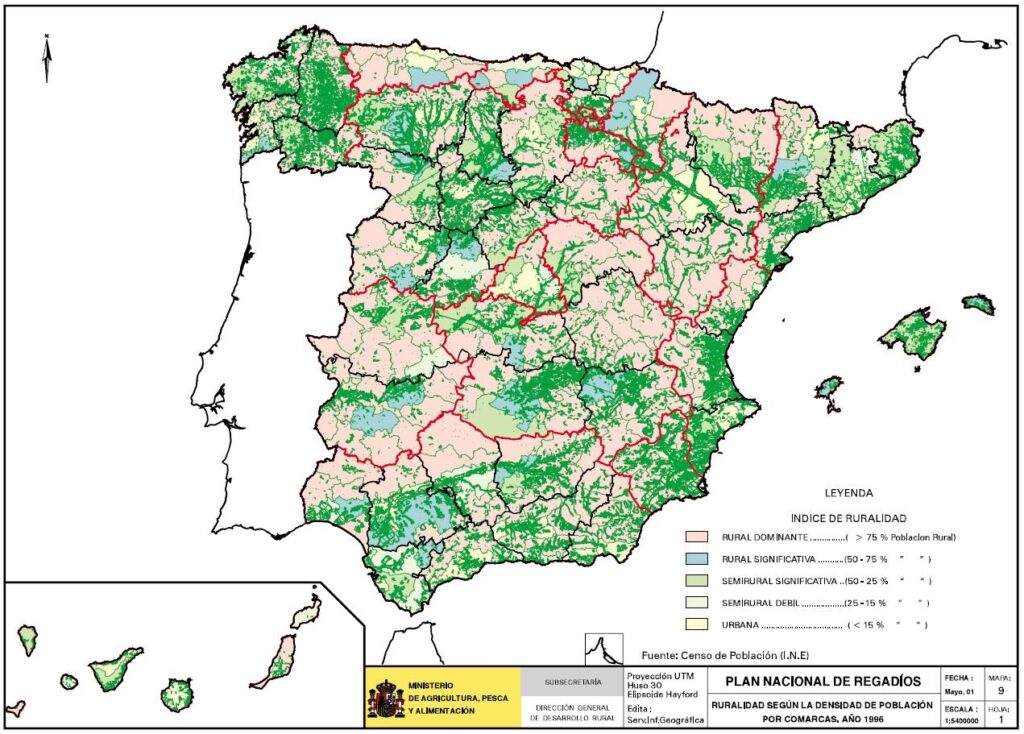
One of the most used variables for assessing the degree of rurality in successive community initiatives related to rural areas is population density. Map No. 9, which details the degree of rurality of Spanish regions, is presented based on the proportion of municipalities with rural densities, according to community regulations, considering the density limit at 120 inhabitants per km².2. In accordance with the provisions of the Community Initiatives, this map allows for the linking of rural municipalities and urban structures within Spanish regions, acknowledging that every region contains some degree of rurality. The map thus details a gradient of rurality that facilitates a typology.
From a census point of view, the data from the Register in 1999 in Spain showed a population of 40,202,760 inhabitants, of which 51% lived in municipalities with more than 50,000 inhabitants and 15.4% in municipalities with less than 5,000 inhabitants, as detailed in the attached table.
POPULATION IN THE MUNICIPAL ENTITIES IN 1999
| | Less than 5,000 | From 5,000 to 10,000 | From 10,000 to 20,000 | From 20,000 to 50,000 | Of more than 50,000 | SPAIN | ||||||
|---|---|---|---|---|---|---|---|---|---|---|---|---|
| No. | % | No. | % | No. | % | No. | % | No. | % | No. | % | |
| Population in 1999 | 6.174.909 | 15,4 | 3.517.474 | 8,7 | 4.611.424 | 11,5 | 5.415.173 | 13,5 | 20.483.780 | 51,0 | 40.202.760 | 100 |
In the period from the 1960 census to 1996, there was a complete transformation of the territorial distribution of the population, resulting in a 47.1% decrease in the population residing in settlements with fewer than 5,000 inhabitants and a 46.3% increase in the population of cities with more than 50,000 inhabitants. In other words, the number of municipalities with more than 50,000 inhabitants existing in 1960 increased by 59.5%. The following table details the population trends in each census period. The table allows us to appreciate the sharp trend towards rural depopulation, for which the calculation of the variation of the rural or semi-rural population (the singular entities of less than 10,000 inhabitants, according to the INE) and the populations in population aggregates of more than ten thousand, more than twenty thousand and more than 50,000 has been reiterated, in which we understand the scope of the definition of community rurality concludes.
VARYoA.C.YoÓN OF THE POPULATION (%) OF THE NUCLEI ACCORDING TO THEIR SIZE
| Period | Less than 5,000 | From 5,000 to 10,000 | Greater than 10,000 | Over 20,000 | Over 50,000 | SPAIN |
|---|---|---|---|---|---|---|
| 1960/96 | -47,1 | 37,5 | 40,9 | 45,5 | 46,3 | 29,5 |
| 1970/96 | -22,1 | 22,4 | 23,8 | 26,3 | 26,1 | 16,7 |
| 1981/96 | -6,8 | 7,8 | 7,8 | 6,8 | 4 | 5,1 |
| 1991/96 | -1,3 | 3,3 | 2,6 | 1,6 | 1,1 | 0,6 |
From a territorial point of view, this has led to the formation of large metropolitan areas that cover extensive territories, with the emergence of peri-urban agriculture in significant proportions in those regions where agriculture and conurbations coexist, determining the interaction between several large cities within a regional space.
Settlement has evolved in a way that is consistent with the redistribution of the population, and two periods can be identified in the recent distribution of population and habitat:
During the period from 1981 to 1991, while 57.9% of municipalities with fewer than 2,000 inhabitants lost more than 10% of their population and 13.2% grew above the national average, only 25.6% of intermediate-sized municipalities (2,000 to 5,000 inhabitants) experienced losses exceeding 10%. However, in these municipalities, 27.7% grew above the national average for their group, demonstrating an irregular trend across the country. For municipalities with more than 5,000 inhabitants, the proportion of growing population centers is greater than the proportion of those losing population, thus highlighting both population restructuring mechanisms and the trend toward demographic concentration starting from the most rural areas.
EVOLUTION OF HABITAT STRUCTURE IN THE PERIOD 1981-1991
| Municipalities by number of inhabitants | Growing municipalities | Municipalities in decline | Totals | ||||||
|---|---|---|---|---|---|---|---|---|---|
| Growth above the national average | Growth between the final average. and 0 | Decrease between 0 and 10 % | Decrease greater than 10 % | ||||||
| No. | % | No. | % | No. | % | No. | % | ||
| < 2,000 | 770 | 13,2 | 238 | 4,1 | 1.446 | 24,8 | 3.371 | 57,9 | 5.825 |
| 2,000 to 5,000 | 303 | 27,7 | 115 | 10,5 | 396 | 36,2 | 280 | 25,6 | 1.094 |
| 5,000 to 10,000 | 229 | 42,3 | 66 | 12,2 | 157 | 29,0 | 89 | 16,5 | 541 |
| 10,000 to 20,000 | 183 | 57,2 | 57 | 17,8 | 57 | 17,8 | 23 | 7,2 | 320 |
| 20,000 to 50,000 | 112 | 63,6 | 30 | 17,0 | 27 | 15,3 | 7 | 4,0 | 176 |
| > 50,000 | 70 | 57,9 | 18 | 14,9 | 28 | 23,1 | 5 | 4,1 | 121 |
| Spain | 1.667 | 20,6 | 524 | 6,5 | 2.111 | 26,1 | 3.775 | 46,7 | 8.077 |
Population losses during the period 1981-1991 in the centers with fewer than 2,000 inhabitants, that is, the most rural ones, are distributed between the two Castiles and Aragon (48 % of the total of the municipalities that have lost more than 10 % of their population) these Autonomous Communities are at the same time the ones that have the most important number of municipalities in this category (44.2 % of the total of municipalities with less than 2,000 inhabitants).
EVOLUTION OF HABITAT STRUCTURE IN THE PERIOD 1991-1999
| Municipalities by number of inhabitants | Growing municipalities | Municipalities in decline | Totals | ||||||
|---|---|---|---|---|---|---|---|---|---|
| Growth above the national average | Growth between the final average. and 0 | Decrease between 0 and 10 % | Decrease greater than 10 % | ||||||
| No. | % | No. | % | No. | % | No. | % | ||
| < 2,000 | 1.182 | 19,9 | 401 | 6,7 | 2.072 | 34,8 | 2.291 | 38,5 | 5.946 |
| 2,000 to 5,000 | 344 | 34,1 | 156 | 15,5 | 417 | 41,4 | 91 | 9,0 | 1008 |
| 5,000 to 10,000 | 238 | 46,3 | 98 | 19,1 | 155 | 30,2 | 23 | 4,5 | 514 |
| 10,000 to 20,000 | 202 | 61,2 | 55 | 16,7 | 68 | 20,6 | 5 | 1,5 | 330 |
| 20,000 to 50,000 | 127 | 68,6 | 29 | 15,7 | 12 | 6,5 | 17 | 9,2 | 185 |
| > 50,000 | 57 | 48,3 | 28 | 23,7 | 33 | 28,0 | 0 | 0,0 | 118 |
| Spain | 2.150 | 26,5 | 767 | 9,5 | 2.757 | 34,0 | 2.427 | 30,0 | 8.101 |
During the period 1991–1999, 38.5% of municipalities with fewer than 2,000 inhabitants lost more than 10% of their population, while 19.9% of this same group grew above the national average, halving the population decline trend in small rural municipalities (one municipality grew for every two that declined in 1999, compared to the ratio of one for every four in the previous period). Intermediate-sized municipalities showed a similar pattern, with 34.1% of the cohort growing and only 9% of this group losing population at rates exceeding 10%, whereas in the previous decade the relationship between growth and loss was practically equal. For municipalities with more than 5,000 inhabitants, the proportion of population centers growing above the national average is greater than that of those losing population, a situation consistent with that of the previous period. Likewise, compared to the previous decade and to municipalities with more than 10,000 inhabitants, there is a noticeable increase in the percentage of municipalities losing population exceeding 10%.
3.2.4 Population evolution and irrigation
The impact of irrigation on demographic trends is undeniable, although the patterns of influence are by no means linear. In general, regions with irrigated land maintain higher population densities and positive annual growth rates; where population decline occurs, the rate of emigration is slower than in areas without irrigation.
In the case of the regions of the Atlantic-Mediterranean coastal strip (see maps 5 and 6) which accumulate some of the areas with the highest population densities and surface area with long-standing irrigation and ample supply, several growth factors come together, that is, they grow both because of internal migration and their own development potential.
Compare the cumulative annual growth rate of Spain (0.33 % annually between 1981 and 1996) with those corresponding to the set of these regions (above 1 % annually) as detailed in map no. 7.
Regarding inland irrigation, the relationship between population growth and irrigation is equally evident, although more nuanced. The Ebro and Guadalquivir basins stand out for the convergence between irrigated areas and higher population densities, especially in the upper Ebro, the Guadiana plains, and the districts of Campo de Calatrava, La Mancha, and Central Albacete, which exhibit a territorial condition that could be described as "demographic islands" given the surrounding low population density.
The irrigated areas of the Duero and Tagus river basins exhibit a less clear demographic pattern. In a climatic context that does not allow for explosive variations in productivity due to irrigation, the function of irrigation, from a population perspective, lies in mitigating migratory pressure, thus maintaining a population level that sustains territorial viability, which would be problematic without it. Maps 5 and 6 show how the areas surrounding the districts with irrigated zones along the Duero are generally below the population levels corresponding to irrigated areas. In short, while in other areas irrigation is a measure of rural development, in these districts it can be understood as a measure to support rural development.
Taken together, the population in the different regions with irrigated areas shows the following evolution:
POPULATION EVOLUTION IN IRRIGATED AREAS (%)
| Regional area | 1970-81 | 1981-91 | 1991-99 |
|---|---|---|---|
| Less than 20 % | 7,8 | 3.4 | -0,5 |
| Between 20 and 50 % | 17,7 | 7,0 | 7,9 |
| More than 50 % | 20,7 | 6,0 | 5,4 |
| SPAIN | 11,2 | 4,5 | 1,9 |
For the purposes of this analysis, areas are considered significantly irrigated if at least 20% of their cultivated land is under irrigation. Among the areas below this threshold, 8.5 million people reside in regions where less than 2% of their cultivated land is under irrigation.
Comparing the population growth in irrigated areas across the three periods analyzed reveals that the intercensal population growth rates in irrigated areas are consistently higher than the national average for Spain. This indicates a population shift from non-irrigated to irrigated areas.
The population density in relation to the extent of the irrigated area of the region yields the following distribution:
POPULATION DENSITY (INHABITANTS/KM)2) ACCORDING TO THE IRRIGATED SURFACE
| National Average | < 20 % irrigated | >20 and < 50% irrigated | > 50% |
|---|---|---|---|
| 79 | 71 | 88 | 133 |
Overall, the most efficient irrigated areas are linked to urbanization processes that generate their own dynamics of economic diversification and development. Higher population densities overlap these two non-contradictory phenomena: the growing trend toward urban concentration represents higher levels of density that correspond to the presence, in many cases historical, of regions with very high proportions of irrigated land and significant occupational diversification.
The population structure compared between regions with and without irrigation shows differences in demographic response in the following aspects:
a) The age structure of irrigated areas is several points higher than that of non-irrigated areas in terms of the proportion of young population, which is simply an expression of the greater employment opportunities in the former.
b) Consistent with the above, population aging is more significant in areas without irrigation.
c) The rural world in general presents a serious trend towards the depopulation of the female population, especially of reproductive age, a problem that is considerably more serious in areas without irrigation than in irrigated areas: the sex ratio is balanced in the latter (100.52) while for the non-irrigated regions it is 95.3 %.
d) The replacement rate of the population entering and leaving the workforce is much more favorable in irrigated areas, standing at around 120 %, while non-irrigated areas face the problem of maintaining activity along with that of maintaining the replacement of population cohorts reaching retirement age.
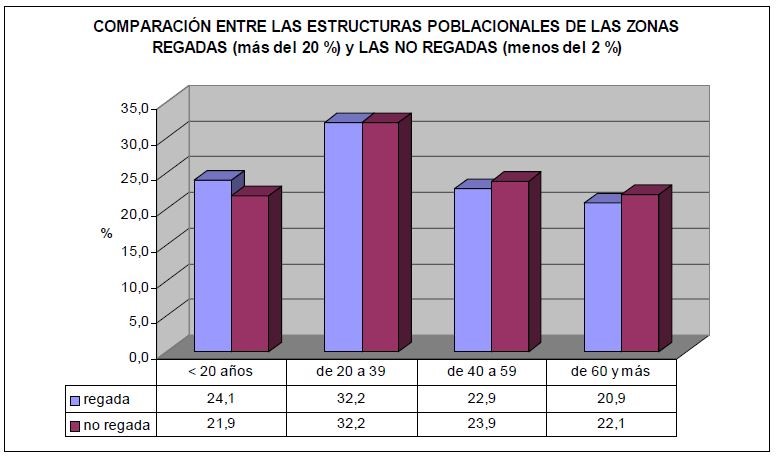
3.2.5 Problems of difficult rural areas
The major changes that have taken place in rural areas in recent years, expressed by a strong and constant reduction in the agricultural workforce, as well as the appreciable growth of economic diversification in these areas, have generated a redefinition of the role of the agricultural sector in rural development.
Furthermore, there has been a profound transformation of the rural occupational structure as a result of industrial relocation mechanisms and new information and communication technologies that have facilitated a greater link between rural areas and the global economic system, in addition to their traditional link with the agro-industrial system, generating a situation in which rural regions are perceived as growing alongside others in difficult conditions, with the former growing in population and economic potential and the latter losing resources.
Rural areas in difficulty may be affected by some of the following situations:
a) Areas pressured by the urbanization process
Rural areas and regions near large urban centers or included in metropolitan systems, generally well connected, occupy a large part of the coastal strip and the peri-urban environments of the large inland population centers.
Generally speaking, the main limitation facing agricultural production in these environments relates to the struggle against land-use change, particularly when urban development threatens the viability of farming. It should be noted that some of the most efficient and productive irrigated areas are located near urban centers and coastal conurbations, coexisting with urban sprawl. In both cases, the future of these irrigated areas must be carefully planned to protect and conserve the environment while remaining in harmony with the growing urbanization process.
Overall, these regions are experiencing growth in their agricultural workforce, along with increased wealth generation and diversification of their production structure. They are therefore not economically depressed regions and tend to face environmental problems and risks of reduced cultivated land. Consequently, improvements and consolidation of their irrigation systems must address the issues stemming from intensive water use, overexploitation of groundwater resources, the risks of soil and water salinization, and water scarcity.
b) Rural areas in decline
Rural areas with low-intensity, basically extensive agriculture and little economic diversification are located on the far periphery of the service centers or the most dynamic industrial activity clusters, constituting the bulk of rural agricultural areas.
These are regions that combine the loss of active agricultural population with the loss of rural population, although in recent times the migratory process has evolved favoring the formation of small urban centers in almost all rural environments, making possible an agriculture that responds easily to the condition of multifunctionality that society currently demands and makes possible the prospect of income complementarity in cases where rural development programs are contemplated that can integrate agricultural activities and complementary activities in the sense established in the current legislation on the modernization of farms.
The charts showing the evolution of the habitat structure reveal how municipalities with 10 to 20 thousand inhabitants, which gained population in 75% of cases during the intercensal period 1981 to 1991, have come to represent almost 78% in the period 1991-1999. Similarly, the group of small cities with around 20,000 to less than 50,000 inhabitants has also grown, going from 80.6% in 1991 to 84.3% in 1999.
A unique situation in extensive agricultural regions relates to the existence of large areas of traditional irrigation systems, primarily in Castile, Aragon, and Extremadura. These areas are highly dependent on a modernization policy that will allow them to improve their profitability and make more efficient use of water resources. The National Irrigation Plan (PNR) includes these areas within the aforementioned irrigation improvement and consolidation programs, promoting more efficient resource use and improvements to irrigation systems.
For other areas with declining agriculture, planning should include the introduction of small irrigation systems that respond to the concept of social irrigation because they are mainly aimed at strengthening territorial cohesion, consolidating the population residing in these regions and improving farmers' incomes.
The possibilities of attracting tourist resources as a source of diversification and the possibilities of agro-industrial implementation are an essential part of the rural development programs designed for these areas in their Leader or Proder modalities or within broader regional programs.
c) Marginal agricultural areas
Low-productivity agricultural areas, those that are difficult to access, and many mountain farming regions create an environment of very depopulated agricultural spaces with significant demographic viability problems (generally in these areas, the replacement of the active population is very problematic and the proportion of the population over 55 years of age is double the national average).
These areas can be located in some mountain regions and in areas near the border with Portugal, areas of the Iberian System and some regions spread between the two Castiles, Aragon and Extremadura.
Irrigation is very scarce in the aforementioned areas, and its potential in this respect is very limited. The main development strategies for this region are based on the environment and the landscape as a tool for development. This involves programs to promote local micro-enterprises in crafts, rural tourism facilities, and the assumption of local responsibility for the conservation of cultural heritage in harmony with the demands of rural development.
3.2.6 The agricultural workforce
From a global perspective, the demographic growth that has occurred over the last few decades has translated into a growth in the total active population, which has gone from 11,816,600 people in 1960 to 16,844,200 people in the year 2000, which represents a total growth for the aforementioned period of 42.5%, which reflects not only the census increase but also the equally growing incorporation of women into the economically active population.
However, the growth rate of the employed population has been significantly lower, rising from 11,640,900 to 14,473,700 people over the same period, representing a growth of 24.3%, almost half that of the working-age population. This gap between the growth of the labor force and the capacity of the economic system to generate employment has resulted in a negative trend in unemployment, which has increased from 1.49% in 1960 to 14.1% in 2000, according to the Labor Force Survey. The table showing activity and unemployment rates highlights a trend of growth in the working-age population over recent years (51.3% of the population over 15 years of age was active in 2000).
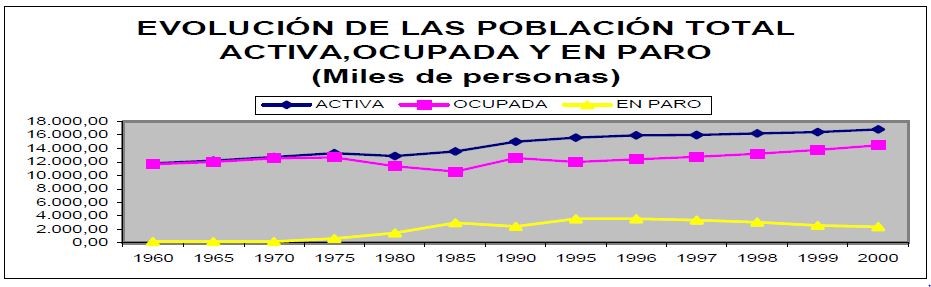
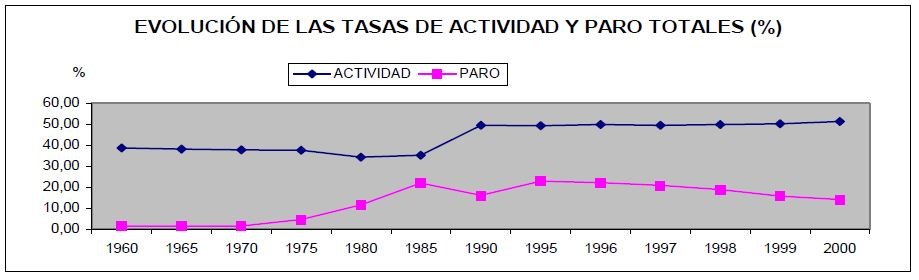
The unemployment rate shows a trend towards a regular decrease that favors bringing the weight of the employed population closer to the active population, although perhaps at too slow a speed, a matter that could be linked to the aforementioned speed of job creation.
From a territorial point of view, map no. 10 shows the regional distribution of dependency rates of the population residing in the districts, according to the information provided by the 1998 Register rectification. The dependency rate compares the amount of population that is outside the interval of potentially active population, either because it does not reach the threshold of entry into activity (child population) or because it has exceeded it (retirement age population) with the cohorts of population of productive age, that is, it indicates the burden of non-active population that corresponds to each person of working age.
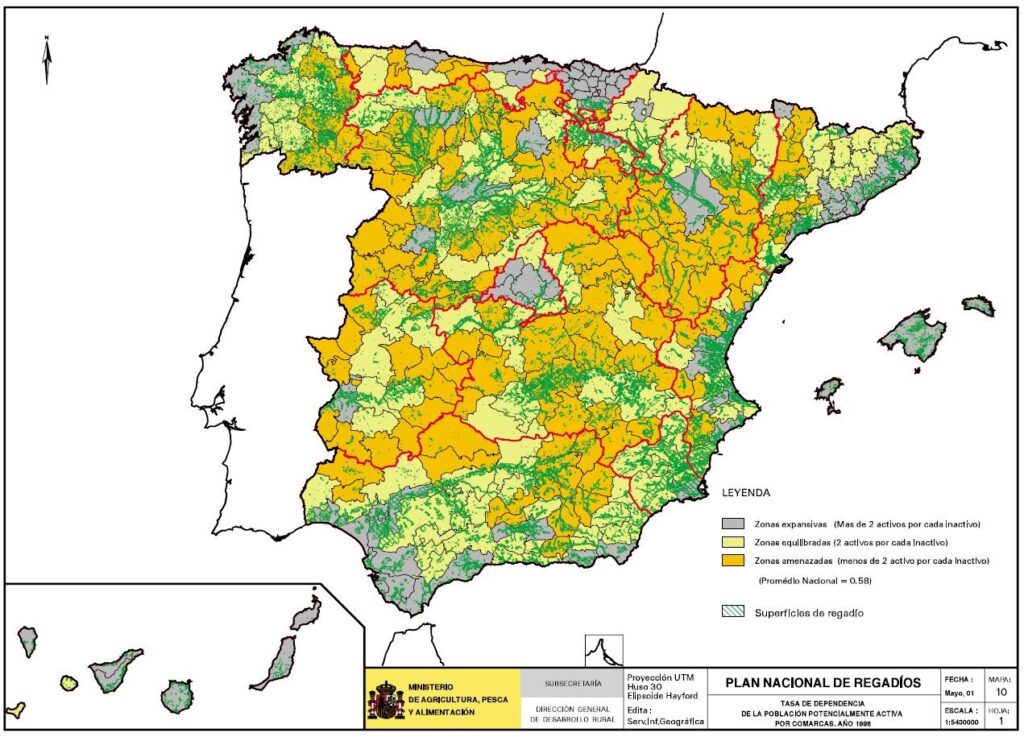
The territorial distribution of dependency ratios again shows that the more developed coastal regions, both agriculturally and non-agriculturally, are the areas with the greatest demographic potential, along with the inland metropolitan centers. Inland regions without access to irrigated land are in a very vulnerable position, with the number of working-age individuals being lower than the number of non-working-age individuals in some areas. This is compounded by the fact that the majority of the dependent population consists of former workers (those aged 65 and over), who, while currently representing a source of so-called "invisible income" (pension system benefits), pose a vulnerability in the longer term.
The agricultural workforce has steadily declined from 1960 to 2000, during which time it went from representing 40.76% of the total to 7.11% in 2000. From 1980 to 2000, the number of people employed in agriculture has decreased by one million.
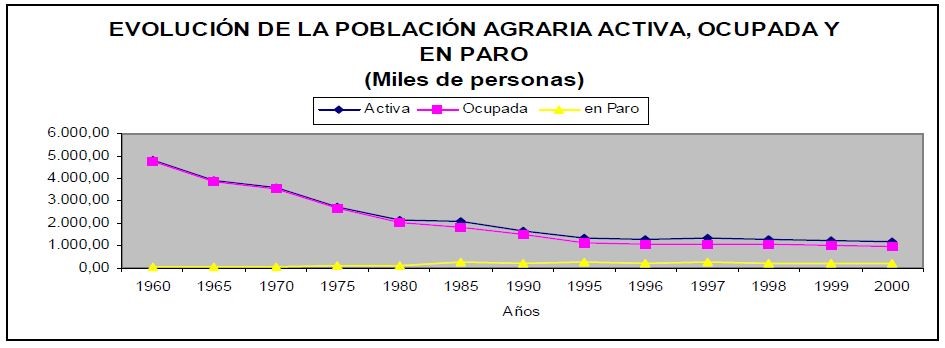
The estimate for 2008 is a minimum loss of 300,000 assets in the sector. This reduction in the number of agricultural assets is estimated based on the following reference data:
- The European average percentage of the agricultural workforce was 4.7% for 1999 according to Eurostat data
- The variation in the volume of agricultural labor across the EU is negative, ranging from a low in Ireland (-0.5 %) to a high in Germany (-6 %), with an overall EU average of -2.7 % (1996-97 period). The variation in agricultural labor in Spain is -3.3 %, indicating a faster rate of reduction in the agricultural workforce in Spain.
- The evolution of agricultural activity rates clearly illustrates the process followed by agriculture over the years in the successive stages of modernization of Spanish agriculture, from the initial transformation of agriculture in the 1960s to access to inter-community and international competition from the mid-1980s onward. The trend toward a decline in the agricultural workforce can be considered an effect, among other factors, of productivity growth.
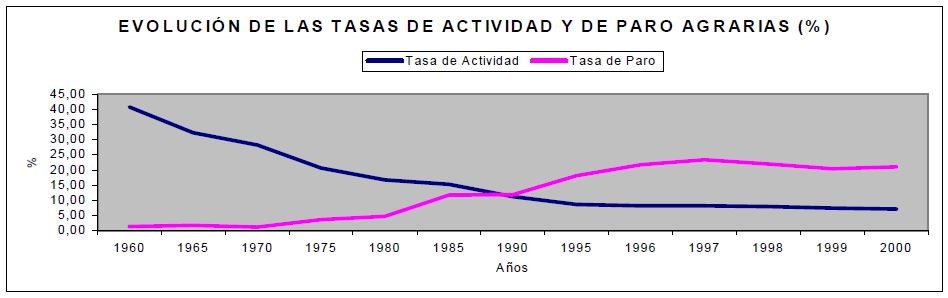
The sharp decline in the agricultural workforce is accompanied by a high growth in labor productivity, which, although already very intense after the crisis of traditional agriculture in the 1960s and 70s, has been even greater since 1980. Between 1980 and 2000, the agricultural workforce fell from 2,049,500 to 988,850, and agricultural production (in constant 1980 pesetas) increased from 834,759 million to 2,111,014 million pesetas in 1999, the last year for which data is available. This represents an increase in labor productivity of around 9.0% per annum during this period.
In recent years, Spanish agriculture has seen productivity increases thanks to irrigation upgrades, capital investment, and, most importantly, mechanization and the use of modern production methods. The decline in the agricultural workforce shows a steady downward trend resulting from the ongoing technological advancements, which make it advisable to reduce the agricultural population in some regions and introduce agricultural production processes that require a larger workforce.
Maps 11 and 12 detail the distribution of the population employed in agriculture by agricultural districts in 1991, according to information collected by the population census carried out in that year and the situation of the sector in terms of the population employed in agriculture in the year 2000, although in the latter case the available source is the Active Population Survey which only provides information at the provincial level, so the comparability between both maps is relative.
Taken together, the maps highlight the unequal distribution of the population employed in agriculture, which varies considerably between provinces, with its weight being especially significant in those regions or territories with a scarcity of employment alternatives outside the sector.
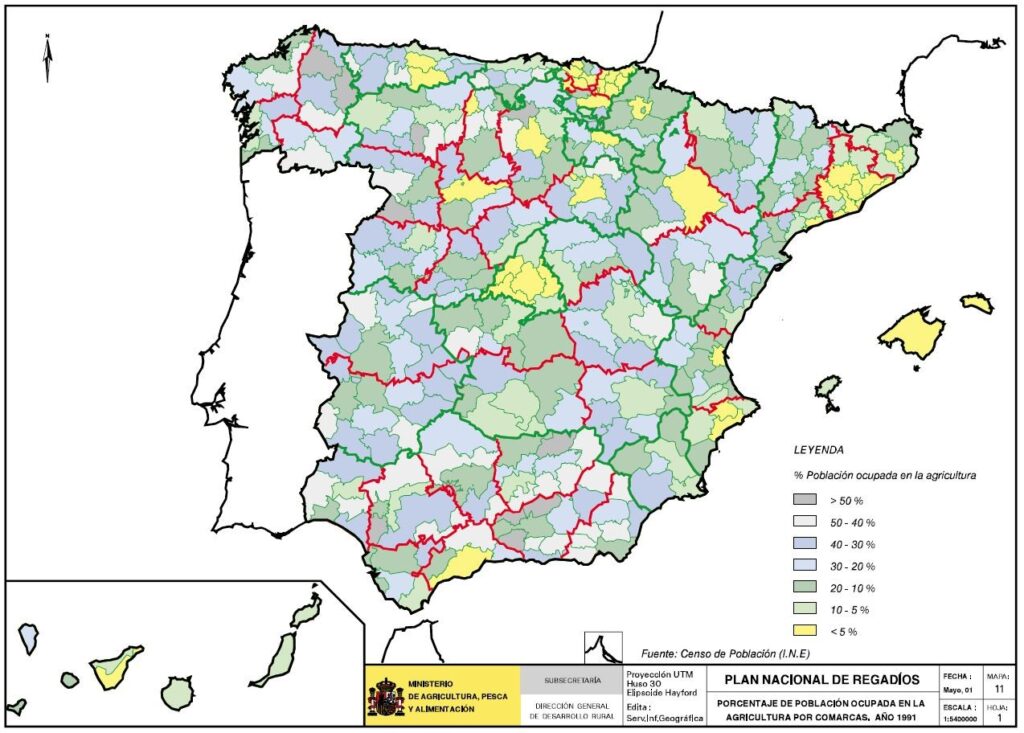
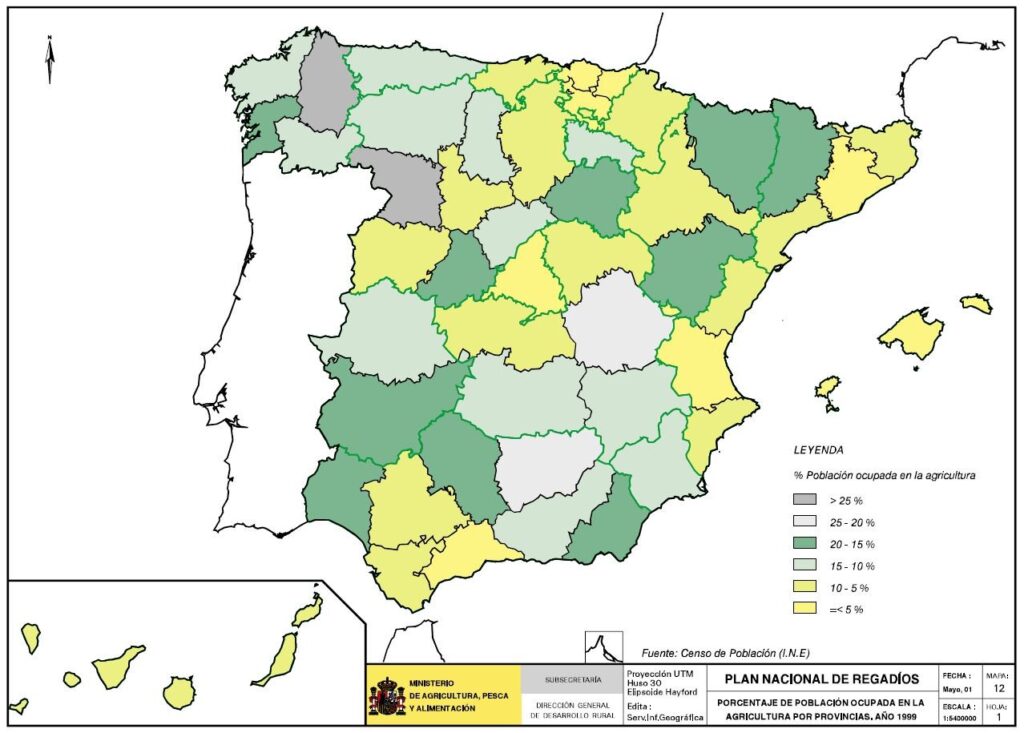
3.3 Basic macroeconomic features of agriculture
3.3.1 Introduction
The macroeconomic indicators of general economic activity are influenced by market developments, general labor market conditions, and the evolution of production, demand, and prices, and this is reflected in the value of Gross Domestic Product for each period, both globally and regionally.
Agricultural macroeconomic factors are influenced by the same socioeconomic factors and, in addition, by other climatic factors (rainfall regime, average temperatures) that directly affect the annual result of agricultural economic activity, producing temporary variations that, in years of climatic irregularities, are not easily reconciled with the multi-year trend.
The following graph shows these differences in annual productivity that can be reflected in the agricultural macroeconomic indicators for the European Union as a whole in 1999, the last year for which complete information is available:
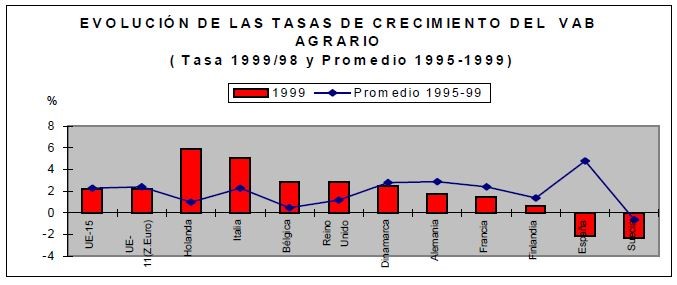
The different evolution of agricultural magnitudes and the parameters of the global economic system are related, among other variables, to the impact that climatic factors exert on agricultural production, and negative year-on-year growth rates can occur in adverse climatic conditions, within a multi-year context of positive evolution.
3.3.2 Agricultural magnitudes
Final agricultural production is the basis for all considerations and projections in the agricultural economy, as it strictly reflects the value of all gross production from all production units within the agricultural sector. Its evolution therefore explains the overall situation of crop production, livestock production, and, in certain circumstances, forestry production, considering the entire primary production sector (excluding fishing).
EVOLUTION OF FINAL AGRICULTURAL PRODUCTION (Billions of pesetas)
| | FINAL PRODUCTION (current prices) | FINAL PRODUCTION (constant 1990 prices) | ||||
|---|---|---|---|---|---|---|
| VEGETABLE | ANIMAL | AGRICULTURAL | VEGETABLE | ANIMAL | AGRICULTURAL | |
| 1990 | 2.090,0 | 1.357,5 | 3.447,5 | 2.090,0 | 1.357,5 | 3.447,5 |
| 1991 | 2.097,3 | 1.374,1 | 3.471,4 | 2.060,1 | 1.406,1 | 3.466,2 |
| 1992 | 1.876,6 | 1.372,8 | 3.249,4 | 2.096,6 | 1.398,6 | 3.495,2 |
| 1993 | 1.923,7 | 1.405,5 | 3.329,2 | 1.976,2 | 1.394,7 | 3.370,9 |
| 1994 | 2.113,6 | 1.583,0 | 3.696,6 | 1.894,0 | 1.462,6 | 3.356,6 |
| 1995 | 2.167,7 | 1.620,8 | 3.788,5 | 1.738,6 | 1.497,5 | 3.236,1 |
| 1996 | 2.628,0 | 1.801,0 | 4.429,0 | 2.149,2 | 1.584,4 | 3.733,6 |
| 1997 | 2.572,8 | 1.850,7 | 4.423,5 | 2.372,8 | 1.616,0 | 3.988,8 |
| 1998 | 2.598,2 | 1.755,5 | 4.353,7 | 2.441,6 | 1.656,4 | 4.098,0 |
| 1999* | 2.545,4 | 1.713,4 | 4.258,8 | 2.430,9 | 1.581,9 | 4.012,8 |
| 2000** | 2.530,1 | 1.869,6 | 4.399,7 | 2.428,9 | 1.794,8 | 4.223,7 |
NOTES: * Progress; ** Estimate
Observing the agricultural and livestock series reveals a regular growth trend which, despite cyclical fluctuations such as the drop in production in 1995 or the considerable increase in 1996, indicates a stable and consolidated agricultural production system.
The relationship between the agricultural and livestock subsectors indicates a growing trend in the importance of livestock farming within the Spanish primary production system. The ratio between the value of livestock and agricultural production points to an increase in the economic weight of livestock, undoubtedly due to better price performance compared to the evolution of the value of agricultural production. This translates into a slight but steady upward trend in beef cattle production, offsetting the reduction in dairy cows. However, in the most recent period, the impact of BSE has considerably altered the sector, and, in general, the negative effects on cattle have been offset by the positive effects on pigs and poultry.
The weight of plant production on the PFA has evolved from representing, in constant pesetas of 1990, 60.6 % of the PFA to 57.5 % in 2000, which nevertheless represents a solid structure whose average is located throughout the decade at 58.5 % with a coefficient of variation of 3 %.
The year-on-year evolution of final agricultural production shows the fluctuations typical of the impact of climatic and market factors, which for recent years are reflected in a nominal variation of 3.3 % between 2000 and the previous year, compared to a variation of -2.2 % in 1999 compared to the previous year.
EVOLUTION OF AGRICULTURAL MACROMAGNUTES (Billions of current pesetas)
| YEAR | PFA | IC | VABA (pm) | VABA (cf) | VANA cf (RA) |
|---|---|---|---|---|---|
| 1990 | 3.492,4 | 1.462,3 | 2.030,1 | 2.145,2 | 1.858,7 |
| 1991 | 3.496,9 | 1.497,6 | 1.999,3 | 2.169,8 | 1.876,1 |
| 1992 | 3.248,7 | 1.513,3 | 1.735,4 | 1.954,4 | 1.666,9 |
| 1993 | 3.327,2 | 1.533,4 | 1.793,8 | 2.245,6 | 1.952,7 |
| 1994 | 3.727,6 | 1.634,4 | 2.093,2 | 2.665,5 | 2.354,6 |
| 1995 | 3.837,2 | 1.710,8 | 2.126,4 | 2.816,3 | 2.480,4 |
| 1996 | 4.466,4 | 1.829,0 | 2.637,4 | 3.285,0 | 2.932,4 |
| 1997 | 4.454,5 | 1.892,7 | 2.561,8 | 3.236,0 | 2.851,1 |
| 1998 | 4.384,7 | 1.932,4 | 2.452,3 | 3.167,6 | 2.745,1 |
| 1999 | 4.289,8 | 1.935,1 | 2.354,7 | 3.073,5 | 2.699,3 |
| 2000 | 4.430,7 | 1.991,6 | 2.439,1 | 2.699,3 | 2.813,8 |
In this table, the recorded values for Final Agricultural Production do not match those in the previous table because the item corresponding to Capital Goods Produced on Own Accounts on farms has been omitted. Although this amount is not significant, it represents growth of around 1.1% of Final Agricultural Production, which has not been reflected in the table that breaks down the contributions to Final Production of the agricultural and livestock subsectors. A particular case is that of 1992 and 1993, when disinvestments in plantations during those seasons resulted in negative values, meaning that the Final Agricultural Production figures for those years are slightly lower than the figures for plant and animal production.
Intermediate consumption (IC) reflects the expenses necessary for production, and its increase impacts the economic result, along with the climatic factors mentioned earlier. The following graph shows the evolution, in current pesetas, of Final Agricultural Production and Off-Farm Expenses or Intermediate Consumption.
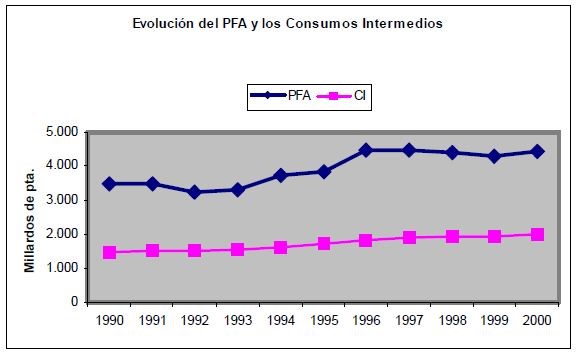
The evolution of intermediate consumption shows a slight upward trend, which may influence the evolution of agricultural production output. This suggests that in recent years there appears to be a trend toward improved efficiency, considering that, in constant pesetas, the weight of out-of-sector expenses reached 42.4% of GDP, averaging 43.3% of GDP over the decade. In constant 1990 pesetas, the two largest items of these expenses (livestock feed and machinery) remained relatively stable throughout the decade, with coefficients of variation of 0.52 and 0.40, respectively.
Gross Value Added at market prices is the parameter that integrates agricultural output into the National Accounts. It truly reflects the economic outcome of agricultural management in its two most significant aspects: At current market prices, it strictly reflects the amount of final production available for distribution after deducting intermediate consumption. In reality, and since 1993, this formulation has been adjusted due to the inclusion of operating subsidies derived from the Common Agricultural Policy as a source of agricultural income. This significantly modifies the gross value added at factor cost, which is obtained by adding or subtracting the result of incorporating the value of operating subsidies less production-related taxes.
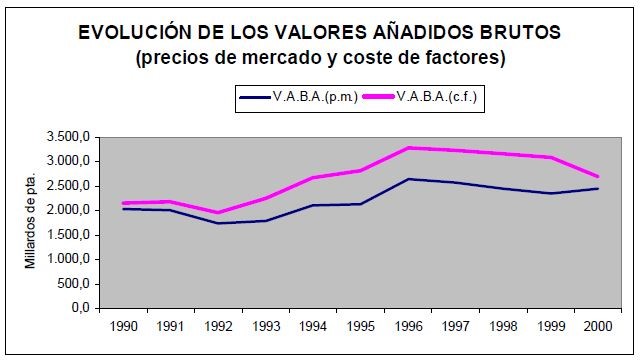
The graph shows the importance that net tax subsidies have represented in recent years, reaching on average more than 25% of agricultural income, being for some Autonomous Communities a piece that exceeds 40% of Value Added.
Agricultural Income, or Net Value Added at factor cost, is the last series in the table above. It is the result of deducting the consumption of fixed capital (primarily buildings and machinery) from the Value Added at factor cost. The evolution of this capital shows considerable variations depending on both production levels and weather conditions, as well as the evolution of input prices and the depreciation rate. Compared to the previous year, there was an increase in NPV of 4.21 TP3T, whereas in the 1999 season, income reached negative values (-1.2 TP3T) compared to the previous year.
Regarding the population employed in agriculture, the evolution of agricultural income and its comparison with the evolution of the CPI in the same years presents the following distribution.
EVOLUCYoÓN OF AGRARIAN INCOME
| Year | Income / Employed (current points) | Index 1980=100 | CPI 1980=100 | Income / Employed (constant 1980 points) |
|---|---|---|---|---|
| 1980 | 405,3 | 100,0 | 100,0 | 405,3 |
| 1990 | 1.363,5 | 336,4 | 243,7 | 559,5 |
| 1995 | 2.452,4 | 605,1 | 313,7 | 781,8 |
| 2000 | 3.160,9 | 779,9 | 356,9 | 885,7 |
It can be seen how, apart from the temporal fluctuations in the evolution of the campaigns, there has been an increase in income per worker in agriculture, which is not unrelated to the constant reduction of the population employed in agriculture (from 1.3 million in 1990 to 0.9 million in 2000) but which has repercussions, in real terms, in a clear increase with respect to the growth in value of agricultural income at current prices, although the speed of growth of the CPI is greater than the evolution of income per worker in real terms.
Another important feature of the sector relates to its relative weight within the national economy, expressed by its contribution to Gross Value Added and employment.
The agri-food activity – an expression that integrates agriculture, livestock, forestry, fishing and processing industries of agricultural and fishery products – currently contributes 6.8% of the wealth generated annually in Spain, provides employment to about one and a half million people (10.6% of the total employed and 7.3% if the agri-food industry is excluded) and produces 14% of the total exchanges of goods with other countries.
Historical analysis of global indicators of the agricultural sector's share of GVA and total employment reflects a declining trend. This loss of relative importance of the agri-food and fisheries sector in the national economy is a consequence of economic growth and changes in the composition of global demand. It is a common trend in developed countries and is usually accompanied by a shift towards a service-based economy (i.e., a sustained increase in the relative weight of the service sector).
EVOLUTION OF GROSS AGRICULTURAL VALUE ADDED (at market prices) AND THE POPULATION EMPLOYED IN THE SECTOR WITH RESPECT TO ITS TOTALS (%)
| YEAR | VABA(pm) | Total GVA (1) | Employment Agrarian/Total (2) |
|---|---|---|---|
| 1990 | 9,5 | 11,8 | |
| 1991 | 8,2 | 10,6 | |
| 1992 | 7,6 | 10,1 | |
| 1993 | 7,9 | 10,1 | |
| 1994 | 8,0 | 9,8 | |
| 1995 | 7,1 | 7,22 | 9,1 |
| 1996 | – | 7,22 | 8,6 |
| 1997 | – | 7,07 | 8,3 |
| 1998 | – | 6,77 | 8,0 |
| 1999 | – | 3,82** | 7,3 |
| 2000 nd | – | 6,8 |
Grades:
(*) The New System of Accounts is used to calculate GVA from 1995 onwards.
EU National and Regional (SEC-95). This methodological change implies an increase in the relative weight of the agricultural and fisheries branches and an almost parallel reduction of the agro-industrial branch.
(**) The 1999 data refers to the GVA at basic prices of the agricultural and fishing sector without counting the contribution of the agri-food industry.
(1) Participation of the agricultural, fishing and agri-food industry sector in the
Total GVA at market prices, except for the year 1999 which counts GVA at basic prices (SEC-95) without including the agri-food industry.
(2) Share of agricultural, livestock, forestry and fishing employment in the total
employed population.
3.4 Farm structures
The diversity of Spanish agriculture is not solely due to the physical factors that condition it; the structure of farms is also very different in different regions, and even in the same region, situations of smallholdings coexist with large farms that concentrate considerable areas of cultivation.
Within this great internal diversity, which will be analyzed later, some structural features characterize Spanish agriculture in comparison with European agriculture.
- The average land area is slightly larger in Spain than in EUR 15, but the difference in land productivity means that the gross margin per hectare for Spanish farmers is half that of the European average, and the lowest of all EU countries.
- The economic dimension of Spanish farms, measured in UDE, reaches 63% of the Community average and in percentage terms there are more economically small farms and fewer large farms in Spain than in the European average.
- Labor productivity in Spanish agriculture falls short of three-quarters of the European average and is roughly half that of France, Germany, the UK, or Sweden, and a third that of Belgium, Denmark, or the Netherlands. Only Greece, Italy, and Portugal have lower labor productivity.
DIMENSIONS OF AGRICULTURAL FARMS IN THE EU
| COUNTRIES | Ha SAU/Explot. | MB/exploit. (UDE) | MB/Ha (UDE) | MB/UTA (UDE) |
|---|---|---|---|---|
| Belgium | 20.6 | 47.0 | 2.3 | 42.6 |
| Denmark | 42.6 | 57.2 | 1.3 | 45.5 |
| Germany | 32.1 | 32.3 | 1.0 | 27.2 |
| Greece | 4.3 | 5.8 | 1.4 | 8.2 |
| Spain | 21.2 | 10.6 | 0.5 | 12.3 |
| France | 41.7 | 35.3 | 0.8 | 24.5 |
| Ireland | 29.4 | 18.7 | 0.6 | 13.8 |
| Italy | 6.4 | 8.0 | 1.3 | 11.3 |
| Luxembourg | 42.5 | 35.2 | 0.8 | 23.3 |
| Holland | 18.6 | 84.1 | 4.5 | 39.3 |
| Austria | 16.3 | 11.6 | 0.7 | 18.5 |
| Portugal | 9.2 | 6.5 | 0.7 | 4.9 |
| Finland | 23.7 | 23.5 | 1.0 | 17.6 |
| Sweden | 34.7 | 22.8 | 0.7 | 25.4 |
| United Kingdom | 69.3 | 47.7 | 0.7 | 29.1 |
| EU 15 | 18.4 | 16.7 | 0.9 | 17.3 |
| Spain/EU 15 | 115% | 63.5% | 55.6% | 71.1% |
European). Survey on the structure of agricultural holdings. 1997. ASU: Agricultural Area Utilized.
UDE: European Dimension Unit equivalent to 1,200 euros of standard gross margin.
UTA: Unit of work year. One UTA is equivalent to the work performed by a full-time person over the course of a year. 228 days or more. 1,826 hours or more.
The structure of Spanish agricultural holdings is characterized by the predominance of small-scale farms. Around 950,000 farms are smaller than 12 UDE (Unit of Economic Development) and their gross margin does not reach 2.4 million pesetas annually. At the other extreme, there are 58,000 farms whose annual gross margin exceeds 8 million pesetas, and in an intermediate position, there are nearly 200,000 farms with an annual gross margin between 2.4 and 8 million pesetas.
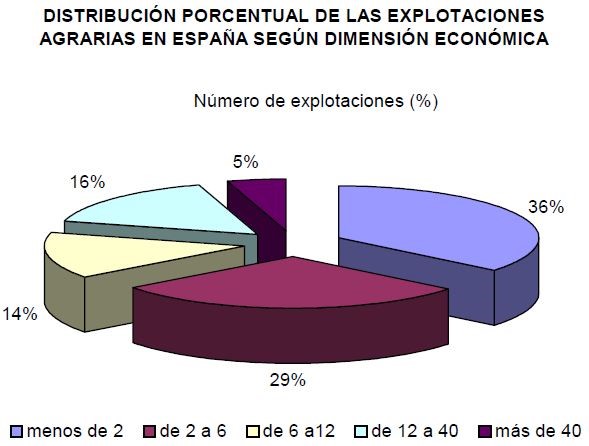
These data suggest that more than half of the farms either serve as a supplementary source of income for their owners, in addition to income from other activities, or are of questionable viability unless they can increase their economic size by intensifying production. Irrigation plays a significant role in this intensification.
These structural features are common in most Spanish regions, although there are large territorial differences as can be seen in the following graph.
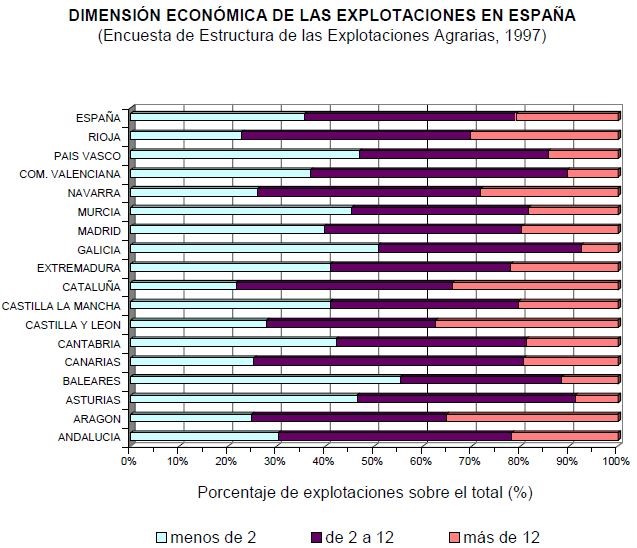
DISTRIBUTION OF SPANISH AGRICULTURAL HOLDINGS
| AUTONOMOUS COMMUNITIES | Number of farms (Thousands) | SAU/exploit. (ha) | Work used (thousands UTA) | Gross Margin/Exploitation (UDE) |
|---|---|---|---|---|
| Galicia | 114.8 | 5.4 | 165.7 | 4.2 |
| Asturias | 39.9 | 10.1 | 53.6 | 4.5 |
| Cantabria | 16.4 | 14.0 | 22.5 | 6.6 |
| the Basque Country | 22.7 | 15.5 | 24.1 | 6.6 |
| Navarre | 23.1 | 25.1 | 17.9 | 14.5 |
| The Rioja | 12.9 | 17.1 | 13.3 | 13.5 |
| Aragon | 60.4 | 42.0 | 47.9 | 14.7 |
| Catalonia | 68.9 | 16.6 | 79.4 | 15.2 |
| Balearic Islands | 17.4 | 13.5 | 14.5 | 5.3 |
| Castile and León | 117.5 | 45.4 | 101.1 | 15.3 |
| Madrid | 10.6 | 30.1 | 8.5 | 10.0 |
| Castilla la Mancha | 133.3 | 35.4 | 77.4 | 10.4 |
| Valencia | 165.3 | 4.2 | 74.6 | 6.3 |
| Murcia | 47.4 | 10.8 | 42.6 | 13.2 |
| Estremadura | 68.4 | 42.2 | 58.0 | 11.3 |
| Andalusia | 274.1 | 18.0 | 267.1 | 12.6 |
| Canary Islands | 15.1 | 3.3 | 30.8 | 12.2 |
| Spain | 1208.3 | 21.2 | 1099.0 | 10.6 |
The percentage of farms with more than 12 UDEs out of the total number of farms in each region is similar to the national average in Cantabria, Madrid, Castilla-la Mancha, Murcia, Extremadura, Andalusia and the Canary Islands, clearly lower in Galicia, Asturias, the Basque Country, the Balearic Islands, Valencia and higher in Navarre, La Rioja, Aragon, Catalonia and Castilla-León.
Conversely, the higher percentage of farms with less than 2 UDE, and economically marginal or residual, on the total number of farms exceeds the national average in all regions of the Cantabrian Coast and Balearic Islands.
Within this regional diversity there are many factors to explain the lack of a clear relationship between physical size and economic dimension of farms, perhaps one of those factors is undoubtedly the greater or lesser weight of irrigation in each region.
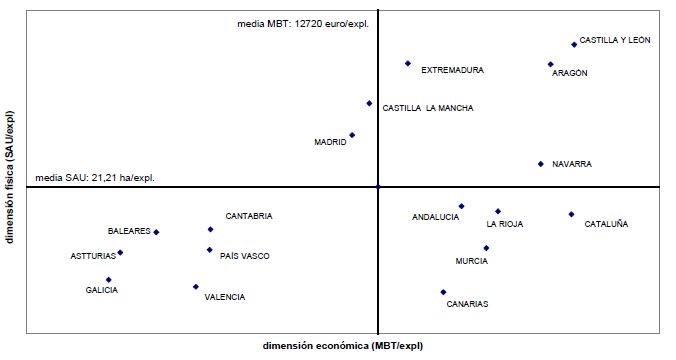
The chart shows that six Autonomous Communities have a physical size larger than the national average, with almost all of them having an economic size, measured by gross operating margin, at or above the average, with Aragon and Castile and León standing out in this regard. On the other hand, the remaining Autonomous Communities, 651% of the total, have a physical size below the national average. Two groups stand out according to their economic size. The first group, made up of the Balearic Islands, Cantabria, the Basque Country, Asturias, Galicia, and Valencia, has an economic size below the national average, while the second group, made up of Andalusia, La Rioja, Catalonia, Murcia, and the Canary Islands, has an economic size above the national average.
3.5 Productive sectors: current situation and perspective
INTRODUCTION
This section aims to estimate the productive opportunities or options available to Spanish agriculture, particularly irrigated agriculture, from the perspective of the market, which is an important factor, although not the only decisive one, to assess the possible degree of expansion of production and irrigation.
To this end, the following production sectors, which basically correspond to the Common Market Organizations (CMOs), are analyzed: arable crops, rice, forage, cotton, sugar, olive oil, wine, tobacco, and fruits and vegetables. Only the CMOs of the different plant sectors have been included because, since the study is being conducted from the perspective of irrigation and its influence, it was deemed appropriate to focus on crops and not include the animal production sectors as such.
The analysis of each of these sectors follows a common structure according to the following contents:
– Description of the corresponding CMOs in their essential features, such as the price and intervention regime, aid, limitations or restrictions, procedures, etc., many of which must be taken into account when applying irrigation policy.
– Situation and relative importance of each sector in Spain (cultivated area, yields, productivity, competitiveness, etc.).
– Situation and production of markets as studied by International Organizations such as the OECD, FAO, World Bank, European Commission, etc.
– Prospects that open up for irrigation in each sector considered.
3.5.1 Herbaceous crops
BASIC CHARACTERISTICS OF THE CMO.
The arable crops sector currently includes cereals, oilseeds, protein crops, and non-textile flax (COPL). Following Agenda 2000, the Common Market Organisation (CMO) for the arable crops sector is regulated by Regulation (EC) 1251/99, which establishes a support scheme for producers of certain arable crops. However, it was the 1992 CAP reform that laid the foundations for the current system.
In the 1992 Reform, compensatory payments were introduced to compensate farmers for income losses resulting from the reduction in institutional prices.
The area eligible for these direct payments (per hectare) was limited by a regional base area. The base area was to be calculated as the average of the cultivated areas of cereals, oilseeds, and protein crops in 1989, 1990, and 1991, increased, where applicable, by the areas left fallow in accordance with a publicly funded program.
In Spain, a national base area was established for dryland farming and another for irrigated farming. Initially, there was only one national base area for dryland farming, which, in the event of exceeding the established areas, allowed for greater compensation among all regions of the country. Later, the area was divided into 17 sub-areas, in accordance with the autonomous community structure of the State, with the possibility of regional allocations for exceeding the established areas. Furthermore, the alternative of separating a base area for irrigated maize was used, given the high productivity per hectare of irrigated maize in many areas of the country.
Initially, the total area of irrigated land was slightly lower, but due to repeated exceedances of the irrigated area limit, primarily for maize (likely affected by crop displacements caused by drought and water limitations), the areas were adjusted. Thus, by increasing the irrigated maize area, yields were reduced to achieve the required financial neutrality, and the hectares of the different base areas were established. In this way, 7,848,600 hectares of dryland base area and 1,371,100 hectares of irrigated base area were established, of which 403,400 hectares correspond to irrigated maize.
Furthermore, Member States were required to regionalize cereal yields into homogeneous zones in order to apply compensatory payments, in terms of budgetary neutrality, based on national average yields and areas for the period 1986/87 to 1990/91, excluding years of maximum and minimum yields. The regionalization plan, which established a national average yield of 2.64 t/ha, used agricultural districts as territorial units for the purpose of establishing average yields, both for statistical purposes and to better reflect the climatic and geographical diversity of Spanish agriculture.
The 1992 reform also established a mandatory set-aside requirement for producers claiming compensatory payments, except for small producers (with less than 92 tons per holding). Set-aside areas also received compensatory payments, under certain conditions. Set-aside is relevant in Spain for territorial (fallow land affects 4 million hectares annually), agronomic, and environmental reasons (fallow land is a good practice for soil fertility and the conservation of certain ecosystems).
Until the 1995/96 season, there were two types of removal: fixed and flexible. The fixed removal system required a commitment to rotating removal and the use of the removed area for biomass production, the application of agri-environmental measures, or afforestation, while flexible removal did not require a rotation commitment (although it could not exceed the area subject to rotating removal by a certain percentage). The Commission could adjust the mandatory removal percentage annually based on market forecasts. However, from the 1996/97 season onwards, a unit removal rate of 17.51 TP3T was established.
Apart from the mandatory set-aside and except for certain cases, Spain was authorized a voluntary withdrawal provided that the total of the mandatory plus voluntary withdrawal did not exceed 30% of the dryland area for which compensatory payment was requested (in irrigated land, only mandatory withdrawal could be carried out, except in exceptional cases).
The CMO for the arable crops sector is currently, as already mentioned, and following the reform of Agenda 2000, regulated by Regulation (EC) 1251/99. The reform introduced into the CMO by Agenda 2000 maintains the basic criteria of the 1992 reform but introduces the following changes:
- A reduction in the intervention price of 15% in two equal phases, starting with the 2000/01 season. The intervention price was lowered to €101.31/t, compared to the previous €119.19/t. The objective of the intervention price is no longer to guarantee price stability at a high level, but rather to serve as a safety net for agricultural incomes. From the 2002/2003 season onwards, the price may be reviewed in light of market conditions.
- Direct payments for cereals fixed per hectare (until Agenda 2000 they were 54 euros/t multiplied by the historical reference yield) are increased in two annual phases and for the 2001/2002 marketing year will amount to 63 euros/t. The increase represents compensation for 50% of the total reduction.
- The system applied to durum wheat, modified in 1997, remains in place. Thus, a supplementary area payment of €344.5 per hectare is granted for durum wheat sown in traditional production areas, within a maximum guaranteed area eligible for this supplement. For Spain, this area is 594,000 hectares, and the established traditional production areas are: Almería, Badajoz, Burgos, Cádiz, Córdoba, Granada, Huelva, Jaén, Málaga, Navarra, Salamanca, Sevilla, Toledo, Zamora, and Zaragoza.
- The average cereal yield in Spain has increased from 2.64 to 2.9 t/ha. Based on this new parameter and in accordance with EU regulations, the Regional Production Plan has been revised. Specifically, the yield differential for maize, which originated in the first area model mentioned earlier, has been restored. Royal Decree 1893/1999 establishes the current Regionalization Plan, derived from the Agenda 2000 Agreement.
- The principles of the base area system and regionalization plans are maintained, particularly for irrigated crops and maize. Thus, the possibility of designing sub-base areas within a general base area is retained, as is the ability to differentiate maize yields from those of other cereals.
In the Spanish case, the national dryland base area remains at 7,848,600 ha, as established after the 1992 reform, and the national irrigated base area is 1,371,089 ha, of which 403,360 ha correspond to corn.
- In the case of oilseeds and flaxseed, direct payments per hectare will be reduced in three annual phases, so that they are equal to payments for cereals (i.e., €63/t in 2002/2003). The reference price system for oilseeds will be abolished from the 2002/2003 marketing year onwards.
Programs that include sunflower and spring rapeseed are eligible for agri-environmental schemes. In Spain, Royal Decree 4/2001, of January 12, which establishes a system of aid for the use of environmentally compatible agricultural production methods, includes sunflower cultivation among its aid programs.
- To ensure the profitability of protein crops compared to other crops, these receive a premium of 9.5 euros/t in addition to the basic direct payment, which puts the aid in a single phase at a total of 72.5 euros/t from 2000/2001.
- Compensation for soil removal (mandatory or voluntary) is set at the same rate as for herbaceous crops, i.e., 63 euros/ta from 2001/2002. Mandatory soil removal is maintained until 2006/2007 at the basic percentage of 10% (reduced from 17.5%) from 2000/2001, but the effective percentage may be adjusted according to market conditions.
Voluntary withdrawal will be maintained, but the system will be improved, particularly to incorporate environmental aspects.
- For small producers with yields under 92 tons, the exemption from mandatory withdrawal remains in place. From 2000 onwards, small producers can opt for specific payments for oilseeds, protein crops, flaxseed, and maize, instead of payments based on average cereal yield. These producers can also participate in the voluntary withdrawal scheme.
PRODUCTIVE SECTOR IN SPAIN
The arable crop sector in the European Union occupies a prominent position within the agricultural sector, both in terms of human consumption and the demand from the animal feed industry. Its cultivation represents 401 TP3T of the Utilized Agricultural Area (UAA) and 41.31 TP3T of EAGGF-Guarantee expenditure.
Community cereal production for the 1998/1999 season reached 211 million tons, corresponding to an area of 37.4 million hectares and an average yield of 5.67 t/ha. Meanwhile, total oilseed production in 1998/99 amounted to 15.1 million tons, cultivated on 5,960,000 hectares. As for protein crops, total production reached 5.9 million tons, with an approximate area of 1.5 million hectares for the 1998/99 season.
Within Spain, for all herbaceous crops, the base area involved is 9.2 million hectares, of which 1.3 million hectares are irrigated. If we add the two to three million hectares of fallow land associated with these crops, we reach approximately 12 million hectares, representing 241% of the total geographical area and 481% of the Utilized Agricultural Area (UAA), accounting for 27.81% of the total Spanish EAGGF-Guarantee expenditures.
| CROPS | SURFACES (Ha) | YIELD (Kg/ha) | PRODUCTION (t) | |||
|---|---|---|---|---|---|---|
| Dry land | Irrigation | Total | Dry land | Irrigation | ||
| CEREALS | ||||||
| Barley | 3.306.236 | 265.914 | 3.572.150 | 2.887 | 4.337 | 10.697.000 |
| Wheat | 1.806.416 | 206.015 | 2.012.431 | 2.844 | 4.382 | 6.040.454 |
| Corn | 75.322 | 364.389 | 439.711 | 3.081 | 9.657 | 3.751.072 |
| Rest | 611.466 | 259.965 | 637.431 | 1.155.726 | ||
| TOTAL * | 5.799.440 | 862.283 | 6.661.723 | 21.644.252 | ||
| OLEAGINOUS | ||||||
| Sunflower | 847.282 | 250.932 | 1.098.214 | 834 | 1.877 | 1.177.757 |
| Soy | 64 | 5.073 | 5.137 | 917 | 1.987 | 10.141 |
| Rape | 16.304 | 81.262 | 97.566 | 1.138 | 1.100 | 107.962 |
| PROTEAGINOUS | ||||||
| Pea | 53.539 | 28.591 | 82.130 | 791 | 1.460 | 84.110 |
| Broad beans | 7.835 | 2.620 | 10.455 | 779 | 1.949 | 11.206 |
| Lupine | 24.774 | 284 | 25.058 | 689 | 1.266 | 17.435 |
Source: Yearbook of Agricultural Statistics 1999. MAPA (Data 1996).
In terms of land use, and especially agricultural land, it is clear that herbaceous crops are the primary alternative for Spanish agriculture. From a territorial perspective, the Autonomous Communities most affected by herbaceous crops are Andalusia, Aragon, Castile-La Mancha, Castile and León, Catalonia, Extremadura, Madrid, and Navarre: that is, all of Spain except the Cantabrian Coast and La Rioja, the Levante region (Valencia and Murcia), and the two archipelagos. In the aforementioned Autonomous Communities, the predominant Technical and Economic Orientation (OTE) is that of herbaceous crops, as it is throughout Spain, where it is only surpassed by fruit trees and citrus fruits, due to their significant fragmentation in some Autonomous Communities, particularly in the Valencian Community.
Regarding yields, the figures are highly variable. National average yields are around 2.9 t/ha, with 2.5 t/ha for dryland farming and 5.4 t/ha for irrigated farming (of which maize yields 7.7 t/ha, and other cereals besides maize 4.9 t/ha). The enormous difference between dryland and irrigated farming is clearly evident. In dryland farming, average yields are highly variable, depending on the natural climatic and soil conditions of the different agricultural regions, and are greatly affected by the annual variability of rainfall.
Average yields are significantly lower than in other EU countries. For the European Union as a whole and for all cereals, the average yield is 5.6 t/ha, with France and the Netherlands having the highest figures, and virtually all Member States yielding more than Spain. A similar situation exists for oilseeds. The only area in which Spain stands out is in the yield of irrigated maize, where it leads the EU, but at a significant additional cost due to water usage and the necessary cultivation techniques.
MARKETS
Of the value of world merchandise trade, 5.5 trillion dollars, about 18% correspond to agricultural products and 10% of the value of trade in agricultural products corresponds to cereals traded worldwide.
The global grain harvest reached 1.482 billion tons in the 1998/99 season. China is the world's leading producer with 400 million tons. Following China are the United States, India, the former Soviet Union, and the European Union. Despite these production figures, China and the former USSR are significant net importers of grain.
Cereal exports are distributed among five countries: the United States, the European Union, Canada, Argentina, and Australia. The United States, for example, exports approximately 43 million tons of corn, representing 601% of all global exports. In the barley market, Canada, the United States, and Germany are notable exporters.
Among cereals, wheat deserves special mention. It is not only the most widely cultivated cereal on the planet, with a production of approximately 600 million tons, but also the most traded. China is the world's leading producer with just over 100 million tons, followed by the former Soviet Union. These countries are also major importers. The European Union and the United States follow them in terms of production.
Faced with a very dispersed demand for wheat, only five countries account for 90% of world exports (United States, European Union, Canada, Australia and Argentina).
On the other hand, within the Spanish context, Spain is a cereal importer, primarily of wheat, corn, and sorghum. Regarding wheat imports, 95.1% of trade is within the European Union. Half of corn purchases are made from outside the European Union, mainly from the United States. Barley is the most exported of our cereals. Slightly more than 10.1% is sold to countries outside the EU.
With regard to corn, it is worth mentioning the agreement reached between the United States and the Community, whereby approximately 2 million tons of this product can enter Spain under preferential conditions, based on the traditional trade existing before Spain's entry into the EEC, and whose agreement is consolidated in the Uruguay Round Agreement of the GATT.
Regarding oilseeds, global production is characterized by the leading role of soybeans, which account for 501,300 tons of total seed production. Another important characteristic is the high rate of self-sufficiency in producing countries, which reduces international trade. Of these trades, soybeans again rank first, representing almost 751,300 tons of total seed trade. The EU is the main importer of seeds, and the United States is the main exporter. Total EU oilseed imports amounted to 17.2 million tons in 1998. Soybeans constitute the largest share of these imports (801,300 tons).
PROSPECTS FOR IRRIGATION
From the perspective of the limitations of the CAP in this sector, with respect to irrigation, two groups of factors must be considered:
- Base areas and key economic aid.
- Prices and markets
As already mentioned, the current base area of herbaceous crops in Spain consists of 7,848,600 ha of dryland and 1,371,100 ha of irrigated land, of which 403,400 ha correspond to irrigated maize.
The reality of economic and climatic circumstances each year means that the area sown with different types of crops varies, so decisions cannot be made based on the specific situation of a particular year. Should a repeated exceedance of irrigated land limits be observed as a consequence of the Plan's implementation, both for maize and other crops, a decision could be made either to maintain this situation while accepting the corresponding penalty, or to transfer areas from dryland to irrigated land. This is a matter of national policy for which the current WTO offers sufficient flexibility. Balances can and should be sought regarding the transfer of dryland to irrigated land, at the national or regional level, or modifications to dryland and irrigated yield levels. In any case, it should be noted that the incorporation of approximately 20,000 hectares per year into the irrigation system will not significantly affect the existing base area of over 1,370,000 hectares. Furthermore, the irrigated land used for maize production, which represents Spanish imports, could also be included here.
Regarding the regionalization of production, which is partly a determining factor in the greater or lesser appeal of irrigated herbaceous crop cultivation, this is a national issue. Spain has an economic benchmark, calculated by multiplying the total base area by the national average cereal yield, currently set at 2.9 t/ha. From this starting point, the Regionalization Plan model allows for a degree of flexibility, based on financial neutrality, and always bearing in mind that these yields are not related to actual yields at any given time, as they are technical benchmarks for granting subsidies that, in the future, as previously mentioned, will be disconnected not only from actual production but also from potential production.
Finally, there is the issue of the market, where Spain has a deficit in all arable crops, but where it must be considered that we are part of a Single Market of over 200 million tons of cereals. Within this context, we must take into account the negotiations within the framework of the WTO and the commitments already made under the Uruguay Round Agreement of the GATT, which, specifically in the arable crop sector, mainly cereals, primarily affect the reduction of subsidized exports (by 361 TP3T in monetary terms and by 211 TP3T in physical quantities). Depending on market conditions, this could mean either a certain amount of cereals being incorporated into the domestic supply or the export of unsubsidized cereals, likely at prices lower than current levels.
In terms of the scale of Spanish production figures, increases in output resulting from new land conversions to irrigated land or from greater productivity in improved irrigation systems should not pose a serious problem. The problem lies in the relative competitiveness of our production compared to that of other European countries, in terms of costs, quality, and marketing—aspects where Spain has relative advantages and disadvantages regardless of its irrigation policy.
In any case, agronomic performance is not in itself an absolutely decisive factor in terms of the crop's survival under adverse price conditions, or with respect to its comparative effectiveness in other countries, regions, or farming systems. Equally or even more important are technical aspects and production systems, and above all, the structural dimension that allows for the reduction of unit costs, as well as the concentration and standardization of production.
3.5.2 Beetroot and sugar
BASIC CHARACTERISTICS OF THE CMO.
Since its introduction in 1968, the basic principles of the CMO for sugar have remained virtually unchanged. The 1992 CAP reforms and Agenda 2000 did not directly affect it. The basic rules of the CMO are set out in Council Regulation (EEC) No 1751/81 and, following its recent consolidation, in Council Regulation (EC) No 2038/1999.
The CMO, in its current form, remains in force until June 30, 2001. The Council was to decide on the rules that would apply thereafter by December 31, 2000. The adaptation and/or reform of the regulations in this sector is currently under discussion and drafting.
The main characteristics of the OCM are:
- A rigid quota system is applied to finished products (white sugar), in parallel with the system for basic agricultural products (sugar beets and sugarcane). The main quotas are called A quotas; there are also B quotas for which lower prices apply. The Council, on the Commission's proposal, sets the quotas for a specific period of 5 to 7 years (the most recent was in 1994, for the period 1995-2001). The quotas are based on historical data and currently, as a result of the GATT, are adjusted according to forecasts of production, imports, consumption, stockpiles, exportable surplus, etc. The A+B quotas constitute a guaranteed quantity; sugar and isoglucose (and inulin syrup) produced above that quantity is designated as C quota (which must be exported without reimbursement).
Once the A and B quotas for sugar and isoglucose have been allocated to each Member State, they distribute these quotas among the producing companies within their territory, under the conditions established by the regulations. The sugar quotas currently in force for Spain are 960,000 tons of quota A and 40,000 tons of quota B (both expressed in white sugar equivalents). The isoglucose quotas are 75,000 tons and 8,000 tons, respectively.
The purpose of the quotas is to limit community sugar production, since domestic prices are much higher than world prices.
- A system of prices, established each year by the Council, on the proposal of the Commission:
- indicative price of white sugar of standard quality (reference price, as an index to calculate the rest);
- intervention price of white sugar [standard quality], distinguishing one price for non-deficit areas and another derived price for deficit areas;
- base price for beet, for a given delivery phase and standard quality;
- a minimum price for beetroot A (equivalent to 98% of the base price) and a minimum price for beetroot B (equivalent to 68% of the base price), both for a given quality type and delivery phase.
Sugar manufacturers must pay farmers at least a minimum price, adjusted by applying bonuses or deductions corresponding to the differences in quality compared to the standard quality, when purchasing sugar beets suitable for processing into sugar. This minimum price also varies according to the region (whether it is a production-deficit area or not) and whether the beets are grade A or B. To this end, contracts are established between buyers and sellers of sugar beets, specifying the conditions for purchase, delivery, receipt, and payment.
The marketing campaign runs from July 1st to June 30th of the following year.
- An export refund program allows for the export of quota sugar and refined preferential cane sugar that has not been sold on the EU market. The Commission manages this program by deciding the refund amounts each week based on offers submitted by sugar traders.
- A program of importing cane sugar at preferential rates.
- A production quotation mechanism, intended to recover from the sugar industry the cost of export refunds (less the amount equivalent to preferential sugar imports) and also storage quotations to recover payments made to companies that store sugar.
In recent years, there has been increasing pressure to reform the regulation of this sector. This is justified by several factors. On the one hand, there is the upcoming enlargement of the EU, and on the other, there are the forecasts of increased restrictions on subsidized exports as a result of the WTO negotiations. Domestically, the current Common Market Organization (CMO) is considered to have several negative consequences, primarily high domestic prices compared to the world market, high stock levels, a highly regulated environment that does not encourage competition, and costly management and control systems.
Furthermore, in February 2001, a European Commission proposal was approved granting duty-free access to all products except weapons from the world's 48 poorest countries (the "least developed countries" or LDCs). This proposal is known as "Everything But Arms." For sugar, as well as rice and bananas, this liberalization will be phased in. Tariffs on sugar (and rice) from these countries will be reduced starting in 2006 until their complete elimination in 2009; during this transition period, they will be offered duty-free import quotas for sugar (and rice).
The reform of the sugar sector proposed by the Commission is currently being debated, in the following terms:
- An extension of the current WTO for two to four seasons. After that, the WTO would be reviewed again, taking into account, above all, the evolution of multilateral trade negotiations and the "everything but arms" agreement. Some voices suggest extending the extension until 2006.
- Reduction of production quotas by 115,000 tons (for Spain this would mean a reduction of about 3,000 tons).
- And the elimination of the quotation and reimbursement systems for storage expenses and the current requirement of a minimum stock.
PRODUCTIVE SECTOR
In Spain, over 150,000 hectares are cultivated with sugar beets, of which almost 801,000 are irrigated. The crop is concentrated mainly in Castile and León, Castile-La Mancha, and Andalusia. The average production for the three-year period 1997-1999 was 8.5 million tons of sugar beets. Sugar beet production was around 1.2 million tons, and molasses production was 0.36 million tons.
The area of sugar cane is much smaller, about 1,200 hectares mainly in Granada and Malaga, which produce about 7,800 tons of sugar.
In Spain, the average yield of irrigated sugar beet is around 58,000 kg/ha, almost double that of dryland farming (31,000 kg/ha). Sugar beet yields vary considerably between provinces and from season to season, showing, for example, a clear decline due to the drought of the 1994-95 season. In general, Spanish production is more intensely affected by climatic factors (frost, summer heat, etc.) than that of other Member States.
Sugar beet is grown in all EU member states except Luxembourg. Germany, France, and Italy are the main producers of both sugar beet and sugar. In total, approximately 2 million hectares of sugar beet are cultivated in the EU, producing around 17 million tons of sugar. Thanks to technological improvements in cultivation and seed varieties, EU sugar yields have increased significantly, currently averaging 8,700 kg of sugar per hectare.
According to the latest Survey of Structures (1997), in Spain there are about 23,800 farms dedicated to sugar beet, with an average area of 7.1 hectares (the EU average is 7.9).
MARKETS
In recent years, the global sugar market has been characterized by overproduction and rising stockpiles. Global stocks are at a historically high level, leading to a decline in prices. In the EU, production also significantly exceeds demand, and storage levels are high.
The global sugar trade is very intense (second only to wheat) and its volume is constantly growing. The main producing countries are Brazil, the EU, Australia, Cuba, and Thailand. More than 701,000 tons of the world's sugar is produced from sugarcane.
Most beet sugar is produced in Europe. The EU's sugar supply comes from 901,000 tons (TP3T) of beet grown within its territory (especially in Germany, France, and Italy), and the remainder is obtained in refineries from cane sugar, primarily from ACP countries, with which the EU has a preferential access agreement of 1.3 million tons.
Sugar is still considered a basic food product, especially in developed countries, so they tend to maintain significant stocks of the product and are quite sensitive to fluctuations in international prices.
Spain is a net importer of sugar, although since the late 1980s, Spanish exports have steadily increased. Imports reached 376,000 tons in 1996, mainly from France, Germany, and Brazil; and exports that same year totaled 184,000 tons, with various destinations, including Turkey, the USA, other EU countries, Poland, and the Czech Republic.
PERSPECTIVES FOR IRRIGATION
There is still some uncertainty regarding the regulatory framework for the sector applicable from 2003 (or 2006) onwards. However, a reduction in prices and external protection, either partial or total, as well as greater restrictions on subsidized exports, can be expected in upcoming WTO negotiations.
Spain produces sugar beets at a higher cost than other EU countries, a situation that cannot be sustained since, sooner or later, the sector will adjust through the GATT or the Common Market Organization (CMO) (reduction of institutional prices). Therefore, the primary objective for irrigated sugar beet cultivation must be the reduction of production costs. If costs were significantly reduced, it might be possible to consider producing grade C sugar so that each farmer could average the price of their grade A, B, and C beets (in the EU, grade C sugar production ranges from 15-201 to 3 tons, with France, in particular, producing 30-351 to 3 tons). However, the possibility of a price weighted with grade C sugar decreases if prices fall in the medium term.
In short, and barring territorial adjustments, it is not possible to consider dedicating newly irrigated land to the beet sector.
3.5.3 Cotton
BASIC CHARACTERISTICS OF THE CMO.
Cotton is one of the agricultural products not included in Annex II of the Treaty of Rome, and therefore is not subject to a Common Market Organisation (CMO). The cotton aid scheme was established following Greece's accession to the then EEC in 1980; the regulations governing aid to the sector were subsequently adapted with the accession of Spain, the other cotton-producing country in the EU. Currently, the general rules of the cotton aid scheme are set out in Regulation (EC) No 1554/95.
The regulation applies to raw, unginned cotton. It essentially consists of a system of subsidies (deficiency payments), calculated as the difference between a target price and the world price. These subsidies are granted to ginning companies that pay a minimum price to the producer. To this end, contracts are drawn up between the industry and the producer, establishing the selling price, product quality and quantity, delivery and payment terms, etc.
The target price (currently 106.3 euros/100 kg of unginned cotton) is applied during the marketing campaign, which runs from September 1 to August 31 of the following year.
The world market price of unginned cotton is determined periodically as a percentage of the world market price of ginned cotton. The Commission determines this world price of ginned cotton based on bids and quotations registered on one or more major European international commodity exchanges.
If raw cotton production exceeds a guaranteed maximum quantity, the target price and the amount of aid are reduced proportionally. In each Member State, the reduction in aid is proportional to the amount exceeded by its national guaranteed quantity (782,000 tonnes for Greece and 249,000 tonnes for Spain). However, the penalty is reduced when the world price level allows for limiting the expenditure of the aid scheme.
In December 1999, the Commission proposed a reform of the cotton aid scheme to achieve greater budgetary stability and implement a series of environmental conditions similar to the common measures applicable to CAP direct payments. The most important points were:
a) the possibility of excluding cotton-growing areas from the aid scheme for environmental reasons;
b) the increase in penalties for exceeding the CMG (from the current 0.5% for every 1% of overshoot, to 0.6% penalty for every 1%).
In its opinion of February 2001, the European Parliament proposed a number of amendments, including:
- adjust upwards the guaranteed national quantities, to reflect the actual level of production (which, from the Commission's point of view, would be unfeasible for budgetary reasons);
- increase the target price and apply bonuses and depreciations to prices based on quality;
- and the application of agri-environmental measures by farmers.
From the time the Commission made its reform proposal until its approval, scheduled for the first half of 2001, the budgetary situation of the sector has changed due to a situation of high prices in the international market, which has resulted in a considerable reduction in the expenses of the aid scheme.
PRODUCTIVE SECTOR
In Spain, the historical average area dedicated to cotton cultivation in recent years is 100,000 hectares, almost all of it irrigated. Cotton fields are concentrated almost exclusively in Andalusia (which influences the location of the ginning industry); cotton is also grown, although to a lesser extent, in Murcia, Valencia, and Extremadura. This geographical concentration of cultivation in certain regions gives cotton significant socioeconomic importance.
The cultivated area varies considerably depending on climatic conditions, as shown by the fact that during the drought years and the corresponding scarcity of irrigation water between 1993 and 1995, the area fell to only 30,000-40,000 hectares. EU penalties for exceeding the guaranteed amount also significantly influence variations in area.
The average Spanish cotton production for the three-year period 1997-1999 was 368,000 tons of raw cotton. The average yield ranged between 3,200 and 3,700 kg/ha of raw cotton.
In Greece, the other EU cotton producer, some 400,000 hectares are cultivated, with an average yield of almost 3,000 kg/ha.
The total EU production for the three-year period 1996-1998 was more than 1.4 million tons of raw cotton.
MARKETS
The agricultural product is raw cotton, but what is traded on international markets is cotton fiber. The fiber is obtained through the ginning process of raw cotton, which consists of removing seeds, boll remnants, leaves, and earthy materials. Cottonseeds are also obtained, from which seed oil is extracted, as well as cottonseed cake for animal feed. In a later stage, the cotton fiber undergoes the spinning process and is then sent to the textile industry.
Since the EU has a much larger spinning capacity than its domestic fiber production, it imports considerable quantities of cotton fiber (around 850,000–900,000 tons/year). Its main suppliers are Russia, the US, Syria, and some African countries.
The situation of international markets is very important for the cotton producing sector, since the amount of aid is calculated as the difference between the target price and a world average price, and there is also the possibility of reviewing the penalties for exceeding the guaranteed quantity if international prices are high and expenses in the sector do not exceed certain limits.
International cotton prices followed an upward trend during the 2000/01 season, but recent forecasts point to a price decline due to increased production. In this context, China's policies regarding production, consumption, and stock reduction could be a determining factor in the evolution of the international market.
Spain imports cotton fiber mainly from the USA, Argentina, Australia, Turkey, and, within the EU, from Greece, the UK, and Germany. The average import volume during the three-year period 1994-1996 was approximately 100,000 tons, while exports have been recovering since 1994, reaching around 30,000 tons in 1996. The main destinations are EU countries: France, the UK, Portugal, Belgium, and Luxembourg.
PERSPECTIVES FOR IRRIGATION
The current system of aid for cotton cultivation establishes a guaranteed national quantity for Spain of
249,000 tons of raw cotton, which under certain circumstances of international markets and global cost of regulation, can rise to about 270,000 tons.
A yield of 249,000 tons can be achieved with an area of 70,000-75,000 hectares, depending on yields. Exceeding the maximum yield potential (MWP) results in a reduction of the target price by 501% of the percentage by which the MWP is exceeded. Clearly, there is some room for increasing the acreage if productivity allows for the target price to be adjusted to a certain level of reduction.
The problem lies in the fact that the efficiency and vulnerability of all farmers are not the same, and that problems frequently arise in the face of potential discounts (penalties) that some farmers do not want or cannot bear, while others could coexist with them.
On the other hand, the price levels actually paid to farmers have been affected on several occasions by problems among the ginning industries, of competition for raw material market shares.
In summary, the margin for increasing irrigated land applicable to the cotton sector is relatively small.
3.5.4 Tobacco
BASIC CHARACTERISTICS OF THE CMO.
The CMO in the raw tobacco sector has been reformed twice recently. In 1992, Regulation (EC) No 2075/92 established a quota system by Member State and by variety groups (8 groups in total) and abolished intervention and export refunds.
The 8 groups of varieties are:
- hot air cured tobacco (“flue cured”)
- light air cured tobacco
- black air cured tobacco
- sun-cured tobacco
- fire-cured tobacco
- Basmas (sun-cured tobacco)
- Katerini (sun-cured tobacco)
- Kaba Koulak and similar (sun-cured tobacco).
Since the 1999 harvest, a new reform of the Common Market Organization (CMO), established by Regulation (EC) No 2848/98, has been in effect. This reform aims to improve product quality and facilitate voluntary withdrawals from production. It also approved stricter controls and enforcement of public health requirements. The new system has undergone a three-year implementation phase and will be fully operational from the 2002 season onwards.
The mechanisms of the CMO are basically: a premium scheme, a production control scheme, production guidance measures, an exchange scheme and control measures.
Premiums are granted to producers through primary processing companies, by means of contracts between them, in order to guarantee a stable outlet for the product for farmers and a regular supply for the industries. A single amount is established for each variety group for each harvest.
Since the 1998 reform, the premium comprises a fixed part, a variable part (intended to promote quality) and a specific aid:
- The fixed part is paid for the amount of leaf tobacco delivered by the producer to the first processing company, in accordance with the contract entered into, regardless of the quality as long as the minimum quality requirements are respected.
- The variable part (from 30 to 45%) is paid by producer groups to their members, based on the market price obtained per lot and individual farmer, this price being the established quality indicator.
- The specific aid (2% of the total premium) is granted to producer groups in order to facilitate new management tasks and finance agro-environmental improvement measures.
The production control system is based on setting a maximum overall guarantee threshold (for Spain:
42,000 tonnes of raw leaf tobacco), with specific thresholds for each variety group. Respecting these thresholds, Member States distribute the production quotas for each variety group among individual producers or their associations, for three consecutive harvests.
To encourage producers to convert to new farms and restructure their operations, a system was also approved for producers who decided to leave the sector and reacquire their quotas, with the possibility of excluding certain varieties or sensitive regions. Furthermore, the transfer and assignment of quotas between producers was made more flexible. In addition, Member States must establish a national reserve of production quotas for each harvest, organized by variety groups. These quotas are allocated to consolidate existing production or to encourage young farmers to enter the sector.
As regards the measures for guiding production, they consist mainly of: (1) increasing the role of professional and interprofessional associations; (2) establishing a community fund for research and information on tobacco, financed by a withholding on the premium amount; and (3) implementing programs to convert certain varieties towards those that are less harmful and more adapted to the market or towards alternative uses (medical and pharmacological research).
Imports are subject to the common customs tariff. As mentioned earlier, export refunds were eliminated in the 1992 reform.
PRODUCTIVE SECTOR
Tobacco cultivation in Spain occupies approximately 16,000-18,000 hectares, under irrigation. The crop is located almost exclusively in Cáceres and, to a lesser extent, in Granada, Ávila, Toledo, and Badajoz.
The yield is approximately 2,700 kg/ha, varying considerably between provinces and by variety group; on average, yields have increased substantially since our accession. Production of dried and fermented tobacco during the three-year period 1995-1997 was approximately 44,500 tons. The main varieties produced are hot-air cured, light-colored air-cured, and dark-colored air-cured tobacco.
Total EU raw tobacco production for the three-year period 1996-1998 was approximately 338,000 tons. The main producers were Italy (130,000 tons), Greece (122,000 tons), Spain and France (approximately 25,000 tons each), followed by Germany, Portugal, and Belgium. On average, the yield of raw tobacco in the EU was approximately 2,400 kg/ha, ranging from 2,000 kg/ha in Greece to 3,600 kg/ha in Belgium.
For technical reasons, tobacco cultivation is difficult to mechanize and therefore requires a high level of labor (approximately 2,200 ATU/hectare). In the EU, this activity employs around 200,000 people in production and processing. Furthermore, there are few viable agricultural alternatives to tobacco cultivation, and it is concentrated in disadvantaged regions. Its contribution to maintaining rural communities and related industrial activity are key reasons why the EU continues to provide financial support to the sector, which would otherwise disappear.
MARKETS
Global production of raw tobacco is located mainly in Asia, with China being the world's leading producer (around 40% of the total), followed by the USA, India, Brazil and certain African countries.
The global tobacco market is highly dynamic but opaque, due to the large number of varieties, varying qualities, and prices of raw tobacco, as well as the market dominance of a small number of large multinational companies. The United States is the most active country in the global market, as it is the world's leading importer and exporter, with significant production, manufacturing, and consumption.
Typically, developed countries, with high consumption, low production, and a greater relative weight of manufacturing, are the main importers. Currently, the European tobacco industry imports approximately...
80% of your needs. EU imports reach 540,000 tons (1998).
EU production remains specialized in the medium-to-low quality segment, finding its markets in certain countries with low living standards and less stringent quality requirements. In recent years, the EU has increased its exports (reaching 178,000 tons in 1998), primarily of oriental varieties, sought after for their aromatic characteristics.
Spain is a net importer of raw tobacco, coming from the USA, Brazil, Türkiye and Canada, although it also exports tobacco mainly to other EU countries.
PERSPECTIVES FOR IRRIGATION
The continuity of the raw tobacco sector in the EU is closely linked to the existence of a system of subsidies, which are maintained for social and land use reasons, since it is estimated that the elimination of EU aid to this sector would cause the loss of some 200,000 jobs in the EU.
The Common Market Organization (CMO) is based on a system of individual production quotas for each variety, of which Spain is allocated 42,000 tons, equivalent to approximately 16,000 hectares. Economically, tobacco cannot be produced without the corresponding quota support. Consequently, there is no room for increasing the irrigated area dedicated to tobacco cultivation.
In areas where tobacco is currently grown, irrigation improvement efforts should focus on maintaining the quality of irrigation water, given the plant's high sensitivity to water quality, especially chloride content.
3.5.5 Olive oil
BASIC CHARACTERISTICS OF THE CMO.
In 1998, the introduction of important adjustments to the Community regulation of the olive oil sector was approved, on a transitional basis until October 31, 2001, from which date a new regulation should come into force to replace Regulation 136/66/EEC, which establishes the CMO of fats.
The mechanism to support producers' incomes basically consists of granting production aid (currently 1,322.5 euros/ton), limited to a guaranteed maximum amount, exceeding which implies a proportional reduction of aid for all producers.
The main changes introduced in the CMO from the 1998/99 campaign onwards, in force during the period 1998 to 2001, are:
- the disappearance of the public intervention regime; although, in the event of severe market imbalances, a mechanism for aid to private storage would be implemented;
- the disappearance of aid for olive oil consumption;
- Production aid is granted based on the actual production delivered, which implies the disappearance of the special lump-sum aid scheme for small producers;
- As a stabilizing mechanism, the replacement of the maximum guaranteed Community quantity (MGC) by nationally guaranteed quantities of each Member State (NGC), calculated on the basis of average productions of a reference period (in Spain it is 760,027 tons); in addition, the total EU MGC is now 1,777,261 tons, whereas in the previous system the Community MGC was 1,350,000 tons;
- and the possibility for Member States to grant aid to table olives, within their CNG and their production aid (as has been done in Spain).
Furthermore, statistical knowledge of the sector has improved, and progress has been made in the oversight of olive mills. However, better information on olive grove areas and yields in the various EU production zones still seems necessary, which was the objective to be achieved during the 1998-2001 transitional period.
Imports of olive oil into the EU are subject to customs duties. However, the volume of imports is quite small compared to domestic production, and virtually all of it is imported under preferential conditions, primarily from Tunisia.
Regarding exports, refunds are granted to improve the competitiveness of EU olive oil in international markets. However, as a consequence of the GATT commitment, the volume of subsidized exports for each season is limited. Given that the EU is the main supplier in the international market, if the domestic price of olive oil does not rise too much, this limitation should not pose significant competitive problems for olive oil compared to other vegetable oils. Nevertheless, it clearly restricts the increase in EU production and necessitates complementary measures, particularly those promoting olive oil consumption in both domestic and international markets.
The modification of the current Common Market Organization (CMO) for olive oil has already led to several agreements by the Council, based on the so-called "Options Document," regarding the elimination of consumption aid, the removal of intervention, and the creation of a geographical information system. Debates will now focus on whether to maintain or eliminate production aid, proportional to actual production, along with the related measures of Guaranteed Minimum Income (GMI) and Guaranteed Minimum Income (GMI). If GMI is eliminated, aid would be granted per tree or per area of cultivated olive groves.
Some Member States, including Spain, continue to believe that, despite ongoing studies, the Commission still lacks reliable data for the correct determination of the CNG or its equivalent, should aid per olive tree or per area be implemented.
In December 2000, the Commission presented to the Council a proposal for a two-year extension of the aid scheme, together with a new quality strategy.
PRODUCTIVE SECTOR
The olive tree is characteristic of the Mediterranean basin. It is known for its longevity, hardiness, and alternate bearing, which is the alternation of production from one year to the next, or even from one to three years (a trait that significantly influences the marketing and prices of olive oil). Its resistance to semi-arid conditions and poor soils allows it to be planted in areas where other crops would not be possible. Technological improvements applied to its cultivation have resulted in notable increases in yields.
The main product is olive oil, but the importance of by-products such as olive pomace (for oils, animal feed, etc.), wood or leaves (for the pharmaceutical industry) cannot be underestimated.
The distribution of olive grove areas and yields in Spain, according to the MAPA Statistics Yearbook (2000), is as follows:
| Data 1996 | Area under regular planting, in production (hectares) | Scattered trees (number) | Yield on production area (kg/ha) | Yield of scattered trees (kg/tree) | ||
|---|---|---|---|---|---|---|
| Dry land | Irrigation | Dry land | Irrigation | |||
| table olive | 105.733 | 24.671 | 97.553 | 1.228 | 2.361 | 9 |
| Oil mill olive | 1.841.864 | 153.364 | 589.166 | 2.010 | 3.901 | 18 |
| total olive grove | 1.947.597 | 178.035 | 686.719 | – | – | |
Since joining the EEC, the previous trend was broken and the area of olive groves increased, both through new plantings and the recovery of others that were almost abandoned.
Olive groves for oil production are distributed across almost the entire country (except the Cantabrian coast), with a clear concentration in the southern and eastern parts of the Iberian Peninsula. Andalusia has over 1 million hectares in production, with Jaén and Córdoba leading the way; followed by Castile-La Mancha (258,000 hectares), Extremadura (213,000), Catalonia (105,000), and to a lesser extent, Valencia, Aragon, and Madrid. The distribution of table olive groves is very similar, although they are located almost entirely in Andalusia and Extremadura.
Olive yields for oil production vary considerably between provinces, although they generally show less variation in irrigated areas. Andalusia has the highest yields, exceeding 4,500 kg/ha in Málaga, Córdoba, and Jaén.
The average olive production for oil production during the period 1996-1999 was 4.3 million tons. On average, approximately 867,000 tons of olive oil were produced during the same period.
Spanish olive oil production in the early 1990s was around 650,000 tons. The alternate bearing and drought of the 1994/95 and 1995/96 seasons masked the increased production resulting from the expansion of acreage and improvements in cultivation techniques (including irrigation), which became apparent in subsequent seasons with harvests of approximately 900,000 tons. Preliminary production estimates for 1999 and 2000 indicate figures of 650,000 and 945,000 tons, respectively.
Olive oil production in Spain is expected to continue increasing, at least until 2006, when the plantations established in 1998 will begin producing (the rate of new plantings is expected to decline since those established after 1998 are ineligible for subsidies). Furthermore, production is becoming increasingly concentrated: it is currently estimated that 501,000 tons of the total area contributes 801,000 tons of production. In fact, many marginal or low-yield olive groves would likely disappear if the level of financial support were reduced.
In Spain, three basic farming systems can be identified:
- Traditional olive cultivation in areas with agronomic limitations of climate and soil and difficult conversion to another crop, which have survived abandonment due to the greater profitability derived from community aid; only from an environmental or landscape point of view would these olive groves be sustainable;
- traditional olive cultivation that can be improved, in areas with surmountable agronomic limitations, and whose productivity is improving with the application of technological improvements;
- Intensive olive cultivation, mainly of recent plantations (from the last 20-25 years), whose production model is similar to that of fruit trees, with choice of varieties, selected plant material to shorten the unproductive period, choice of planting densities, localized irrigation, fertigation and phytosanitary control, use of machinery in harvesting, etc.; these plantations require large investments and a sufficient size for the rational use of the means of production, but they achieve good productive and economic profitability.
MARKETS
The production, consumption and international trade of olive oil is concentrated in the Mediterranean countries, among which Spain has historically played a major role.
Olive oil represents only about 31% of the total edible oils in the global market. Other edible oils (sunflower, soybean, etc.) operate in larger markets. The main competition for olive oil comes from seed oils, which are partial substitutes for it in consumption and are significantly cheaper.
Global olive oil production averages 2.3 million tons, of which 781,000 tons are produced in the EU. Other significant producing countries include Tunisia (155,000 tons), Turkey (90,000), Syria (75,000), and Morocco (45,000).
The situation of the world olive oil market is greatly influenced by what happens in the community market, not only because of the volume of community production but also because consumption in the EU accounts for 73% of world consumption.
The main suppliers of olive oil are Greece and Spain, while Italy, a producing and exporting country, is the main buyer. In the 1997/98 season, olive oil imports reached 46,000 tons, coming from the Maghreb under preferential trade agreements, while exports in the same season totaled 188,000 tons.
Spain is a major and long-standing exporter of olive oil. Exports are primarily destined for the EU, especially Italy, Portugal, and France, and in smaller quantities for countries such as the United Kingdom, Germany, and Denmark. In recent years, as part of a necessary internationalization of Spanish production, new markets are gradually opening up in high-income countries such as the United States, Canada, Japan, and Switzerland. Imports into Spain come from other EU producing countries, as well as from Türkiye.
Spain is also a major producer and exporter of seasoned olives, which are mainly sent to the USA, Italy, France, Germany or Canada.
Finally, it is important to highlight the increases in olive oil production in third countries of the Mediterranean, in particular Tunisia, Morocco, Syria and Turkey, which are progressively entering the community market and which, in the future, could also be directed towards meeting the demand of new foreign markets, in competition with Spanish production.
PERSPECTIVES FOR IRRIGATION
Olive oil production is highly sensitive to regulatory changes. The sector's foreseeable evolution during the period 2000-2006 will already be shaped by the events of the last decade. Looking ahead, the search for new markets, both within the EU and in third countries, will be crucial, especially given the consolidation of significant production figures. Favorable factors include gastronomic and dietary trends, potential price reductions, and promotional opportunities; disadvantages include limitations on export refunds stemming from GATT commitments.
In any case, and in an analysis similar to that of the vineyard, the economic results of applying irrigation to olive groves are spectacular and, consequently, are considered unstoppable. Whether with low-intensity irrigation using drip techniques, or with more intensive irrigation, even with trellised planting and pruning, the security and increase in production compensate for the installation costs.
It seems clear that uncontrolled growth in production and yields is not possible, as there is neither a market nor sufficient support for it, but in the relative competitiveness between dryland and irrigated farming, the latter is destined to consolidate larger shares in the sector.
3.5.6 Wine
BASIC CHARACTERISTICS OF THE CMO.
The wine sector was finally included in the reform of the CAP under Agenda 2000. The new CMO for the wine sector, established by Regulation (EC) No 1493/1999, entered into force on 1 August 2000.
In recent years, the wine market had evolved towards a situation of relative equilibrium, much more favorable for the sector than the surplus situation of 1994, when the first reform proposal began to be debated, which proposed measures to reduce the production potential that were more drastic than the current ones.
The objectives of the new Common Market Organization (CMO) for wine are to achieve a better balance between supply and demand in the Community market, while simultaneously enabling producers to exploit expanding markets and helping the sector achieve lasting competitiveness. It also aims to eliminate the use of intervention as a solution for surplus production, maintain the range of traditional markets for drinking alcohol and grape products, protect regional diversity, and recognize the role of producer and interprofessional organizations. Finally, it significantly simplifies the regulations governing this sector, in line with the general clarification of the Common Agricultural Policy (CAP) initiated in 1995 and ratified in Agenda 2000.
The fundamental aspects of the new CMO approved in 1999 are:
1. Maintaining current wine-growing potential will be achieved through two basic measures: a ban on new plantings, except in certain cases; and the creation of a system of replanting rights, whereby an individual winegrower could lose a right due to expiration, but not, generally, the Member State. Premiums for abandonment of vineyards will be maintained, with the eligible areas and application conditions left to the discretion of the Member States.
The planting of new vines is prohibited until July 31, 2010, unless carried out in accordance with:
to) A right of new planting, granted by the Member State (art. 3):
– For areas intended for new plantings within the framework of structural adjustment measures adopted pursuant to national legislation; or intended for viticultural experimentation or the cultivation of mother vines for grafting; or for the winegrower's family consumption.
– And before July 31, 2003, for areas intended for the production of vcprd (quality wines produced in specific regions) or a table wine designated by a geographical indication, where it has been recognized that the production of that wine is significantly below demand. These newly created rights are allocated per Member State (in Spain: 17,335 hectares), plus a Community reserve of 17,000 hectares.
b) Replanting rights granted by the Member State to producers who have uprooted vines, or similar rights granted under previous Community or national legislation (Art. 4).
c) Planting rights originating from a national or regional reserve and granted by the Member State (Art. 5).
2. In terms of the market, the system is shifting from one based on the obligation to distill a certain volume of wine (to maintain market prices) to one where distillation will be based on the producers' needs for alcohol on the market. brandies and fortified wines. In the event of severe surpluses, a crisis distillation may be triggered.
Furthermore, the campaign has been brought forward by one month, now running from August 1st to July 31st of the following year.
3. Matching supply to demand through vineyard restructuring and conversion plans, which include varietal conversion, vineyard replanting, and improvements in management techniques. These plans are the responsibility of the Member States.
In order to benefit from new planting rights, as well as aid for restructuring and conversion, States are required to provide a prior inventory (areas, varieties, planting rights, etc.), which can be prepared by region.
Furthermore, the 1999 reform strengthened measures relating to the elimination of winemaking by-products, aid for the private storage of table wines and musts, and support for the use of musts to increase the alcoholic degree and the production of juices.
Regarding trade, wine imports are subject to the common customs tariff. In the GATT Uruguay Round, the EU decided to abandon the reference price protection system (although it does apply to grape must) to avoid having to assume minimum access commitments, the implementation of which in the EU would have been complicated, since imports during the reference period represented a very low percentage of domestic consumption (less than the 51 TP3T minimum access commitment under the GATT). As for exports, variable refunds are granted depending on the product and destination, although these generally do not represent significant volumes.
PRODUCTIVE SECTOR
According to the MAPA Statistical Yearbook (2000), the surface area and yields of vineyards in Spain are distributed as follows:
| Data 1996 | Area in production (hectares) | Yields (kg/ha) | ||
|---|---|---|---|---|
| Dry land | Irrigation | Dry land | Irrigation | |
| Table grape vineyard | 16.767 | 16.814 | 4.113 | 17.811 |
| Vineyard wine grapes | 1.024.661 | 60.350 | 4.000 | 8.274 |
| Vineyard of raisin grapes | 3.764 | – | 1.813 | – |
| Total Vineyard | 1.045.192 | 77.164 | 3.988 | 10.367 |
The vineyard area is spread throughout Spain, including the islands, with a marked regional specialization in terms of grape varieties cultivated, types and qualities of wines produced.
Grape production for processing (including raisins, must, and wine) during the three-year period 1997-1999 was 4,933 thousand tons. Almost all of this volume was used for wine and must, while raisin production reached just over 0.21 thousand tons.
Total new wine production, on average for the three-year period 1996-1998, is approximately 32 million hectoliters. Since joining the EU, wine production has followed an irregular trend, with marked variations depending on the agro-climatic season, fluctuating between historical highs of approximately 39 million hectoliters (1990) and lows of 20-22 million hectoliters coinciding with droughts (1988, 1994, and 1995).
The distribution by types of new wine produced in the 1996-97 campaign was as follows:
| (hectoliters) | Whites | Reds and rosés | Total | % |
|---|---|---|---|---|
| vcprd | 5.502.309 | 6.232.101 | 11.734.410 | 38,6 |
| – sparkling | 1.217.250 | 1.963 | 1.219.213 | |
| – of liquor | 1.383.243 | 128 | 1.383.371 | |
| - others | 2.901.816 | 6.230.010 | 9.131.826 | |
| table wines | 10.044.308 | 7.537.212 | 17.581.520 | 57,8 |
| Other wines * | 953.076 | 132.244 | 1.085.320 | 3,6 |
| TOTAL New wine | 16.499.693 | 13.901.557 | 30.401.250 | 100 |
*: includes liqueur wine and sparkling non-quality wines psr, flavored wines, for vinegars, etc.
The EU wine sector is of great socio-economic importance, with 1.7 million producers and a leading position in the global market; it is dynamic and highly diversified. The total vineyard area in the EU is 3.3 million hectares, with a total production of approximately 160 million hectoliters (1997/98), of which 571% are table wines and 351% are premium quality wines.
Spain has the largest vineyard area in the European Union, followed by France and Italy, and further behind, Portugal and Germany. However, wine production in France and Italy, at 53 and 50 million hectoliters respectively in the 1997/98 season, is significantly higher than in Spain.
The average EU yield is around 49 hectoliters/ha. In Spain, the yield is 28 hectoliters/ha, while in countries like Germany, Greece, and Luxembourg, it exceeds 75-80 hectoliters/ha on average, although Luxembourg reached 150 hectoliters/ha in previous seasons. France and Italy have a yield of 63 hectoliters/ha, and only in Portugal and the United Kingdom are the figures lower than those in Spain (all data are averages of the 1996/97 and 1997/98 seasons; source: Eurostat).
These yield differences are explained by the different varieties, cultivation methods, and winemaking practices. Primarily, this is due to the fact that in other EU countries, especially France and Italy, vines have been cultivated almost like fruit trees, resulting in extensive vegetative growth; whereas in Spain, vineyards have generally been dry-farmed, extensively cultivated, and even on marginal land, yielding lower production but with higher sugar content, thanks to the climatic conditions. It is also true that in Spain, the Statute of Vineyards, Wine, and Spirits did not permit vineyard irrigation in areas where it had not traditionally been practiced.
Furthermore, one of the winemaking practices that introduces the greatest differences in yields is chaptalization, or the artificial enrichment of the alcohol content; a practice necessary in regions with little sunshine and, therefore, traditional in the wine-producing areas of Northern Europe. Obviously, the wine styles characteristic of the different wine-growing regions within the European Union are also very different.
For quite some time, Spain specialized in table wines, offering good value for money, and in exporting bulk wine to other EU countries for blending. However, in recent years, domestic regions and producers have been producing higher-quality wines, consolidating their designations of origin, and improving their marketing.
MARKETS
The international wine market is characterized by a high degree of concentration. The major wine producers are several EU countries, as well as the United States, Argentina, Australia, and to a lesser extent, Romania and Hungary. Demand for wine is also concentrated in a few countries, primarily European, followed by countries with a high standard of living (the US, Canada, Switzerland, and Japan).
The EU as a whole accounts for 601 million hectoliters of global exports and almost 301 million hectoliters of imports (1997 data; Eurostat). EU member states play a very active role in global markets, with France standing out as a major importer and exporter. Intra-EU trade in the wine sector is very significant, with a volume exceeding 30 million hectoliters.
The trend in markets, both globally and regionally, is toward a decrease in bulk wine trade and an increase in bottled and quality wine trade. Although EU wine production remains the leader, in recent years wines from Australia, California, South Africa, and other emerging countries have been gaining ground, largely thanks to aggressive marketing strategies.
Spain is a net exporter of wine and must (with a surplus of 567,000 tons in 1996), ranking as the world's third-largest exporter after France and Italy. The main destinations are other EU countries (Germany, France, and the United Kingdom). Imports come from France, Italy, and Portugal, and from outside the EU, almost exclusively from Argentina, with a dramatic increase in the 1995 season.
In any case, a complete analysis of the global and community wine market should be related to the market for other alcoholic beverages: beer (a substitute in consumption) and spirits.
PERSPECTIVES FOR IRRIGATION
This is a sector where the future does not fundamentally depend on EU legislation itself. Spain has a surplus in wine production, as does the EU as a whole, and imports of wines from emerging countries (Chile, New Zealand, Australia, Argentina) will continue to increase. Therefore, even if the trend toward reduced consumption halts, or even if consumption increases or shifts to other EU wines, the sector will face a structurally surplus situation. The problem then arises of finding solutions for those vineyard areas that lack market opportunities or alternative crops.
Notwithstanding the above, any Spanish winegrower who can establish a supplemental irrigation system with minimal investment will almost certainly do so, to avoid dependence on the weather and to secure yields that, while modest compared to those in Northern Europe, will allow them to reach the viability threshold of their production activity. This will typically involve low-intensity irrigation with low water consumption.
However, it should be noted that, in general, the geography of vineyards does not correspond to the geography of water resources. But there is no doubt that in Catalonia, in the Douro Valley, and in other similar regions, these supplemental irrigations will be implemented where possible, if they are not already being implemented. It is worth highlighting that drip irrigation techniques allow for the irrigation of hillside areas that cannot be irrigated using traditional methods.
In short, it is estimated that the Spanish vineyard sector is destined to absorb significant amounts of irrigated land to the extent that it is possible to overlap water with land vocationally dedicated to vineyards.
3.5.7 Fruits and vegetables, potatoes and flowers
BASIC CHARACTERISTICS OF THE CMO.
The last major modification of the CMO for the fruit and vegetable sector, both fresh and processed, dates back to 1996 and aimed to enable producers to better respond to market and consumer expectations regarding quantity, quality and prices.
The adoption of Regulation (EC) 2200/96 within the framework of fresh fruit and vegetables aimed to strengthen the role of producer organizations (POs), reduce structural surpluses and progressively promote the reduction of product withdrawals from the market, primarily through the creation of operational funds managed by POs in order to improve the quality of product marketing.
The main instrument provided for under the CMO is the operational fund. Producer organizations can establish this fund with EU funding, which is intended to finance improvements in production and marketing structures. The maximum EU aid is set at 4.51% of the value of the production marketed by each producer organization, provided that the total financial aid represents less than 2.51% of the total turnover of all producer organizations. The aim of these improvements is to achieve greater competitiveness in order to meet the challenges posed by the opening of EU markets and the increasingly demanding requirements and greater bargaining power of buyers.
The second mechanism contemplated by the CMO to regulate the fruit and vegetable market is withdrawal, as a safety net for farmers' income and regulator of supply at cyclical times to avoid price collapses.
Regulation (EC) 2201/96 was adopted for processed fruit and vegetable products. Although the common organization of markets that regulates this sector covers, in principle, all processed fruit and vegetable products, Community aid is concentrated on certain products:
- aid to the transformation subject to compliance with the payment of a minimum price to the producer in the case of tomatoes:
- Aid for processing subject to compliance with the payment of a minimum price to the producer for other products: peaches, pears, prunes, dried figs and pineapple:
- intervention and assistance in the storage of raisins and dried figs at the end of the season and assistance per hectare for raisins;
- duty-free quotas for mushrooms;
- a minimum import price regime for raisins and certain processed cherry products, and for the import of red fruits from certain countries in Central and Eastern Europe, including the Baltic countries;
- Raspberries intended for processing and raisins also benefit from specific measures to improve product quality and marketing.
The production aid established by this Regulation is paid to processors who have purchased their raw materials from producers at prices no lower than the minimum prices (set annually, as are the aid payments). To this end, contracts are concluded between producer organizations and processors (until the end of 2001, contracts between individual producers and processors could also be concluded in this sector, with a decreasing percentage).
The Regulation sets Community production thresholds, exceeding which entails a proportional reduction in aid for the following year. Thus, for Spain, the guaranteed threshold for 1999 is set at 582,000 tons of processed peaches and 102,805 tons for processed Williams and Rocha pears.
However, in the case of tomatoes, aid to processors is not based on such thresholds but on quotas, distributed by country and product group and among processing companies. These quotas are established based on the average quantities of raw materials for which minimum prices have been respected during the three previous seasons. No aid is paid for quantities produced that exceed the quota, even if the minimum price is respected. The quotas allocated to Spain, taking into account production paid at the minimum price, amounted to 696,663 tons for concentrated tomato, 149,948 tons for whole peeled tomatoes, and 150,219 tons for other fresh tomato products for the 1999/2000 season, totaling 1,004,830 tons.
Finally, Regulation (EC) 2202/96 provides aid to producers of certain citrus fruits. This is compensatory aid paid directly to producer organizations (POs) that deliver lemons, grapefruit, pomelos, oranges, mandarins, clementines, and satsumas harvested in the Community for processing under contracts between the POs and processors. Exceeding the processing thresholds set in the Regulation results in a proportional reduction of the aid the following year.
The existing regulations on fruit and vegetables were to be reviewed before the end of 2000. The Commission was to submit a report to the Council on the functioning of the CMO before that date. Based on this report, the Commission would consider the need to propose a more comprehensive adaptation of the provisions in question. This proposal was to enter into force in the 2001/2002 marketing year.
Therefore, at the Commission's proposal, on 4 December 2000 the Council adopted Regulation 2699/2000 amending the three regulations mentioned above.
This regulation will apply to each product or group of products concerned from the 2001-2002 marketing year. It is therefore the first substantial amendment to the reform of the fruit and vegetable sector adopted by the Council in November 1996. Its essential elements are as follows:
- Replacement of the double maximum limit for Community aid to the operational funds of producer organizations with a single limit of 4.1% of the value of the production marketed by each producer organization.
- The system governing tomato processing has been substantially modified. The quotas for the three product groups will be replaced by a single Community threshold, distributed among the Member States in national thresholds (which they may further subdivide into two). If the Community threshold is exceeded, aid for the following marketing year will be reduced proportionally in the Member States that have exceeded their national threshold.
The aid is set at €34.5 per tonne of fresh tomatoes, regardless of the finished product (concentrate, peeled tomatoes, etc.). The Community threshold is set at 8,251,455 tonnes, representing a 29.71% increase over the Community quota for 2000-2001. The aid will be paid to producer organizations, which will then distribute it to the producers. The selling price of tomatoes intended for processing will be freely negotiated between producer organizations and processors; the minimum price has been eliminated.
- The scheme for processing peaches and pears is aligned with that for tomatoes: from the 2001-2002 season onwards, aid and the processing threshold will be applied to the raw material. Aid is set at €47.70/t for peaches and €161.70/t for pears. Community thresholds are set at 539,000 t for peaches and 104,617 t for pears. These thresholds are also broken down into national thresholds. Aid will be paid to producer organizations, and there will no longer be minimum prices.
- Regarding citrus fruits, the processing thresholds have increased to 1,500,236 tons for oranges, 510,600 tons for lemons, and 384,000 tons for small citrus fruits. The aid amounts remain unchanged.
On the other hand, the Uruguay Round Agreements of the GATT meant the general dismantling of 201% of tariff and entry price protections for fruits and vegetables. It is worth noting their low average level for fruits and vegetables, as well as their variation throughout the season, with the lowest EU protection coinciding with the periods of Spanish horticultural export production. Furthermore, a reduction of subsidized exports was established, amounting to 361% in monetary terms and 211% in physical quantities, which may affect, depending on market conditions, the total quantities of fruit and vegetables exported under restitution. The trend in these multilateral talks within the framework of the WTO is to continue this opening in the upcoming negotiations.
The consequences of this opening are, on the one hand, the increase in exports from other countries to the EU, given that it is one of the markets with the greatest purchasing power and, on the other hand, the need for EU products to compete in many cases with products from countries with low production costs, as a result of their wage levels, tax burdens and other production factors.
Complementary to the trade policies agreed in the multilateral sphere, the Community establishes bilateral agreements for commercial interest (Mercosur or South Africa) or for development aid and cooperation with certain countries (ACP, GSP, Euro-Mediterranean agreements), which further facilitate access for agricultural products and, in particular, fruit and vegetable products to the EU.
In this respect, agreements with countries in the Mediterranean basin have the greatest impact on Spain due to their proximity, similar production conditions, the range of products they can develop, and their low production costs. The competitiveness of these countries has been particularly evident in winter horticultural products, having had less influence on citrus fruits.
On the other hand, the agreement with South Africa may influence the citrus market, while the agreements with Mercosur could affect apples, table grapes, and lemons. The supply of these products occurs outside the Spanish growing season, but it could impact the marketing of chilled goods. The tropical fruit market is most affected by imports from Mexico, South Africa, and Israel, particularly with regard to avocados.
PRODUCTIVE SECTOR IN SPAIN, MARKETS AND PROSPECTS FOR IRRIGATION
General features
Spanish fruit and vegetable cultivation, including potatoes, covers an area of around 1.8 million hectares, with 30% corresponding to vegetables (including potatoes), 15% to citrus fruits, 20% to stone fruit and 35% to nuts.
The cultivated area is distributed throughout the country, although the regions of Andalusia (241,000 tons), Valencia (231,000 tons), Murcia (111,000 tons), and Catalonia (111,000 tons) account for more than two-thirds of the total area. Total production reaches approximately 20 million tons (excluding potatoes), of which 551,000 tons are vegetables, 221,000 tons are citrus fruits, and the remaining 231,000 tons are other fruits.
However, six products account for over 501,000 tons of Spanish fruit and vegetable production. These are tomatoes for fresh consumption and processing (171,000 tons), oranges (121,000 tons), mandarins (91,000 tons), and lettuce, melons, and onions (each representing approximately 51,000 tons). If we add peaches, peppers, and apples (each accounting for 4.51,000 tons of total production), these nine products represent two-thirds of Spain's fruit and vegetable production.
In monetary terms, the production of fruits and vegetables represents a figure at farm level close to 1.2 trillion pesetas, which represents around 25% of the Final Agricultural Production and 45% of plant production.
Within the Community, Spain is the second largest producer of fruits and vegetables, contributing around 26% of the total production value and standing slightly behind Italy, which produces 29%, and a great distance from other major producing countries, such as France (12%) and Greece (10%).
This sector contributes 501,330 pesetas to Spanish agri-food exports, which total approximately 2.2 trillion pesetas. Of this, 261,330 pesetas correspond to fruit exports, primarily citrus fruits; 161,330 pesetas to vegetables; and 81,330 pesetas to processed fruit and vegetable products. The European Union accounts for 901,330 pesetas of these exports. The significant surplus in the fruit and vegetable trade balance reflects the sector's export orientation and its dependence on foreign markets.
On the other hand, imports in the fruit and vegetable sector only account for 101% of total agri-food sector imports, with 41% being fresh fruit, 51% fresh vegetables, and 21% processed fruit and vegetables. These imports originate from the EU, with 40% coming from other countries and 60% from third countries.
Global fruit and vegetable production is constantly increasing. In 1997, it reached almost 915 million tons, representing an increase of 1.11 million tons compared to 1996 and 28.21 million tons compared to the average production for the period 1989-1991. Of this total, approximately 651 million tons corresponded to vegetables. In 1997, the European Community was the world's second-largest producer with 88 million tons, after China (286 million tons).
The Community is a net importer of fruit and vegetables, with exports (3.35 million metric tons) representing 631% of total imports (5.3 million metric tons) in 1998. Thus, the European Union as a whole has a fruit deficit, primarily in oranges processed into juice, tropical fruits, and apples. The total value of fruit and vegetable imports in the EU amounts to $15 billion.
However, the demand for fruits and vegetables in the community area, a priority destination for our exports, is stagnant and in danger of recession due to competition from other substitute products, as well as slow population growth.
Furthermore, there is an increase in the quantity offered, presenting products different from the traditional ones, as a result of the new demands of the market.
The upcoming European expansion with the incorporation of Eastern European countries will lead to a significant increase in the number of consumers. As their incomes improve, we can expect an increase in demand for fruits and vegetables, particularly our export products.
Vegetables
The approximate distribution of land dedicated to vegetables in Spain is as follows:
| SURFACE (ha) | |
|---|---|
| Dry land | 42.049 |
| Outdoor irrigation | 286.347 |
| Protected irrigation | 70.335 |
| Total | 398.727 |
The main dedications are:
| CROPS | SURFACE (Ha) | PRODUCTION (t) | |||
|---|---|---|---|---|---|
| DRY | IRRIGATION | TOTAL | |||
| Fresh air | Protected | ||||
| Cabbage | 3.332 | 8.097 | 780 | 12.209 | 354.227 |
| Asparagus | 2.544 | 12.651 | 3.020 | 18.215 | 74.135 |
| Lettuce | 1.057 | 31.645 | 821 | 33.523 | 923.605 |
| Watermelon | 5.145 | 8.088 | 6.895 | 20.128 | 651.419 |
| Melon | 8.056 | 22.668 | 12.710 | 43.434 | 967.860 |
| Tomato | 1.751 | 41.861 | 13.222 | 56.834 | 3.326.397 |
| Pepper | 626 | 12.909 | 9.712 | 23.247 | 867.667 |
| Artichoke | 90 | 18.924 | 108 | 19.122 | 278.397 |
| Garlic | 8.472 | 17.748 | – | 26.220 | 212.918 |
| Onion | 3.187 | 22.356 | 1 | 25.544 | 967.140 |
| Green bean | 1.118 | 13.028 | 6.702 | 20.848 | 246.680 |
| Cucumber | 51 | 2.203 | 3.584 | 5.838 | 375.827 |
| Strawberry-strawberry | 194 | 1.472 | 7.214 | 8.880 | 231.233 |
| Cauliflower | 336 | 16.470 | 40 | 16.846 | 358.386 |
As mentioned, the Common Market Organization (CMO) for processed fruit and vegetables includes a Community tomato production threshold for processing, which is further divided into national thresholds among the Member States. Other vegetables are not subject to any quantitative limitations under the CMO (except for withdrawal restrictions), which, as is well known, is based on the active role of Producer Organizations in adapting to the market, with the support of the corresponding operational funds.
Therefore, the problem of expanding irrigated land for vegetables depends on the relative efficiency and capacity for expansion in EU markets. With early export crops, which are generally grown under protected irrigation, considerable caution is necessary, as the market is very sensitive and does not readily accept significant increases. Furthermore, it must be considered that this type of production can have environmental problems. There is some room for expansion by displacing products from other countries (Member States or third countries), but it is important to be aware that a fierce price war could also drag down a portion of less efficient domestic production.
There is also room for expansion in less intensive horticultural products, based on greater distribution efficiency and potential price reductions resulting from productivity improvements. For some products, a more established and consolidated food industry than currently exists will be necessary.
The opening of markets is inevitable and some third countries occupy market niches where they can harm national and community production (such as garlic) but the new CMO model should allow us to deal with these situations on the basis of the quality, safety and stability of community supply.
In short, it is a sector where there is a certain margin for increasing surface area.
Non-citrus fruit trees
Community apple production reached 7.2 million tons in the 1997/98 season, pear production reached 1.96 million tons, peach production 2.6 million tons, and nectarines 628,000 tons. Table grape production reached 2.2 million tons in the 1998 season.
During the 1998/99 season, approximately 480,000 tons of peaches were processed in the region into preserves in syrup or natural juice. The region continues to be an exporter of this product (113,000 tons in 1998).
Community production of Williams and Rocha pears, processed into preserves in syrup or fresh, exceeded 162,000 tons in the 1998/99 season. Italy remains the leading EU producer (491,000 tons of the total), ahead of Spain (311,000 tons) and France (151,000 tons). The Community has a trade deficit in this product; in 1998, exports amounted to 5,000 tons of finished product compared to 33,000 tons imported.
According to the MAPA Statistical Yearbook, the distribution of the main fruit trees in this group is as follows:
| CROP | SURFACE (Ha) | Scattered trees | PRODUCTION (tons) | ||
|---|---|---|---|---|---|
| Dry land | Irrigation | Total | |||
| Apple tree | 11.899 | 37.474 | 49.373 | 2.924.571 | 899.356 |
| pear tree | 1.070 | 38.321 | 39.391 | 1.433.076 | 665.336 |
| Others | 125 | 3.937 | 4.062 | 398.466 | 50.359 |
| F. PEPITA | 13.094 | 79.732 | 92.826 | 4.756.113 | 1.615.051 |
| Apricot | 6.111 | 18.871 | 24.982 | 229.423 | 197.870 |
| cherry and sour cherry | 20.270 | 7.280 | 27.550 | 849.101 | 76.029 |
| Peach tree | 7.399 | 63.872 | 71.271 | 797.444 | 869.716 |
| plum tree | 7.849 | 12.481 | 20.330 | 880.385 | 147.015 |
| F. BONE | 41.629 | 102.504 | 144.133 | 2.756.353 | 1.290.630 |
| Other fleshy fruits | 20.569 | 28.889 | 49.458 | 1.449.580 | 541.287 |
| TOTAL F. Non-citrus | 75.292 | 211.125 | 286.714 | 8.962.046 | 3.446.968 |
The Common Market Organisation (CMO) for fresh fruit and vegetables does not establish any limitations, except those derived from the mechanisms regulating withdrawals by Producer Organisations. The CMO for processed fruit and vegetables grants aid to certain industrial products (peaches in syrup, Williams and Rocha pears in syrup, dried figs, raisins, Ente plums), of which peaches and pears, as already mentioned, have Community thresholds above which aid is penalized.
In any case, the problem with expanding irrigation for these crops is not the limitations on withdrawals or these specific subsidies, but rather market opportunities. In this respect, pome fruits (mainly apples) face a negative outlook due to the difficulty of competing with off-season imports from the Southern Hemisphere (Argentina, Chile), which shorten the cold storage marketing period for EU production.
Stone fruits (peaches, apricots, cherries, plums, etc.) should not fear this competition as much due to conservation and transport problems, and in such a situation Spanish production may be well positioned for slight increases in production in competition with community production.
Finally, in the group of fleshy fruits (cherimoya, avocado, kiwi, persimmon, etc.) there is a possibility of expansion in the market even though there may be problems of competition with third countries.
Overall, the sector may have some potential for increased irrigated land, all of which, as in all cases, is contingent upon technically well-managed investments and marketing efforts.
Citrus fruits
Global citrus production reached 93.2 million tons in the 1998/99 season. The European Community, with a production of almost 9.3 million tons, ranks third worldwide, behind Brazil (20.6 million tons) and the United States (12.6 million tons) and ahead of China (9.1 million tons) and Mexico (5.1 million tons). As for exports, international trade accounted for 10.41% of global citrus production.
Community production of oranges reached 5.3 million tons and that of lemons 1.5 million tons. Spain remains the largest European producer with 541 million tons of production in 1998/99.
Citrus production in Spain is approximately 4.5 million tons, distributed as follows:
| CROP | SURFACE (Ha) | YIELD (Kg/ha) | PRODUCTION (t) |
|---|---|---|---|
| sweet oranges | 133.793 | 17.995 | 2.200.766 |
| bitter oranges | 692 | 18.384 | 12.747 |
| Tangerines | 97.072 | 18.149 | 1.503.772 |
| Lemons | 42.644 | 11.308 | 713.200 |
| Grapefruits | 992 | 22.751 | 20.280 |
| Others | 478 | 10.445 | 4.846 |
| TOTAL | 275.671 | – | 4.455.611 |
For this subsector, the Common Market Organization (CMO) for fresh fruit and vegetables generally regulates the maximum withdrawal volume, which also applies to citrus fruits. As previously mentioned, the special regulation for citrus fruits establishes certain aid for processed citrus-based products, linked to the payment of a minimum price to the farmer and with maximum thresholds beyond which a penalty is applied to the aid, calculated as a percentage of the amount exceeded.
Regarding the industrialization of citrus fruits, and especially the volume of orange juice, it must be considered that European production will never be able to compete with concentrated juice produced from specialized plantations in Brazil or Florida. Conversely, an interesting market segment for high-quality, chilled fresh juice is now emerging, where EU production has objective advantages in terms of supply, transport, and distribution. In any case, Spanish citrus production is geared towards the fresh market, and processing should always be considered a complementary activity to that market.
Regarding the fresh produce market, there are both positive and negative factors influencing its future development. Among the negative factors are the relative saturation of traditional European markets; the consolidation of imports from third countries in the Southern Hemisphere (South Africa), which will shorten the marketing period for EU production; the political necessity of facilitating trade for countries in the Mediterranean basin (Morocco, Israel); and the relative consumer trend toward rejecting oranges and replacing them, if at all, with easy-peel citrus fruits.
On the other hand, and as positive elements, one can consider the consumption potential of the CECO countries (without the possibility of placing restrictions on EU imports once integrated) and of the other Eastern European countries; the displacement of Italian and Greek production in other EU countries, which makes us more competitive; and even the consolidation of Spanish oranges in the Italian market.
The Spanish citrus sector has historically been characterized by its ability to adapt to the market, making the necessary varietal adjustments. However, the problem of tristeza (a disease affecting citrus fruits) and the need to improve competitiveness, especially by reducing production costs, must be addressed. Based on this challenge, which seems achievable, a relative increase in planted area and production is possible.
Nuts
The situation in Spain regarding the main nuts, according to the MAPA Yearbook, which may involve some statistical inertia, is as follows:
| Crop | Area (ha) | Scattered trees | Production (t) | ||
|---|---|---|---|---|---|
| Dry land | Irrigation | Total | |||
| Almond | 594.554 | 42.994 | 637.548 | 2.743.000 | 242.300 |
| Hazel | 14.464 | 14.972 | 29.436 | 419.000 | 21.252 |
| Walnut | 1.780 | 1.216 | 2.996 | 473.000 | 10.059 |
Starting with the 1989/90 season, as a result of Spain's entry into the EU and the lack of protection against imports from third countries, especially almonds from California and hazelnuts from Turkey, a program of action to improve community production was launched, through the corresponding farmers' associations, in order to encourage the modernization of plantations and their adaptation to market demands, with a duration of 10 years (recently extended to 11 years) from the approval of each Plan, and which in Spain currently covers some 433,000 ha.
Despite this aid, competition with imported products is difficult and there is uncertainty about what will happen when the corresponding Plans end (possibility of replacement by other Plans within the framework of environmental actions).
In any case, it seems proven that new irrigated plantations of almonds, walnuts, pistachios and hazelnuts, well designed and managed and with adequate marketing conditions, can compete with imported products, and therefore, and regardless of the uncertain future of dryland plantations and existing aid schemes, there is room for new irrigated areas.
Potato
The Common Agricultural Policy (CAP) does not include regulations or Common Market Organisations (CMOs) for table potatoes. The measures that exist for potato starch are currently not applicable to Spanish production, either due to the regulations themselves or issues of production efficiency.
With a total cultivated area of almost 1,400,000 hectares, the Community produces around 48 million tons. The European Union is self-sufficient in potatoes, except for early varieties, which are imported from Mediterranean countries in winter and early spring, when EU potato production is limited or nonexistent. The main suppliers are Cyprus, Egypt, Morocco, and Israel. In recent years, an average of 400,000 tons of early potatoes have been imported annually from third countries, while just over 825 million tons have been exported within Europe.
Potatoes, especially in Spain, experience large year-to-year variations in area and production as a result of the lack of regulation and the cyclical effect of prices.
| CROP | SURFACE (ha) | YIELD (kg/ha) | PRODUCTION (t) | |||
|---|---|---|---|---|---|---|
| Dry land | Irrigation | Total | Dry land | Irrigation | ||
| extra-early P. | 949 | 3.312 | 4.261 | 9.624 | 16.468 | 63.674 |
| early p. | 10.088 | 20.498 | 30.586 | 12.919 | 22.579 | 593.151 |
| P. mid-season | 48.392 | 50.452 | 98.844 | 16.285 | 25.503 | 2.074.765 |
| Late postpartum | 15.808 | 30.567 | 46.375 | 16.420 | 28.284 | 1.124.118 |
| TOTAL | 75.237 | 104.829 | 180.066 | 15.776 | 25.459 | 3.855.708 |
In the 1970s, Spain had as many as 400,000 hectares of potato cultivation. This decline has been caused, on the one hand, by the loss of its export position for extra-early and early potatoes due to greater competitiveness from other Mediterranean countries (Cyprus, Egypt), and on the other hand, since joining the EU, by potato imports from other, more competitive EU member states. (Spain's average yield is approximately 21 tons/hectare, while the EU average is 31.5 tons/hectare.).
Consolidating the current production situation in Spain depends on improvements in marketing and the varieties used, as well as cost reductions and increased yields, which could be partially achieved through improved irrigation. Consequently, no increase in the area dedicated to this crop is expected, and a slight reduction may even be observed.
flowers and plants
The Common Market Organization for the live plants and floriculture products sector is limited to defining quality standards and offering very partial protection against imports from third countries.
This lack of protection is exacerbated by the numerous concessions made under the Mediterranean Agreements or the Generalized System of Preferences (GSP), to the point that the EU launched in 1996 a community scheme for financing specific measures aimed at promoting the consumption of live plants and floriculture products.
The Spanish sector is relatively small, as can be seen from the latest available figures:
| CROPS | SURFACE (areas) | PRODUCTION (thousands dozens) | |||
|---|---|---|---|---|---|
| Dry land | Irrigation | Total | |||
| Fresh air | Protected | ||||
| Carnation | 2.085 | 16.783 | 110.832 | 129.700 | 178.581 |
| Pink | 920 | 5.537 | 40.093 | 46.550 | 39.803 |
| Other flowers | 4.510 | 49.027 | 41.123 | 94.660 | 45.429 |
| TOTAL Flowers | 7.515 | 71.347 | 192.048 | 270.910 | 263.813 |
| Ornamental plants | 6.800 | 121.594 | 72.738 | 201.132 | 100.461 |
Although these figures are modest, and the Spanish production schedule is competitive with that of some third-party countries, they represent figures with clear possibilities for expansion if the sector addresses its internal structural limitations (organization of producers, marketing channels, genetic material, etc.).
3.5.8 Rice
BASIC CHARACTERISTICS OF THE CMO.
The Community's rice sector regulations were reformed in 1995 (Regulation (EC) No 3072/95), following the same guidelines as the 1992 CAP reform for arable crops. The CMO for rice is based on the following mechanisms:
a) A system of intervention prices, predetermined for the 1996/97 campaigns onwards, for a standard quality. The marketing campaign runs from September 1 to August 31 of the following year. The intervention prices are subject to monthly increases between April 1 and July 31.
National intervention agencies will purchase, from April 1 to July 31, the quantities of paddy rice offered to them at the intervention price, provided that certain conditions are met; the intervention price is adjusted according to the quality of the product offered.
In the 1995 reform, it was agreed to reduce the intervention price by 151% between the 1996/97 and 1999/00 seasons and subsequent seasons. In exchange, direct payments of €52.65 per hectare per tonne were established. This amount is multiplied by the national average yield to obtain the compensatory payment per hectare. In Spain, the compensatory payment amount is €334.33 per hectare for the 1999/00 season and subsequent seasons.
A national base area is established for each producing Member State (in Spain: 104,973 hectares). If, during a given year, the area dedicated to rice cultivation exceeds this national base area, a reduction in the compensatory payment is applied to all producers for that same year. The penalty can reach up to six times the percentage by which the area exceeds the base area if it is greater than 51% of the total.
b) A system of trade with third countries, framed within the commitments acquired in the Uruguay Round negotiations of the GATT. From a management perspective, both exports and imports are subject to the presentation of the corresponding certificates.
Imports are subject to a tariff based on a maximum import price, after duties are paid, and linked to the intervention price. Current and minimum access commitments are met through preferential imports, with zero or very low duties, under the various bilateral agreements to which the EU is a party. As for exports, the GATT commitment limits refunds to 133,400 tons per year.
The border protection system derived from the GATT, along with new trade concessions, has left the EU rice-producing sector largely unprotected in practice. The increase in imports from third countries, including shipments through the special regime for OTCs (Overseas Countries and Territories), is the main cause of the current surplus in the EU rice market.
In June 2000, the Commission presented a proposal to reform the Common Market Organisation (CMO) for rice, justified by the need to restore balance to the Community market. To simplify CAP mechanisms and facilitate crop rotation, rice would also be included under the arable crops scheme. The basic elements of the reform would be:
- the increase in direct aid to producers, from 52.65 to 63 euros/tonne (which is the aid planned for cereals in Agenda 2000 from 2001/02);
- and the elimination of the intervention mechanism, with the possibility of resorting to private storage.
Eliminating the intervention regime would mean ceasing to apply the current system for determining import duties, which is linked to the intervention price. Instead, the fixed tariff regime established in the Uruguay Round would be applied.
The proposal advocates for maintaining rice cultivation in certain areas where it is beneficial to the environment. To this end, Member States must submit a report to the Commission by December 2003 on the environmental status of rice production, with particular reference to traditional growing areas and the effects of environmental protection measures adopted.
The Commission believes this reform should come into effect as soon as possible, ideally in the 2001/02 season. However, the proposal has met with opposition from European producers, particularly in Italy and Spain. There are fears that eliminating the intervention system will lead to a drastic drop in prices, greater than the impact of the price increases.
Furthermore, as with sugar, there are concerns about the effect of the "everything but arms" trade liberalization agreement, which will grant tariff-free access to the EU market for all products except weapons from the world's 48 poorest countries. In the case of rice, liberalization will take place gradually between 2006 and 2009.
In any case, the approval of the reform, planned for the Swedish presidency in the first half of 2001, has suffered an obvious delay.
PRODUCTIVE SECTOR
EU rice production is approximately 2.6 million tons (1996-1998). Spain is the second largest rice producer in the EU after Italy (which produces 521 million tons, compared to Spain's 301 million tons), followed by Greece, Portugal, and France. The average EU yield is 6,400 kg/ha, ranging from 8,000 kg/ha in Greece to 6,000 kg/ha in France or Italy.
Traditionally, and in accordance with culinary customs, Spain and Italy have primarily produced Japonica rice (short and medium grain), while northern countries tend to consume more Indica rice (long grain). In recent years, Indica rice production has followed an upward trend; in Spain, it now accounts for approximately 501,300 tons of the cultivated area.
Once the 1994/95 drought was over, the area under rice cultivation in Spain recovered, reaching 113,000 hectares in recent seasons, with an average yield of around 6,700 kg/ha. The average production for the three-year period 1997-1999 was around 800,000 tons.
The main production areas are concentrated in Seville, Valencia, Tarragona, and Badajoz, as well as the banks of the Ebro River. The cultivated areas are located in environmentally sensitive zones, but traditionally integrated into wetland ecosystems (Ebro Delta, Albufera of Valencia, Guadalquivir Delta, etc.).
MARKETS
Over 901,300 metric tons of the world's rice volume is produced in Asia (China, India, and Southeast Asian countries); other major producers include Brazil, the USA, and Egypt. EU rice production accounts for only 0.51,300 metric tons of the global total.
The world's main rice-producing regions are often the same as the main consuming regions, so only a very small portion of the world's rice enters international trade. Rice is a staple food for a large part of the global population, which explains why its market is so heavily regulated (price fixing, government-controlled trade, distribution through government programs, food aid, etc.).
Globally, the EU has a rice deficit, although it is a net importer of indica rice and a net exporter of japonica rice. Within the EU, the largest importers are the United Kingdom, France, and Germany. The EU market is primarily supplied with indica rice from ACP (Africa, Caribbean, Pacific) countries under preferential conditions.
Over the past few years, the EU rice market has faced a serious imbalance due, on the one hand, to the increase in preferential imports and the limitations on subsidized exports imposed by GATT commitments. On the other hand, EU rice production has recovered, with a particular increase in indica rice production. This has resulted in an accumulation of intervention stocks which, at the beginning of the 1999/2000 marketing year, amounted to more than 300,000 tonnes of milled rice (representing approximately 201% of domestic production).
Spain's foreign trade in rice is quite active, with EU countries being the main sources and destinations. Spain is a net importer of rice, although the trade balance reflects differences between varieties and processing levels. On the one hand, Spain imports Indica rice and exports Japonica rice. On the other hand, Spain is a net importer of paddy rice, originating from Greece, Italy, France, and the USA; but it is a net exporter of cargo rice, which is mainly shipped to the Benelux countries; and it is also a net exporter of milled and broken rice, although considerable quantities are also imported from Italy.
PERSPECTIVES FOR IRRIGATION
The strongly surplused conditions of the European market and the prospect of further trade liberalization make any increase in production inadvisable.
Furthermore, there is no room for increasing irrigated land, as it would be very difficult to compete in the markets with penalties on the order of 30%. It should be noted that the base area of 104,000 hectares has been exceeded since 1996. The latest provisional figures for cultivated areas in 1999 and 2000 are 112,000 and 115,000 hectares, respectively.
Global data masks certain movements of new crop establishment in some areas of the Ebro valley, while some traditional areas could face continuity problems in the future, due to environmental issues or competition with other land uses, including non-agricultural ones (such as tourism or urban expansion).
In short, an increase in national rice production is not advisable, so new irrigated areas should not be dedicated to this crop and other actions to improve existing irrigation systems must be linked to environmental considerations (maintenance of wetlands, conservation of specific ecosystems, etc.).
3.5.9 Forages
BASIC CHARACTERISTICS OF THE CMO.
Regulation (EC) No 603/95, which establishes the Common Market Organization (CMO) for dried fodder, sets out a system based on granting processing companies a lump-sum payment for dried fodder. The payment is set at €68.83/tonne for dehydrated fodder and €38.64/tonne for sun-dried fodder.
The aid is set for the campaign, which runs from April 1st to March 31st of the following year. To receive the aid, the forage must meet certain quality standards and minimum moisture and crude protein content requirements.
The protection is limited to a maximum guaranteed quantity (MGQ) of 4,412,400 tonnes for dehydrated products and 443,500 tonnes for sun-dried products. This quantity is distributed among the EU Member States, based on the average production of 1992/93 and 1993/94, resulting in the corresponding national guaranteed quantity (NGQ); in Spain: 1,224,000 tonnes of dehydrated products and 101,000 tonnes of sun-dried products.
If the Community's minimum production target (MPT) is exceeded by up to 5%, a proportional reduction in aid is applied to all Community producers in the same marketing year. If the excess exceeds 5%, additional reductions are made in the Member State that exceeds its MPT. The penalty is set at a level that guarantees the budgetary neutrality of the sector.
PRODUCTIVE SECTOR
Forage crops in Spain cover an area of over 1.18 million hectares, with a presence in practically the entire country. Forage crops include a wide variety of varieties which, according to the latest Statistical Yearbook of the Ministry of Agriculture, Fisheries and Food (MAPA) (2000), are distributed among the following groups and areas:
| Data 1996 | Harvested (hectares) | Pasture only (hectares) | Total | ||
|---|---|---|---|---|---|
| Dry land | Irrigation | Dry land | Irrigation | ||
| Grasses | 419.062 | 58.541 | 2.748 | 308 | 480.659 |
| Legumes | 165.049 | 187.927 | 26.432 | 1.182 | 380.590 |
| Roots and tubers | 200.621 | 47.049 | 48.224 | 10.992 | 306.886 |
| Various forages | 13.842 | 3.471 | – | – | 17.313 |
| Total | 798.574 | 296.988 | 77.404 | 12.482 | 1.185.448 |
Within the forage crops and apart from the grasses that are included in the analysis of cereals (winter cereals and corn for forage), the most important group is that of legumes and, especially, alfalfa and vetch.
The cultivated area of alfalfa exceeds 230,000 hectares (approximately 201% of the total forage area). The average green yield is around 20,000 kg/ha in dryland conditions and 58,000 kg/ha in irrigated conditions, and shows considerable variability between provinces.
Production reaches 11-12 million tons annually. The primary uses of alfalfa production, in order of importance, are dehydration (over 501,000 tons), haymaking (371,000 tons), green fodder (121,000 tons), and silage. Each year, artificially dehydrated forages are gaining ground over sun-dried ones. Forage dehydration plants are located almost exclusively in the Ebro Valley.
Alfalfa-producing areas do not exactly coincide with the main consuming areas, which has partly contributed to the development of the Spanish forage dehydration industry. Domestic demand for dehydrated forage from livestock farming areas (Cantabrian coast) is heavily influenced by the climatic year and the availability of green forage.
As for the other major forage legume, vetch, it is cultivated on approximately 70,000 hectares, with an average yield of nearly 13,000 kg/ha under dryland conditions and 30,000 kg/ha under irrigation. Production ranges from 1 to 1.5 million tons, which is primarily used for haymaking.
MARKETS
The EU meat industry is a major consumer of plant-based protein, which is mostly obtained from imported soybeans, primarily from the US, Brazil, and Argentina. Alfalfa, along with peas, broad beans, lupins, and vetch, is one of the few sources of plant-based protein cultivated in the EU, while soybean cultivation is only significant in Italy and France. The subsidy scheme for dried alfalfa allows EU production to be competitive with alternative products, especially soybeans. Within the EU, Spain is the leading producer, followed by France, Italy, and Germany.
Spain has an active presence in the dried fodder trade. Our main customers and fodder suppliers are the other EU member states.
PERSPECTIVES FOR IRRIGATION
- Common Market Organization (CMO) of herbaceous crops, which affects forage maize and silage cereals.
The reform of the CAP of Agenda 2000 consolidated the inclusion of forage maize in the CMO of herbaceous crops, with the possibility that in countries where there was no tradition of silage maize, silage grass could be incorporated into the aid scheme (without increasing the total base area) and with the application for the purposes of the aid of the basic yields of the aid.
The surface area limitation imposed by the Common Market Organization (CMO) is relative, since it does not preclude, in the medium and long term, a degree of flexibility in the redistribution of dryland and irrigated areas, as well as an adjustment of regional yields. This would allow, for reasons of territorial balance or population maintenance, the allocation of new areas to irrigated cereal/forage maize cultivation.
Also, despite the limited land area and the fact that cereals are in surplus globally in the EU, it is possible that, through cost reductions, domestic production could become competitive in the EU's internal market, in certain areas, at certain times, and for certain quality levels. A moderate increase in irrigation could contribute to this reduction in production costs and to protecting farmers' incomes, provided it is complemented by improvements in other structural factors related to production, distribution, and marketing.
The limitations of the CMO and market derived from an increase in area and production may be reasonably assimilated.
- CMO of dried forage products, which includes alfalfa, sainfoin, clover, lupins, vetch, grass peas and other similar products.
The production of alfalfa and other forage legumes intended for drying is limited by the CNG and the reduction in aid as a consequence of exceeding it, which establishes a self-limitation from the sector itself and, above all, from the drying industry.
However, it should be noted that the penalty system, which is not cumulative as it guarantees the absorption of the entire corresponding budgetary financial base, would allow for the consolidation of higher figures for Spanish production. Furthermore, given that the first 5% exceedance of the CMG is a matter of shared responsibility at the EU level, the penalty on aid can, in many cases, be manageable for the producer.
Furthermore, and independently of the CMO aid for dried fodder, fodder crops can be used as a surface basis to access livestock premiums linked to stocking densities per hectare, and this not only in terms of CAP aid, but also in terms of the rationality of livestock farms.
It would also be possible to increase production in irrigated areas of other surfaces intended for animal feed and not included in the community scheme for dried fodder, such as natural meadows and pastures.
Therefore, it can be stated that there is reasonable room for expansion of irrigated forage crop cultivation in Spain. Furthermore, Spain has very favorable natural conditions, especially climate, for the production of forage legumes, as well as significant expertise in the dehydration industry.
This expansion would be all the more positive in the current context of the livestock sector following the BSE crisis. In fact, the ban on using animal meal as a protein source in animal feed could represent an opportunity to increase forage production, especially of alfalfa and other legumes, which have been traditional crops in large inland areas of the Iberian Peninsula. This opens the possibility of allocating new irrigated land to these crops, provided they are economically viable.
In March 2001, the Commission presented a report on plant protein production in light of the ban on the use of animal meal in animal feed. The report analyzes the possibilities for increasing Community production of plant protein within two to five years by promoting the production of oilseeds and protein crops, authorizing the cultivation of protein-rich crops on land withdrawn from cultivation, and promoting the production of dried fodder, increasing the maximum guaranteed quantity, for example, by 101 TP3T, and reducing aid by 51 TP3T.
In the main alfalfa-producing countries of the EU, calls are already being made to the Commission to increase the maximum guaranteed quantities of dried fodder to meet the new demand for plant protein. Whether or not the maximum guaranteed quantities are increased, this would be a good opportunity to strengthen the EU's sector of plant protein production for animal feed, given the aggressive strategy that the US has pursued in this area, particularly in the soybean sector, within the GATT.
The attached map provides an overview of irrigated crops, in terms of the percentage of cultivated area relative to the reference areas.
* * *
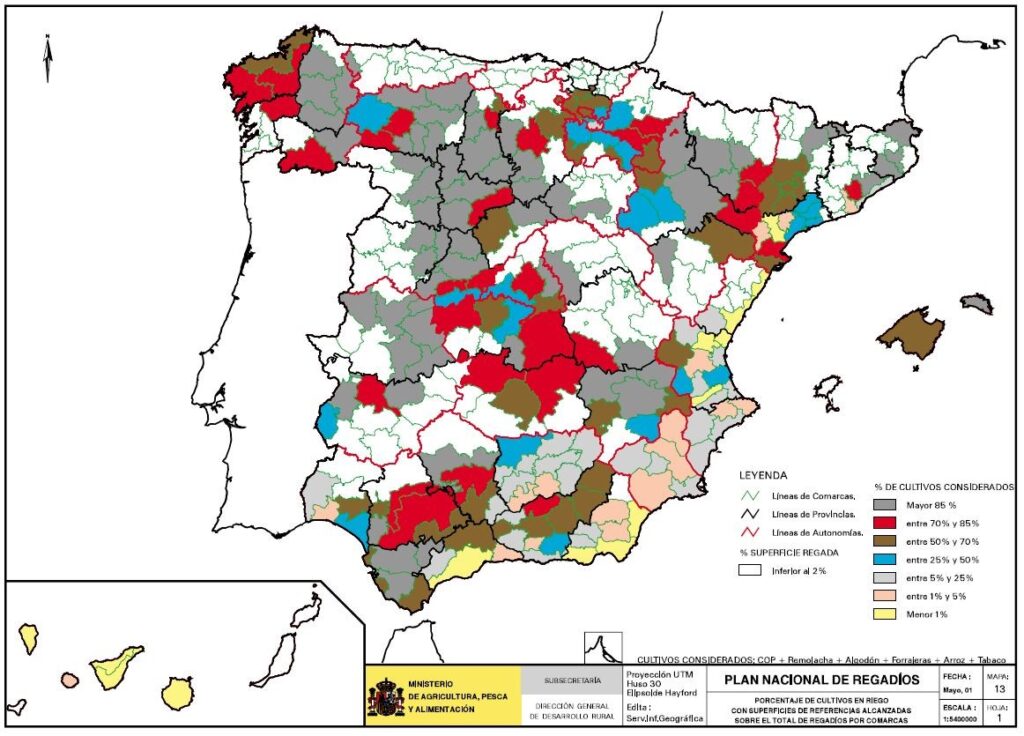
3.6 The food industry
3.6.1 Importance of the Spanish food industry
The food industry (FI) has a considerable weight in the context of Spanish industry, both as a demander of raw materials from the agricultural sector and as a generator of employment and added value, which can be deduced from the comparison of the corresponding macroeconomic magnitudes.
| Macroeconomic magnitudes (1999) | AI | AI/Total industry |
|---|---|---|
| Value of production | 9.1 billion pesetas | 17,7% |
| Busy people | 376,364 workers | 14,5% |
| Consumption of raw materials | 5.3 billion pesetas | 22,3% |
| Added value generated | 2.3 billion pesetas | 12,9% |
| EU market share | 5% EU market | 61,8% (*) |
| Number of companies | 33.105 | 20,1% |
| Number of establishments | 36.970 | 14,2% |
agrarian in community trade.
Source: General Directorate of Food. MAPA.
The production index of the Spanish food industry grew by 8.81% during the period 1995-1999, representing an average annual growth rate of 2.21%. Spain's contribution to the European food industry is 10.91% of value added and 14.61% of employment.
The sector's employment capacity remains high, with the investment-to-jobs-created ratio being more favorable than in industry as a whole. It is estimated that the investments required to create these jobs are becoming increasingly comparable, thanks to modernization and capitalization efforts in the agri-food sector.
As of December 31, 1999, the food industries employed a total of 376,364 workers, which represented 14.51% of the total national industry.
Regarding foreign trade, exports from the food industries amounted to 1.267 trillion pesetas and imports to 1.304 trillion pesetas, with a balance of -37 billion pesetas and a coverage rate of 97.1%.
3.6.2 Sector Characteristics
The food industry, with a share of 17.71% of total national industrial production, is the most important sector, although its added value is lower than that of the energy sector.
Upon joining the EU, the Spanish agri-food system became part of the world's leading group of agri-food companies and the main producer and consumer of products from agricultural innovations. Following accession, the processes of concentration and internationalization within the sector intensified, driven by the influx of foreign capital aimed primarily at controlling marketing channels and acquiring market share in the domestic market. Despite this evolution, the sector's structure remains highly fragmented. Of the 33,105 agri-food companies registered on January 1, 2000, 97.11% employed fewer than 50 people (small businesses), while only 0.61% had more than 200 employees (large businesses), and the remaining 2.31% were medium-sized businesses. The following types of companies can be distinguished:
- Small, family-owned businesses.
- Intermediate companies that generally originate from family businesses and that, in some cases, maintain that character or have evolved into corporate forms.
- Multinational companies that have entered the Spanish market through the establishment of subsidiaries or by purchasing majority stakes in national companies.
While the Spanish cooperative movement is not as large as in some other European countries, it has achieved significant success in processing and marketing. Producer organizations have also played a leading role in shaping the fresh fruit and vegetable markets.
3.6.3 Sectoral distribution
The following table shows the number of food companies by subsector and the change in the number of companies during the period 1995-1998. A breakdown by subsector is not available for 1999. During this year, there was a reduction of 763 companies, representing a decrease of approximately 21% compared to 1998, continuing the trend of recent years of adjustment and rebalancing in the sector to mitigate the high degree of fragmentation that characterizes it.
NNumber of companies in the food industry by subsectors (1995/1998)
| Indicators | Years | Variations (%) | |
|---|---|---|---|
| 1995 | 1998 | ||
| Meat products | 4.326 | 4.328 | 0,0 |
| Dairy products | 1.604 | 1.511 | -5,8 |
| Transfer of fish | 708 | 742 | 4,8 |
| Animal Feed | 925 | 901 | -2,6 |
| Fats and oils | 1.602 | 1.576 | -1,6 |
| Transfer of Fruits and Vegetables | 1.498 | 1.476 | -1,5 |
| Milling | 1.275 | 1.013 | -20,5 |
| wines | 3.560 | 3.830 | 7,6 |
| Beer and Malt | 24 | 23 | -4,2 |
| Other Alcoholic Beverages | 820 | 563 | -31,3 |
| Water and Non-Alcoholic Beverages | 644 | 490 | -23,9 |
| Bread, Pastries and Cookies | 14.806 | 12.142 | -18,0 |
| Sugar, Chocolate and Confectionery | 1.193 | 1.109 | -7,0 |
| Various Products | 6.011 | 4.164 | -30,7 |
| Total Food Industry | 38.996 | 33.868 | –13,2 |
The following tables and graphs detail the turnover and employment of the food industry by subsectors.
NET SALES, PERSONNEL EXPENSES AND PEOPLE EMPLOYED IN THE DIFFERENT SUBSECTORS OF THE FOOD INDUSTRY AS OF DECEMBER 31, 1999
| Subsectors | Product net sales | Busy people | Personal expenses | |||
|---|---|---|---|---|---|---|
| Million pesetas | % | No. | % | Million pesetas | % | |
| Meat Industries | 1.654.577 | 18.11 | 65.073 | 17.29 | 193.445 | 15.74 |
| Fish Processing | 344.724 | 3.77 | 19.121 | 5.08 | 46.847 | 3.81 |
| Canned Fruits and Vegetables | 774.832 | 8.48 | 37.718 | 10.02 | 108.001 | 8.79 |
| Fats and oils | 814.350 | 8.91 | 13.133 | 3.49 | 44.923 | 3.65 |
| Dairy Industries | 1.018.123 | 11.14 | 27.745 | 7.37 | 118.563 | 9.64 |
| Milling Products | 327.659 | 3.59 | 7.371 | 1.96 | 28.654 | 2.33 |
| Animal Feed Products | 717.456 | 7.85 | 12.405 | 3.30 | 49.224 | 4.00 |
| Bread, Pastries and Cookies | 741.506 | 8.12 | 105.592 | 28.06 | 236.364 | 19.23 |
| Sugar | 157.256 | 1.72 | 2.931 | 0.78 | 15.870 | 1.29 |
| Cocoa and Chocolate | 289.289 | 3.17 | 16.247 | 4.32 | 55.084 | 4.48 |
| Other Miscellaneous Products | 465.428 | 5.09 | 22.964 | 6.10 | 93.509 | 7.61 |
| wines | 787.010 | 8.61 | 18.152 | 4.82 | 64.320 | 5.23 |
| Beer and Malt | 299.819 | 3.28 | 8.493 | 2.26 | 68.653 | 5.58 |
| Other Alcoholic Beverages | 184.032 | 2.01 | 5.215 | 1.39 | 26.231 | 2.13 |
| Water and Non-Alcoholic Beverages | 560.413 | 6.13 | 14.202 | 3.77 | 79.616 | 6.48 |
| Total Food Industry | 9.136.475 | 100.00 | 376.364 | 100.00 | 1.229.305 | 100.00 |
| Total Industry | 51.553.845 | 2.588.872 | 9.820.878 | |||
| Total AI/Total Industry (%) | 17,7 | 14,5 | 12,5 | |||
The slaughterhouse and meat processing sector is the most important, representing 18.11% of total food industry production. The dairy industry is the second largest, accounting for 11.14%, and the oils and fats sector is third (8.91%). Together, these sectors represent more than a third (38.21%) of total gross production, making them strategically important for the consolidation of the agri-food system.
The bakery, pastry and biscuit sector is the one that provides the greatest added value and employment.
3.6.4 Regional distribution of the food industry
The Autonomous Communities with the greatest weight in the sector are Catalonia and Andalusia, followed at a considerable distance by Castile and León, Valencia and Madrid, with the two most important location factors being expressed in this distribution:
- Proximity to large consumer centers.
- Proximity to raw material suppliers.
Regarding the importance of agriculture in relation to the industrial capacity of each Autonomous Community, the predominance of agricultural regions is evident. Thus, in Extremadura, 45.41% of its industrial output comes from agriculture, and in Andalusia, Murcia, and La Rioja, this figure exceeds 30.1%, while in the more industrialized regions, this ratio drops to 7.61% for the Basque Country and 10.11% for Madrid.
FOOD INDUSTRY PRODUCTION IN RELATION TO THE INDUSTRIAL SECTOR (YEAR 1999)
| Autonomous Communities | Gross production (millions of pesetas) | AI Weight (%) | |
|---|---|---|---|
| AI | Total sector | ||
| Andalusia | 1.369.142 | 4.292.407 | 31,9 |
| Aragon | 282.063 | 2.077.526 | 13,6 |
| Asturias | 185.824 | 1.063.794 | 17,5 |
| Balearics | 86.142 | 347.603 | 24,7 |
| Canary Islands | 177.561 | 689.373 | 25,8 |
| Cantabria | 101.003 | 643.030 | 15,7 |
| Castile and León | 851.600 | 3.496.185 | 24,4 |
| Castilla la Mancha | 581.341 | 1.938.061 | 30,0 |
| Catalonia | 2.211.779 | 13.320.380 | 16,6 |
| Estremadura | 161.331 | 355.187 | 45,4 |
| Galicia | 567.052 | 2.991.867 | 19,0 |
| Madrid | 626.313 | 6.191.024 | 10,1 |
| Murcia | 388.132 | 1.160.347 | 33,4 |
| Navarre | 235.346 | 1.641.864 | 14,3 |
| the Basque Country | 376.545 | 4.945.008 | 7,6 |
| Rioja | 221.655 | 579.682 | 38,2 |
| Valencian | 713.645 | 5.820.508 | 12,3 |
| Total Spain | 9.136.475 | 51.553.846 | 17,7 |
STRUCTURE OF THE FOOD INDUSTRY (YEAR 1999))
| Number of employees (%) | Gross Production (%) |
|---|---|
| 15.03 | 14.99 |
| 2.92 | 3.09 |
| 2.02 | 2.03 |
| 1.40 | 0.94 |
| 3.37 | 1.94 |
| 1.47 | 1.11 |
| 8.87 | 9.32 |
| 5.04 | 6.36 |
| 20.92 | 24.21 |
| 2.25 | 1.77 |
| 6.54 | 6.21 |
| 6.88 | 6.86 |
| 5.07 | 4.25 |
| 2.59 | 2.58 |
| 3.81 | 4.12 |
| 1.67 | 2.43 |
| 10.16 | 7.81 |
| 100,00 | 100,00 |
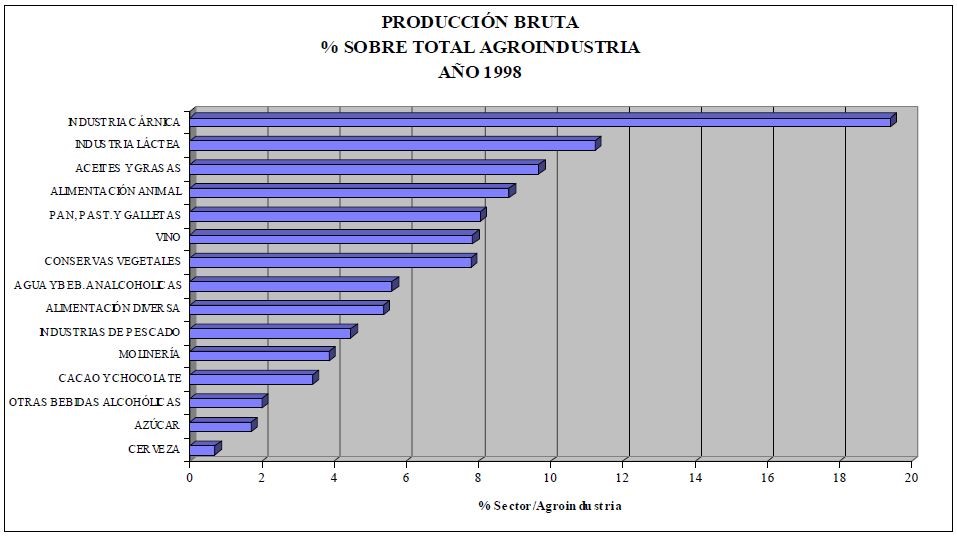
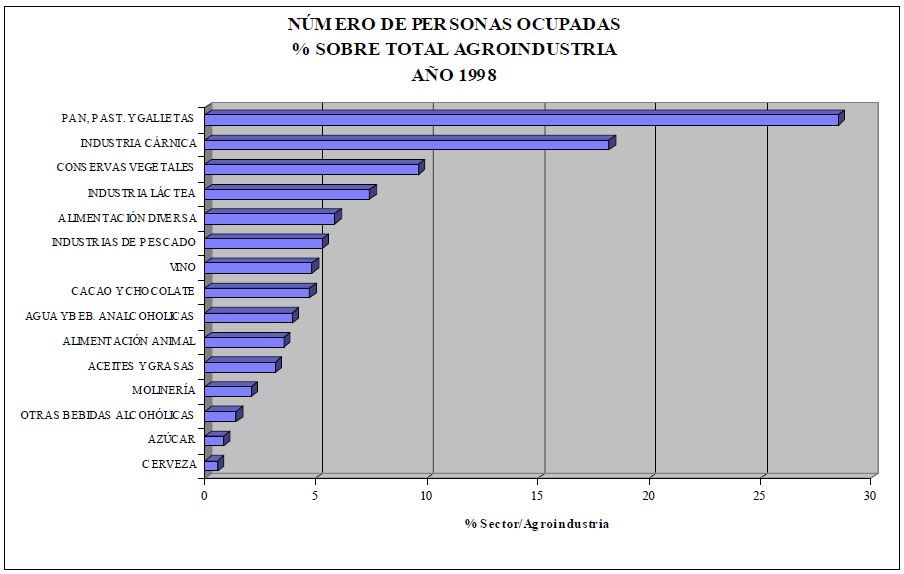
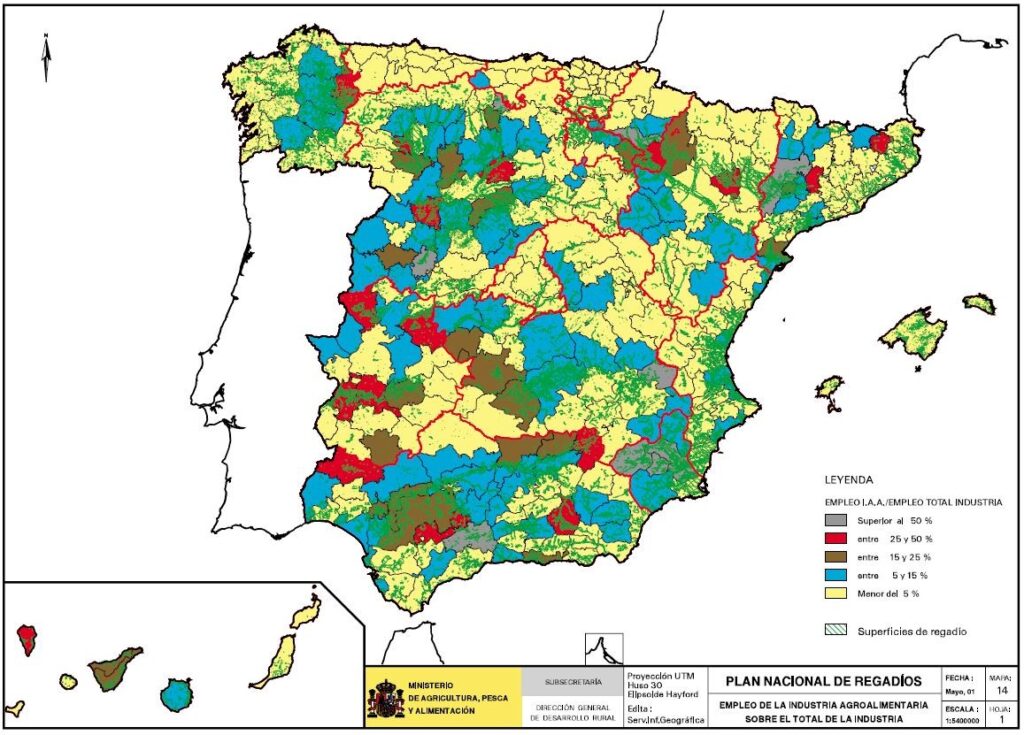
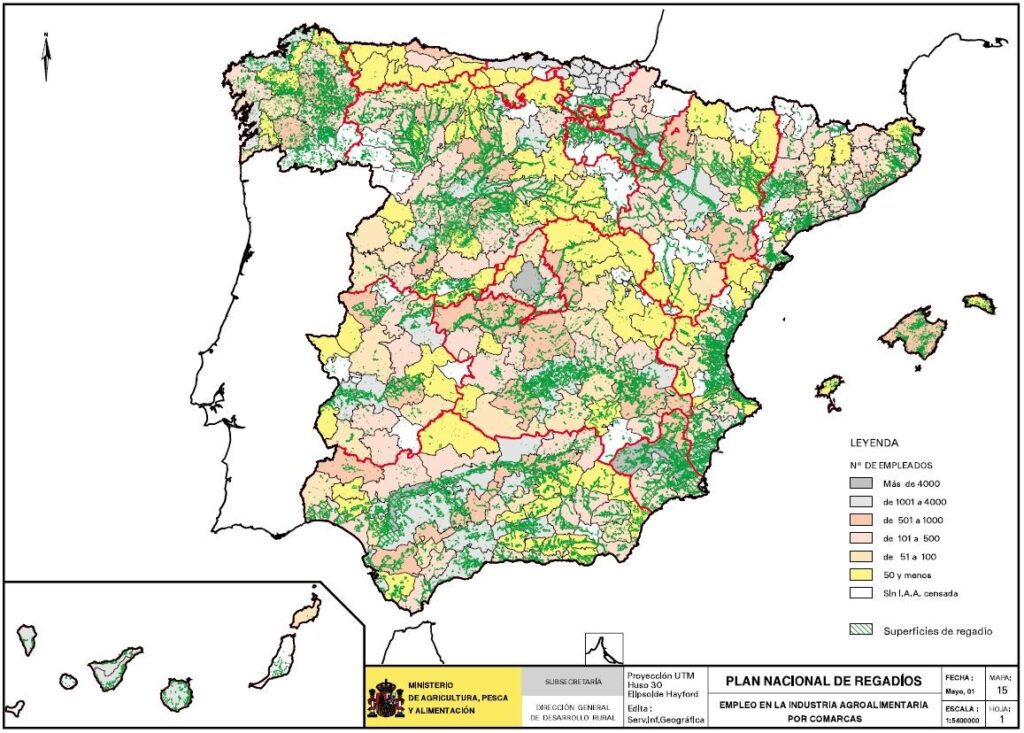
3.6.5 Characteristic features of the food industry
A detailed analysis of the agro-industrial sector allows us to identify the following fundamental characteristics:
- It is a basically counter-cyclical sector, with the observation that in times of economic prosperity it grows at a lower rate than the rest of the industry, while in times of crisis it behaves more stably.
- Its employment capacity is high, the multiplier effect of investment on
- The demand for labor is met by the least qualified categories, leading to a bottleneck in the development of productive potential.
- The administration has made a significant financial effort in vocational training, an investment that is still scarce and does not exceed the 50% average of EU countries.
- The gross value added of AI grows at a faster rate than the industrial system as a whole, although this growth is unevenly distributed among the different subsectors depending on technological innovation efforts, especially referring to the subsectors of dairy, cocoa, chocolate, confectionery and processed products (prepared and semi-prepared dishes).
- The meat industry group is divided into two distinct groups: the processing and preparation of meat products, which is growing in terms of added value, and the slaughter of animals, which is in sharp decline.
- The sectors with the most modern technology and the least diversification potential, oils and fats, sugars, milling and animal feed, remain stable in current terms.
- Labor costs in Spanish AI are lower than in the EU, but this advantage is offset by the fact that some components of the cost structure are worse compared to those in other EU countries.
3.7 Agricultural foreign trade
Analyzing agricultural foreign trade allows us to assess its contribution to the sector's own economy and to the national economy as a whole. It also allows us to evaluate the relative efficiency of the Spanish food system compared to that of other countries and to identify the most dynamic or competitive subsectors or production segments.
The summary table of the various trade balances shows clearly favorable balances and coverage rates for agricultural products intended for human or animal consumption, and within that category, for unprocessed foods. Conversely, non-food agricultural products (wood, hides, textile fibers) and processed food products have negative balances and low coverage rates.
bSPANISH TRADE ALLIANCE
| BALANCE | EXPORTS (billions of pesetas) | IMPORTS (billions of pesetas) | BALANCES (billions of pesetas) | COVERAGE RATE (%) |
|---|---|---|---|---|
| 1. Total | 17149.7 | 22606.3 | -5411.6 | 76.1 |
| 2. Agricultural and fishing | 2654.6 | 2694.3 | -39.7 | 98.5 |
| 3. Agrarian | 2393.7 | 2163.2 | 230.5 | 110.7 |
| 3.1. food agriculture | 2267.0 | 1883.4 | 383.6 | 120.4 |
| 3.2. Non-food agricultural | 126.7 | 279.8 | -153.1 | 45.3 |
| 4. Food fishing | 260.2 | 530.4 | -270.2 | 49.1 |
| 5. Total food (3.1.+4) | 2527.2 | 2413.8 | 113.4 | 104.7 |
| 5.1. Transformed Power | 1267.4 | 1304.7 | -37.3 | 97.1 |
| 5.2. Power Untransformed | 1259.8 | 1109.1 | 150.7 | 113.6 |
Since joining the EEC, Spanish agriculture has tended to become export-oriented. The percentage of final agricultural production destined for export has steadily increased over the last fifteen years. After remaining at around 301% during the 1987-1990 period, growth accelerated from 1991 onwards, and currently, exported production is more than double what it was in 1986.
The evolution of agricultural foreign trade also shows continued growth in the value of both imports and exports, with coverage ratios rising since 1992, coinciding with the end of the transitional period established in the Accession Act and the implementation of the Single Market. As a result of this trend, coverage ratios have been above 100% since 1996, reaching 120.71% in 1997.
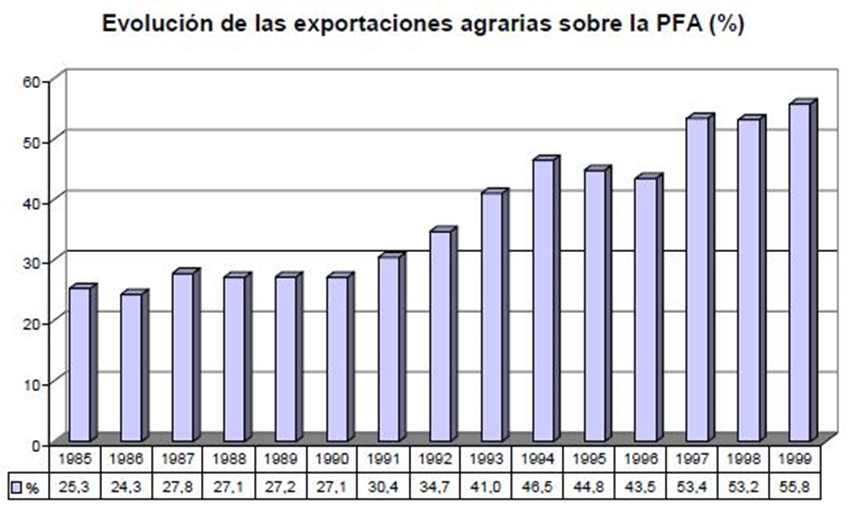
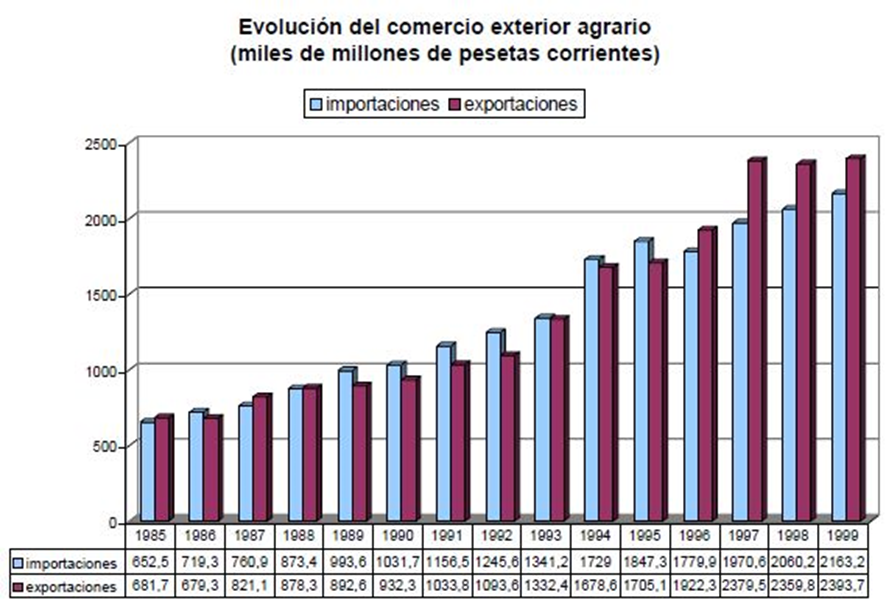
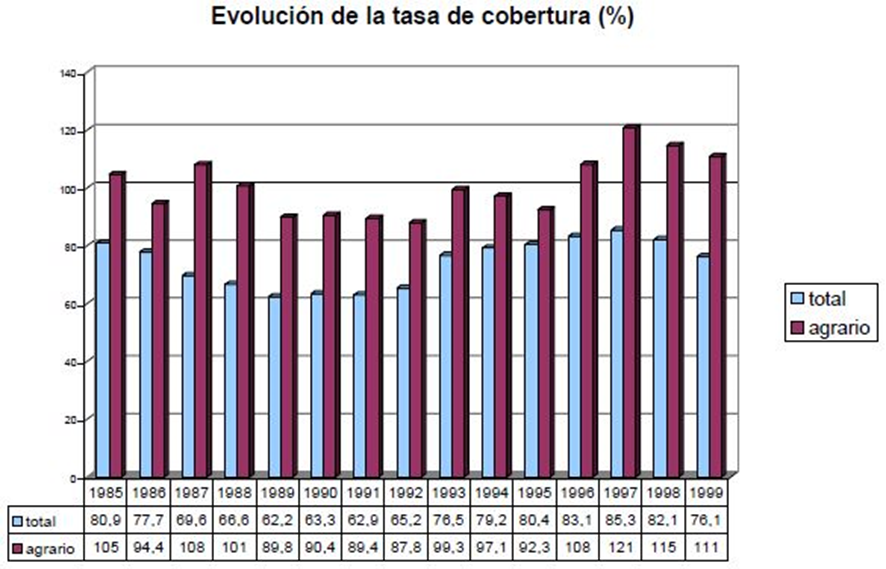
The relative importance of foreign trade in the agricultural sector, which represents 7% of GDP, means that agricultural exports represent 14% of total exports, while agricultural imports only represent 9.6% of total imports.
From a geographical perspective, it should be noted that intra-community trade in 1999 represented 78.64% and 59.9% of Spanish exports and imports respectively.
The most significant export products are fruits and vegetables, wine and olive oil, all of them Mediterranean products, and pork.
The most important imports are animal feed (mainly soybeans and corn), wood, cheeses, soft wheat and other products unrelated to European agriculture (coffee, cocoa, fats of tropical origin, etc.).
This summary of agricultural foreign trade highlights the competitive position of fruits and vegetables in international markets, including citrus fruits, wine, and olive oil. It also underscores the livestock sector's dependence on imports of animal feed and forestry products.
The imminent introduction of the euro as the single currency and the expansion of the EU are expected to boost intra-community trade, and future negotiations within the WTO will favor trade with third countries. All this market development will require strengthening the competitiveness of Spanish products, in some cases to maintain and consolidate their strong market position, and in others to capitalize on the production opportunities offered by this increased trade.
In a previous section, the market prospects in each sector and their impact on the actions and evolution of irrigation were analyzed in detail.
3.8 Environmental considerations affecting agriculture
The growing environmental awareness in society and the extensive body of regulations and legislation on this matter, both at the EU and national levels, mean that environmental factors have a significant influence on all economic development planning. Specifically, for irrigation planning, the protection of the natural environment will establish important limitations and conditions that must be considered in the development of the National Irrigation Plan (NRP).
3.8.1 Environmental policy of the European Union
In three decades, the environment has gone from being an almost marginal and idealistic concept to a practical and concrete necessity, felt by all of society today. This shift has been largely due to the widespread adoption of a model of accelerated and intensive development that has caused undesirable ecological problems, particularly in the 1980s.
As it became clear that this development model could endanger the continuity of life on the planet, it was increasingly challenged, and a new model emerged that questions the principles of indiscriminate economic growth and defends other values that focus more on respect for the environment, as a right of future generations.
The European Union, aware of this reality, has responded favorably to this new development model, considering it a challenge and incorporating it into all its regulations as an objective to be achieved. Although there is a history of EU concern for environmental issues (from the Stockholm Conference of 1972 to the Single European Act of 1986), it was the United Nations Conference on Environment and Development (1992) that saw all signatories of the Rio Declaration and the international conventions that emerged from it make a firm commitment to move towards what is known as Sustainable Development.
These commitments were immediately incorporated into Community legislation following the adoption of the Fifth Community Programme of Policy and Action on the Environment and Sustainable Development (1993). This Programme identified five priority sectors to which its provisions were specifically applied: agriculture, energy, transport, tourism, and industry.
But the EU's background is important, and prior to this program, four other environmental policy action programs had been developed, resulting in the current, more or less harmonious framework of rules and principles for environmental conservation, which demonstrates the rapid evolution of EU environmental policy. All of this shares the common goal of fully integrating the principles of natural resource and environmental conservation into sectoral policies.
It is important to recognize that since the entry into force of the Treaty of Amsterdam, this philosophy has been consolidated, as the integration clause has acquired a leading role in the Treaty, and this principle has been considered the most suitable instrument for promoting sustainable development. The European Councils of Cardiff and Vienna (1998) encouraged its prompt implementation, such that the environmental limitations arising from the application of existing commitments are not voluntary options but essential obligations for addressing one of the greatest challenges the European Union has faced in relation to its environmental policy and all its sectoral policies.
From the vast array of existing environmental regulations within the EU, the following are some of the general environmental conservation rules that have the greatest impact on the agricultural sector, for the purposes of the aforementioned integration:
Directive 79/409/EEC, on the conservation of wild birds.
Directive 85/337/EEC as amended by Directive 97/11/EEC on the assessment of the effects of certain public and private projects on the environment (environmental impact assessments).
Directive 90/220 on the deliberate release into the environment of genetically modified organisms and their subsequent modifications.
Directive 91/156/EEC, on waste.
Directive 91/676/EEC on the protection of waters against pollution caused by nitrates used in agriculture.
Directive 92/43/EEC on the conservation of natural habitats and of wild flora and fauna. Directive 96/61/EEC on integrated pollution prevention and control.
Directive 2000/60, water framework.
Of all the regulations mentioned, there are four that have a special impact on the PNR, both in the planning process and in the subsequent execution:
Birds and Habitats Directives
Council Directives 79/409/EEC of 2 April 1979 and 92/43/EEC of 21 May 1992, known simply as the “Birds” and “Habitats” Directives, respectively, represent the most important Community legislation aimed at preserving habitats and biological diversity, including wild flora and fauna. These legal instruments commit the Community and the Member States to adopt a series of specific measures for the protection not only of species but also of their habitats. This approach adds a new conservation criterion to those traditionally used, based on the joint consideration of habitats and species, as they have complementary effects in practice.
Under both Directives, Member States are required to designate specific areas (Special Protection Areas for Birds or SPAs and Sites of Community Importance or SCIs, respectively) where they must implement special protection and management measures to maintain the habitats and populations listed in the annexes to both Directives. These measures include those aimed at preventing pollution and habitat degradation within these areas, as well as disturbances that affect the life cycle of species, particularly those included in the Lists of Threatened Species.
However, these areas covered by the Birds and Habitats Directives may contain, alongside natural habitats, other more human-modified areas, generally crops or other traditional land uses. These areas also possess biodiversity, in some cases even more valuable than the same territory would have had without these uses, and this biodiversity may have contributed to the creation of a Special Protection Area (SPA) or a Site of Community Importance (SCI). These are agricultural landscapes whose conservation is also becoming increasingly important in European and national agricultural policies.
The Sites of Community Importance (SCIs) lists proposed by the Member States will form the basis for the future European Network of Special Areas of Conservation, Natura 2000, in which all types of habitats or community areas of interest and in good conservation status will be represented. In compliance with the Habitats Directive, Spain has submitted its proposed SCIs to the EU, which, according to information from the Ministry of the Environment, cover an area of 11,675,531 hectares, representing more than 20 percent of the national territory. Their regional distribution is shown in the following table and map:
Sites of Community Importance (SCIs). Year 2001
| Autonomous Community | Area (ha) |
|---|---|
| Andalusia | 2.587.143 |
| Aragon | 1.045.788 |
| Asturias | 218.037 |
| Balearics | 170.276 |
| Cantabria | 118.574 |
| Castilla la Mancha | 1.486.832 |
| Castile and León | 2.186.841 |
| Catalonia | 621.192 |
| Ceuta | 1.467 |
| Estremadura | 828.942 |
| Galicia | 325.798 |
| Canary Islands | 476.495 |
| Madrid | 319.906 |
| Murcia | 344.911 |
| Navarre | 247.684 |
| the Basque Country | 110.989 |
| Rioja | 166.423 |
| C.Valenciana | 418.234 |
| Total | 11.675.531 |
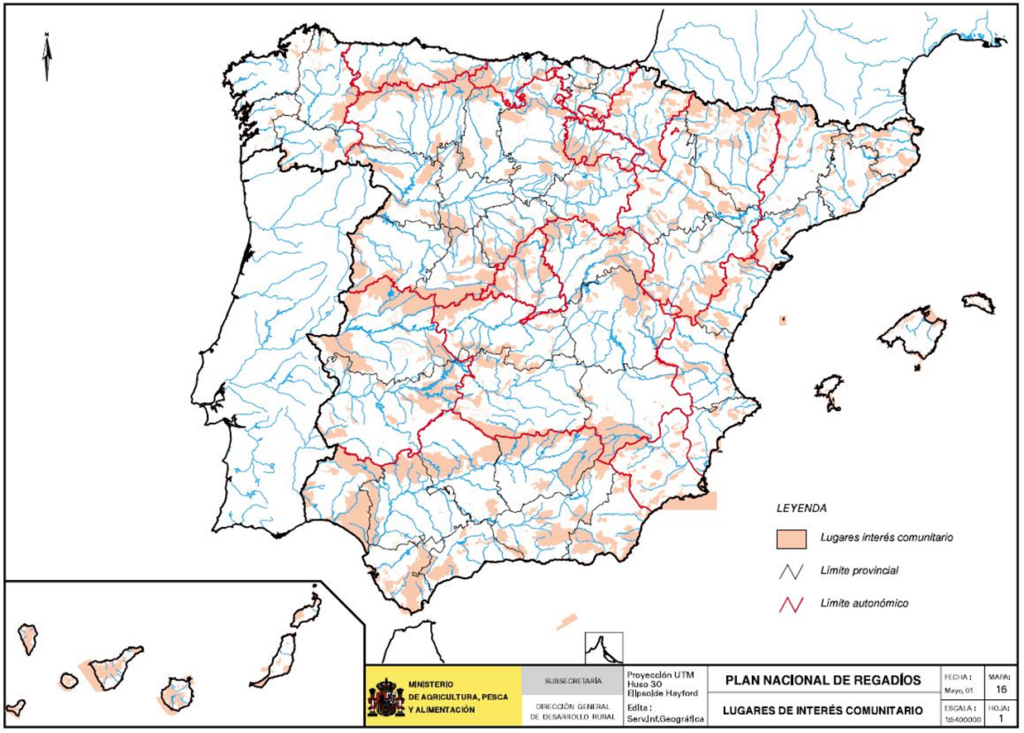
In compliance with the Birds Directive, Spain has established a large number of areas within its territory as Special Protection Areas (SPAs) since joining the EU. According to information from the Ministry of the Environment, there are currently 280 SPAs, covering a total of 5,794,267 hectares, all of which are included within Sites of Community Importance (SCIs). This area represents 201% of all SPAs declared in the EU, making Spain the Member State with the largest area of declared SPAs, exceeding the total area designated by countries such as France, Portugal, Italy, and Greece, which also boast significant birdlife. The regional distribution is shown in the following table and map:
ZEITHERAreas of Special Environmental Protection (ZEPAs). Year 2001
| Autonomous Community | Area (ha) |
|---|---|
| Andalusia | 1.017.489 |
| Aragon | 270.693 |
| Asturias | 57.776 |
| Balearics | 119.135 |
| Canary Islands | 208.523 |
| Cantabria | 79.114 |
| Castilla la Mancha | 959.636 |
| Castile and León | 1.852.555 |
| Catalonia | 65.751 |
| Ceuta | 630 |
| Estremadura | 600.608 |
| Galicia | 6.692 |
| Madrid | 185.328 |
| Melilla | 55 |
| Murcia | 40.661 |
| Navarre | 79.933 |
| the Basque Country | 39.277 |
| Rioja | 165.870 |
| C.Valenciana | 44.542 |
| Total | 5.794.267 |
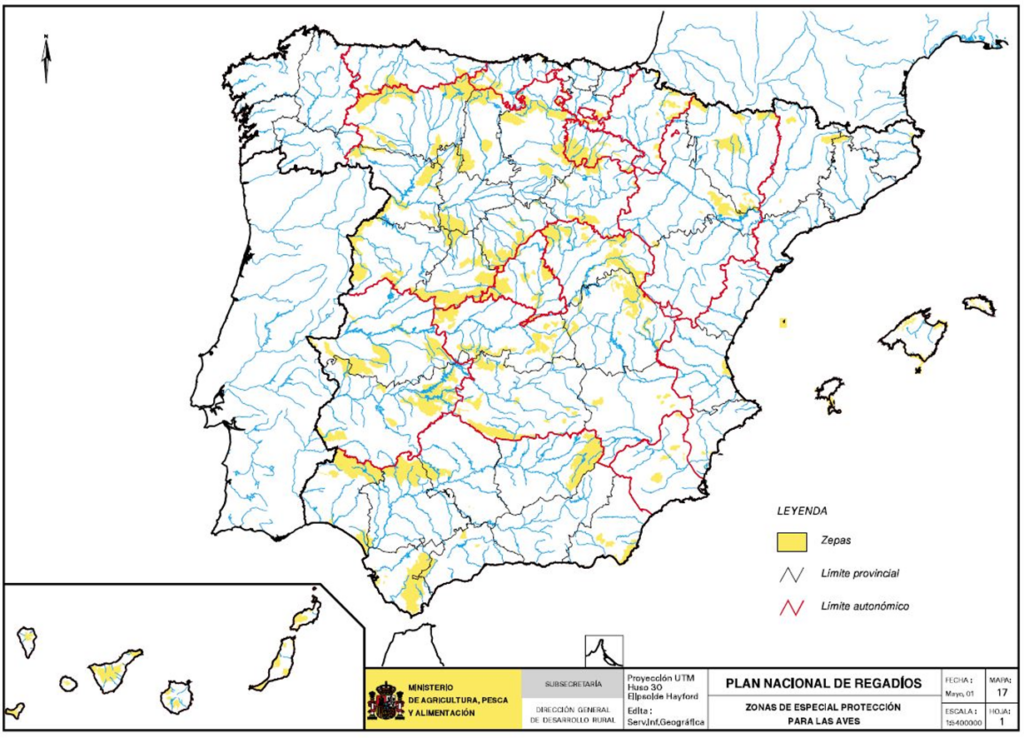
Nitrates Directive
Directive 91/176/EEC, concerning the protection of waters against pollution caused by nitrates of agricultural origin, known as the Nitrates Directive, is the Community regulation related to soil and water pollution that can have the greatest impact on the PNR.
It establishes the concept of "vulnerable zones" for those surfaces whose runoff or seepage affects or may affect bodies of water contaminated by nitrates or at risk of being so.
The Directive requires each Member State to declare its vulnerable areas and communicate this information to the Commission, as well as to review these areas at least every four years. It also mandates the development of action programs for these areas, containing measures to prevent and reduce pollution caused by nitrates from agricultural sources. These measures include limiting fertilizer applications to the land (based on soil type, climatic conditions, irrigation needs, etc.) and even prohibiting them during certain periods, as well as all measures related to water use management. In any case, these programs will incorporate the measures included in the codes of good agricultural practice, which the Directive also provides for voluntary application by farmers under normal conditions. In other words, these codes become mandatory for vulnerable areas.
It should be noted that there are currently 1,300,000 hectares of irrigated land in Spain located in vulnerable areas declared by the Autonomous Communities; consequently, the action programs that will be developed for the future must take into account the irrigation forecasts contained in the PNR.
Water Framework Directive
Since the 1970s, the EU has approved more than 25 Directives relating to both freshwater and marine waters, and they can be fundamentally divided into two types: those that seek to prevent the dumping of hazardous substances and those that set minimum quality standards according to the intended use of the water (for drinking, bathing, etc.).
It was therefore highly advisable to update and consolidate all this legislation into a comprehensive Directive on the matter. This is one of the objectives of Directive 2000/60/EC of the European Parliament and of the Council, which establishes a framework for Community action in the field of water policy. It seeks to establish common principles, as well as to ensure the coordination, integration, and adaptation of structures to these general principles of water protection and sustainable use within the Community, respecting the principle of subsidiarity of the Member States.
The Directive encourages reflection on how to approach this new water policy, in which the environmental dimension is paramount and will lead to new management practices and a new culture of water use. Given that water is a scarce resource, it must be considered an economic good subject to the polluter pays principle, and the principle of cost recovery will also be taken into account.
This Directive, which is very positive overall insofar as it aims to safeguard environmental interests, must be taken into account in all actions relating to irrigation, the most important points of which are the following:
- The protection of surface, groundwater and marine waters, to achieve good water status, considering quantitative, qualitative and ecological aspects.
- The use of the best environmental techniques for the control of diffuse pollution.
- The recovery of costs for water-related services (related to the regulation, operation, maintenance, and amortization of water infrastructure, as well as environmental costs). However, it should be noted that Article 9, paragraph 4, of the Directive states that Member States will not be in breach of the Directive if they decide not to apply full cost recovery, in accordance with established practices for a given water use activity and provided that this does not compromise the achievement of its objectives.
The new guidelines for irrigation policy, as outlined in the National Irrigation Plan Horizon 2008, incorporate environmental requirements while placing great emphasis in their action programs on water conservation and management, minimizing return flows and advocating for limitations on irrigation conversions in certain hydrogeological units. Throughout the implementation of the National Irrigation Plan, the suitability of the various action programs to meet environmental requirements must be verified.
For the full implementation of the Directive, an adaptation period is established that will allow the actions of the Plan to be adjusted to comply with it, in any case without needing to exhaust the wide margin of time allowed by the Directive.
3.8.2 The EU's environmental policy and the CAP
Since the agricultural sector is one of those considered by the European Union as a priority for the purposes of integrating environmental aspects, it can be said that the Community environmental policy has had a prompt impact on the common agricultural policy (CAP), to the point that the last two CAP reforms have been heavily influenced by the aforementioned environmental commitments.
Indeed, the integration of environmental considerations into the agricultural sector began to take shape in the 1992 reform of the Common Agricultural Policy (CAP), which incorporated measures with a distinctly environmental focus, particularly through Council Regulations (EEC) 2078/92 and (EEC) 2080/92, which respectively promoted agri-environmental and forestry measures in agriculture. However, it was primarily in the most recent reform, designed within the framework of Agenda 2000, that the measures for this integration and for compliance with the principles and standards derived from international environmental conventions were completed. It is no coincidence that Article 2 of the Treaty of Amsterdam reinforces the integration of environmental considerations as a primary objective of Community policy to achieve sustainable development.
In short, the latest CAP reform aims to maximize agriculture's positive environmental impact while eliminating its negative effects. Furthermore, it seeks to address the new challenges facing European agriculture in recent years, two of which are key to its future: EU enlargement and the ongoing negotiations at the World Trade Organization.
In this respect, there is general recognition of the positive role that agriculture plays in achieving sustainable development. However, the evolution of technologies being applied to agriculture to intensify production and achieve better yields at lower costs has led to increasing pressure on natural resources and the environment in general, highlighting the need to incorporate environmental requirements to avoid or mitigate the potential negative effects of these technologies.
In other words, the great interdependence between agriculture and the environment means that, just as aggressive agriculture can produce harmful effects on the environment, agriculture can also contribute very positively to achieving the objectives of conserving the natural environment.
The regulations resulting from the reform are based on these approaches and reflect these concerns, incorporating numerous criteria and provisions of an environmental nature that allow for the configuration of a new model of agriculture oriented towards achieving sustainable development and the integration of the environment in the sector.
By way of example only, and without intending to be exhaustive, the following can be cited:
- Regulation (EC) No 1260/99, which lays down general provisions on the Structural Funds, specifically regulates the environmental requirements for the application of these Funds to the financing of programs proposed by Member States. In general, it can be stated that it considers the evaluation and monitoring phase of these programs as an essential part of ensuring the integration of environmental policy into the CAP. Environmental indicators will be used for these evaluations.
- Regulation (EC) 1257/99 on rural development aid also requires an assessment of the program's environmental impact using relevant indicators. Furthermore, it mandates the application of codes of "good agricultural practice.".
- Regulation (EC) 1259/99, on CAP direct aid schemes, makes the payment of such direct aid to farmers conditional upon compliance with a series of environmental requirements.
Furthermore, it transfers to the Member States the responsibility to adopt appropriate measures for the conservation of the environment and to determine the corresponding penalties for non-compliance.
- Also citeable are Regulation (EC) 1251/99 on the support scheme for producers of certain herbaceous crops; Regulation (EC) 1254/99 on the CMO in the beef sector and those relating to all sectors.
All of them require compliance with "minimum environmental standards" which are either established in each Regulation or, if not, must be understood as referring to the need to set environmental standards which at least include "compliance with mandatory environmental requirements" (Article 28 of EC Regulation 1750/99).
Furthermore, it should be noted that the EU has developed a Strategy for integrating environmental aspects and sustainable development into the CAP, which recognizes the diversity of the different European regions, basing the competence of its application and decision-making on national and local authorities in order to adapt it to the different particular situations of each area.
This Strategy outlines a European agricultural model that assigns agriculture a multifunctional role, encompassing not only its productive function but also environmental and landscape protection, food safety and quality, and animal welfare. However, the environmental measures implemented under the CAP must also consider the need to maintain the competitiveness of European farmers compared to those in other countries.
In conclusion, integrating the environment into agriculture implies, on the one hand, compliance with existing general EU environmental mandates and, on the other hand, compliance with the specific rules arising from the CAP reform, which are in turn imbued with environmental requirements.
All of this significantly influences the implementation of agricultural and rural development policy. It will sometimes necessitate limitations on certain agricultural practices (use of pesticides, fertilizers, etc.), but it can also lead to outright bans on specific crops or farming methods in some areas. In this regard, special attention must be paid to vulnerable areas designated under the Nitrates Directive and to protected areas included in the Natura 2000 network, established under the Habitats Directive.
To compensate for these limitations and prohibitions, the CAP includes a system of incentives that encourages the development of a more proactive and environmentally friendly policy. These incentives are primarily set out in the Regulations resulting from the CAP reform mentioned earlier.
All of this necessitates analyzing Community Agricultural Programs and the various measures to be implemented from an environmental perspective, as well as monitoring and evaluating them. Among the mechanisms to be used for this purpose, the use of agro-environmental indicators stands out, along with those that address the social and economic aspects necessary for achieving sustainable development.
3.8.3 National Environmental Policy
In general, it should be noted that Spanish environmental policy falls within the framework of EU environmental policy, as do the policies of all member states in this area, given the supranational and binding nature of EU legislation. However, this supranational framework allows for different applications, which are addressed by the various member states in their respective national policies.
Within Spanish environmental policy, only a brief reference will be made to two major areas, as they are the most closely related to agriculture in general, and to irrigation in particular:
- The policy of nature conservation.
- Water policy and water resources.
The nature conservation policy is inspired by the Spanish Strategy for the Conservation and Sustainable Use of Biological Diversity, which in turn is part of the European Community's Biodiversity Strategy.
One of the fundamental pillars of this Strategy is the preservation of ecosystems. In this area, priority actions have focused on completing and consolidating the National Parks Network, conceived as a sufficiently representative and well-preserved sample of our country's ecological diversity. To achieve this objective, the most significant representations of the main Spanish ecosystems not yet included in the Network have been incorporated, and all have been provided with the corresponding planning and management tools.
Another essential tool for habitat protection is the network of protected areas designated by the Autonomous Communities. The different Autonomous Communities, exercising their powers, have declared a large number of protected areas through various legal mechanisms within their respective legislations. These areas offer different levels of protection depending on the specific legal designation. Below is a summary table showing the surface area of protected areas by Autonomous Community, revealing a total of 3,605,500 hectares. This information is complemented by a map of Spain where these natural areas are marked in green.
NATURAL PROTECTED AREAS
| Province/Community | Area (ha) |
|---|---|
| Seville | 172.085 |
| Malaga | 38.503 |
| Jaén | 312.973 |
| Huelva | 325.445 |
| Granada/Almería | 171.832 |
| Grenade | 80.438 |
| Cordova | 133.705 |
| Cadiz | 240.971 |
| Almería | 96.545 |
| ANDALUSIA | 1.572.499 |
| Saragossa | 2.172 |
| Teruel | 3.262 |
| Huesca | 97.443 |
| ARAGON | 102.877 |
| Asturias | 101.113 |
| ASTURIAS | 101.113 |
| Tenerife | 103.237 |
| Lanzarote | 75.398 |
| The Palm | 26.446 |
| Iron | 16.330 |
| Gran Canaria | 70.177 |
| slingshot | 12.652 |
| Fuerteventura | 50.390 |
| CANARY ISLANDS | 354.630 |
| Cantabria | 56.403 |
| SINGSbESTUARY | 56.403 |
| Guadalajara/Cuenca | 105.780 |
| Guadalajara | 69.071 |
| Basin | 3.389 |
| Real city | 42.599 |
| Albacete | 4.444 |
| CASTILE–lTO STAIN | 225.283 |
| Zamora | 24.300 |
| Soria | 10.466 |
| Segovia | 4.972 |
| Lion | 141.764 |
| Burgos | 3.089 |
| Ávila | 96.878 |
| CASTILE AND LEON | 281.469 |
| tarragona | 11.577 |
| Lleida | 17.569 |
| Girona | 35.047 |
| Barcelona | 76.023 |
| CATALONIA | 140.217 |
| Cáceres | 210.731 |
| Badajoz | 68.039 |
| ESTREMADURA | 278.771 |
| Pontevedra | 3.865 |
| Orense | 25.977 |
| lugo | 564 |
| A Coruña | 15.784 |
| G.A.LICIA | 46.190 |
| Balearics | 38.508 |
| BALEARIC ISLANDS | 38.508 |
| The Rioja | 23.673 |
| THE RIOJA | 23.673 |
| Madrid | 104.046 |
| MADRID | 104.046 |
| Murcia | 56.764 |
| MURCIA | 56.764 |
| Navarre | 71.225 |
| NAVARRE | 71.225 |
| Biscay | 28.158 |
| Guipuzcoa | 19.287 |
| Álava | 32.679 |
| PTOBASQUE IS | 80.123 |
| Valencia | 20.933 |
| Castellón | 35.211 |
| Alicante | 15.566 |
| c. VALENCIAN | 71.709 |
| Total | 3.605.500 |
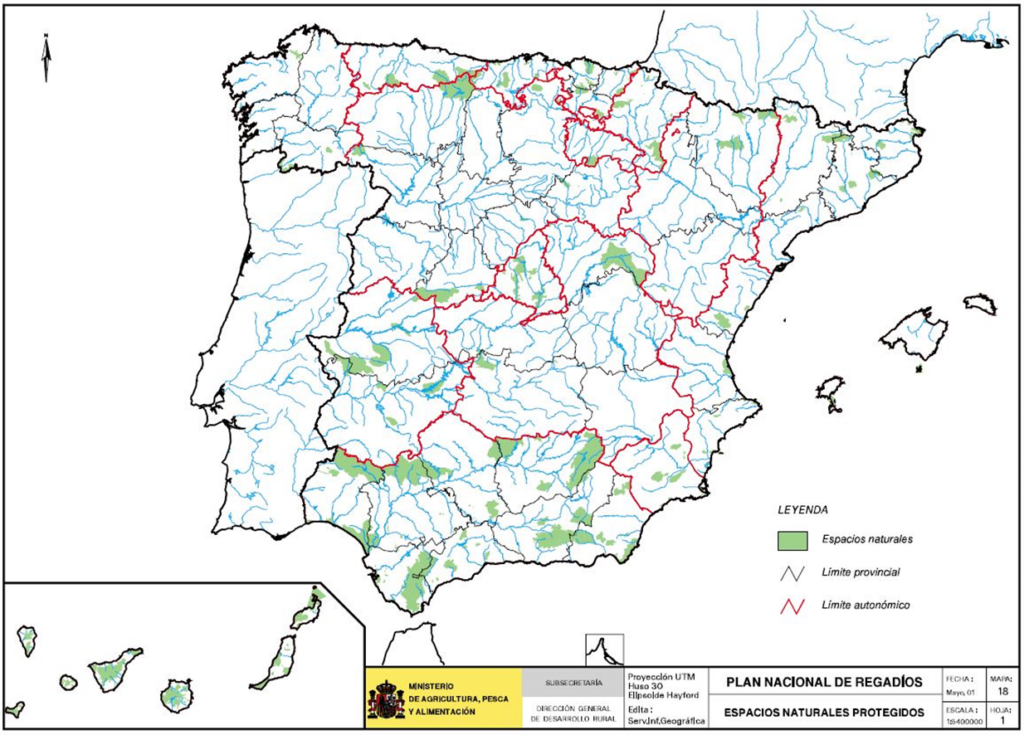
However, the largest surface area is occupied by Sites of Community Importance (SCIs), which will make a very important contribution to the Natura 2000 network, not only quantitatively but also qualitatively, due to their rich biodiversity. These include Special Protection Areas (SPAs), which play a key role in bird conservation because of the wide variety of habitats and bird species they support, as well as many of the previously mentioned Protected Natural Areas.
Another fundamental aspect of nature conservation policy is the conservation of species, and especially threatened species, both flora and fauna. To this end, the Autonomous Communities are developing recovery, conservation, and management plans for these species. The creation, review, and updating of national and regional catalogs has also contributed to achieving this objective.
The main regulatory instruments for implementing this policy are Law 4/1984, on the Conservation of Natural Species and Wild Flora and Fauna, and Laws 40/1997 and 41/1997, which partially amend the former; as well as Royal Decree 1997/1995, on measures to contribute to guaranteeing biodiversity through the conservation of natural habitats and wild flora and fauna. This decree transposed the Habitats Directive into Spanish law. It was amended by Royal Decree 1193/1998 to adapt it to the latest amendment of the aforementioned directive.
Water policy has been shaped by hydrological planning, which gained particular importance after the 1985 Water Law, deemed essential for a coherent policy in this area. The most significant example of this planning has been the National Hydrological Plan, which, together with the Water Framework Directive already discussed, forms the general framework for this policy.
It can be stated that there are two outstanding aspects that accumulate the greatest efforts: Achieving good ecological status of the public water domain by paying maximum attention to environmental factors (ecological flows, discharge controls, etc.), and rationalizing the use of water in the face of the large increase in its demand and the prominent role it plays in the balance of regional and sectoral development.
The main regulatory instruments for implementing water policy are:
- The aforementioned Law 29/1985, on Water, as well as Royal Decree 849/86 which approved the Regulation of the Public Water Domain, Royal Decree 650/87 which defined the territorial scopes of the River Basin Organizations and the Hydrological Plans, and Royal Decree 927/1988 which approved the Regulation of the Public Water Administration.
- It is also worth highlighting Royal Decree 1138/90, which approves the Technical Sanitary Regulations for the supply and quality control of drinking water, and Royal Decree 261/96 on the protection of groundwater against pollution by nitrates of agricultural origin, which transposes Council Directive 91/676/EEC. Both shape the environmental policy for water and water resources, especially in aspects related to agriculture.
- Law 46/99, on Water, which modifies the previous Law of 1985, establishes legal mechanisms to improve water management at the national level and promote participation in said management, but above all it contemplates a series of measures for the protection of water quality and to establish water saving policies.
Regarding water conservation policies, apart from promoting the use of new desalination and reuse technologies, this Law establishes the following, which has a significant impact on irrigation.
- The obligation of holders of private water use rights to install and maintain approved measurement systems.
- The establishment of the obligation to form user communities in aquifers declared overexploited or at risk of being so.
- The introduction of a corrective factor on the operating and maintenance fees for hydraulic works, to be paid by irrigation water users when they consume quantities higher or lower than the reference allocations. This factor can range between 2 and 0.5.
4 Current situation of irrigation
4.1 Introduction and structure of the chapter
To rigorously address irrigation planning, it is necessary to have a systematic knowledge of its current situation, its importance in the production and productivity of farms, and its contribution to employment and the socio-economic development of rural areas.
Some of these aspects have already been outlined, along with other basic references, in Chapter 3 and it is not necessary to go over them again.
This chapter is structured in FOUR main sections:
- The first section, concerning existing irrigation systems, compiles overall data on irrigable and currently irrigated areas, as well as the historical evolution of irrigation transformations promoted by public and private initiatives. It details a comprehensive comparative historical series of production and productivity in dryland and irrigated farming, and assesses employment in both cases by region. The core content of this section summarizes the most significant results obtained in the characterization and classification studies conducted on water sources, irrigation systems, production orientation, infrastructure status, farm size, and other factors. These findings allow us to determine the extent to which it is advisable to promote improvements in currently operating irrigation systems.
- The second section refers to 36 irrigated areas that are in different administrative situations and stages of implementation by various public administrations and that have been investigated in detail. The results of the investigation are presented, for each area, in a summary sheet accompanied by the corresponding graphic information.
- The third section refers to the analyses and studies carried out in potential new areas for development, understood as those areas that have previously been considered irrigable by various public administrations, either within a general plan (such as River Basin Management Plans) or as specific territorial actions. In this section, as in the second, the aim is to define the current viability of the development and the priority level for its inclusion in sectoral planning within a specific timeframe and budget.
- The fourth section analyzes different aspects of irrigation in relation to the economics of farms, water demand and consumption, the use of groundwater, energy plans, land management and the environment.
4.2 Irrigated land in operation: characterization and classification
4.2.1 General data
Currently, 3,344,637 hectares are irrigated in Spain, representing 71% of the national surface area and 131% of the usable agricultural area.
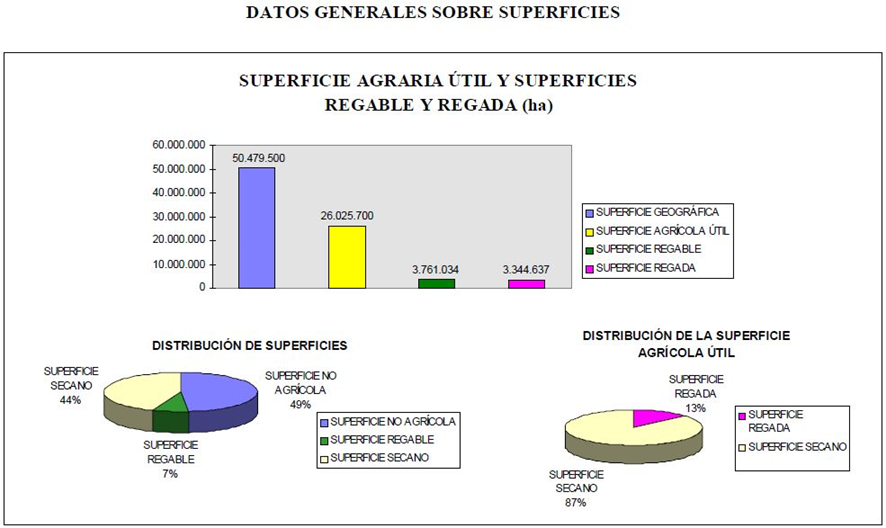
Of this irrigated area, 1,077,000 ha (approximately one third of the total) are traditional or historical irrigation systems (pre-1900), of which 782,000 ha are considered to be promoted by private initiative and the remaining 295,000 ha by public action.
In the last century, in application of the Law of 1911, the Ministry of Public Works promoted the transformation of 316,000 ha into irrigated land, while the irrigation carried out by the National Institute of Colonization and, later, by the Institute of Agrarian Reform and Development, either on its own initiative or through the Plans Coordinated with the Ministry of Public Works, reached the figure of 992,000 ha.
Following the Decrees transferring powers in matters of agricultural reform and development, the Autonomous Communities have implemented 95,000 hectares. Furthermore, the area brought under irrigation by private initiative is estimated at 1,280,000 hectares, of which 115,000 hectares have received public aid.
According to the figures above, we have the following distribution of irrigable areas:
| Origin of irrigation | Area (thousands ha) |
|---|---|
| Historical irrigation systems | 1.077 |
| Mº Public Works Initiative (Law of 1911) | 316 |
| INC and IRYDA Irrigation and Coordinated Plans (MAPA-MOPU) | 992 |
| CCAA Initiative | 95 |
| Private initiative | 1.280 |
| Total | 3.760 |
The attached graph analyzes the evolution of irrigated area according to the public or private promoter.
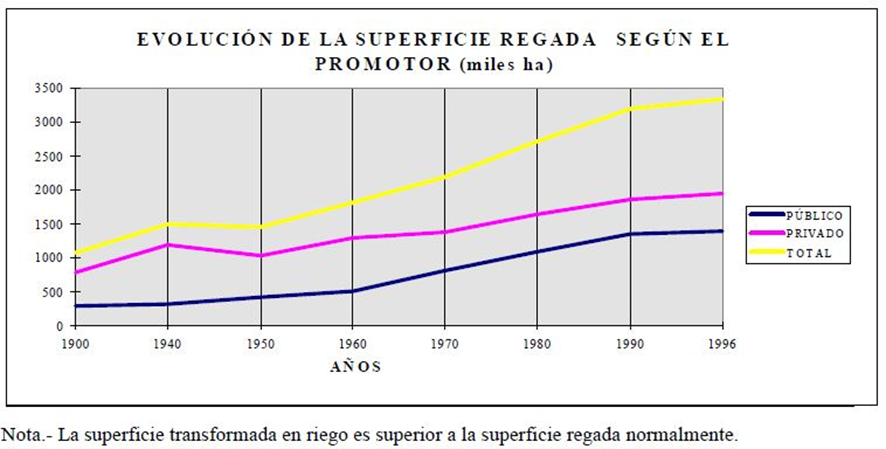
The relative territorial weight of irrigation, measured as the percentage that the irrigated area represents in each region over the total regional area, and the perimeters of current irrigation are shown in the following maps.
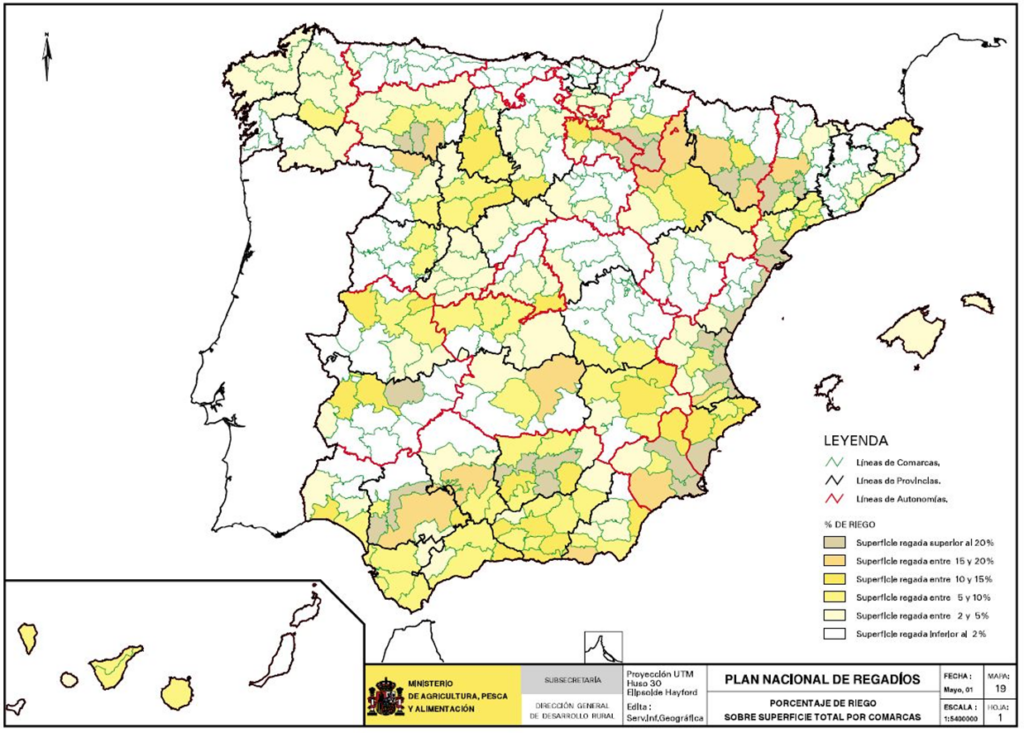
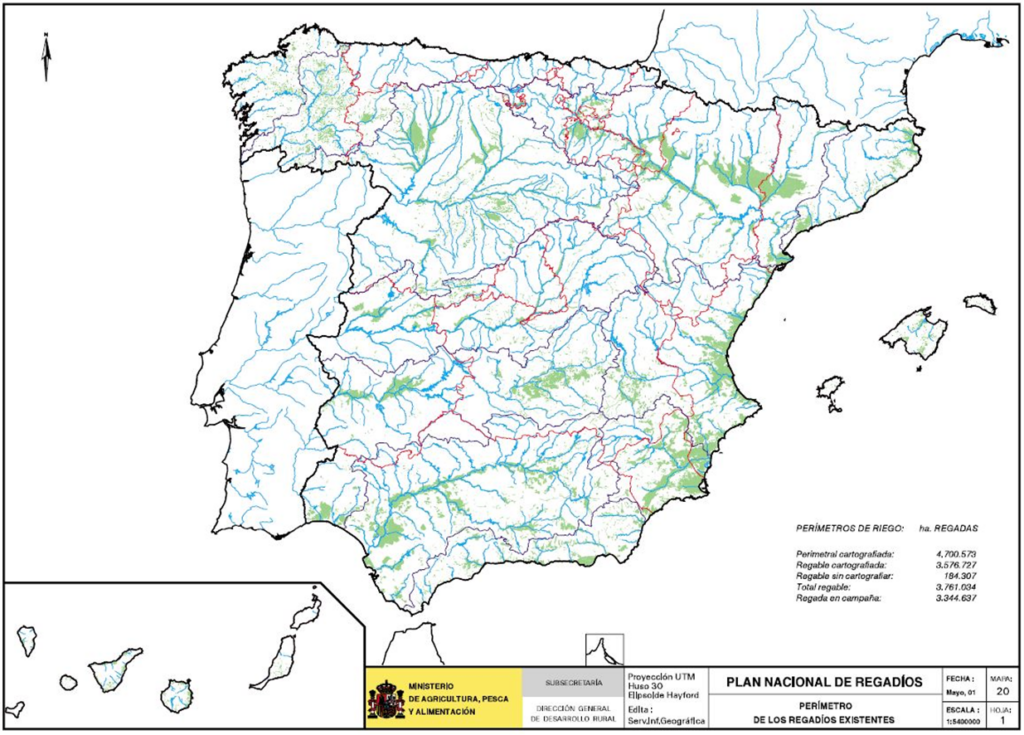
The economic relevance of irrigation in terms of production and productivity compared to dryland farming is shown in the following tables:
ANALYSIS OF THE VALUE OF AGRICULTURAL PRODUCTION FROM IRRIGATED AND DRYLAND FARMING (millions) Ptas.) AND PRODUCTIVITY (Ptas./ha) TO CONSTANT PESETAS OF 96
| Year | Final Agricultural Production at current prices | At constant Ptas. 96 | Industrial Productivity (irrigated/dryland) | |||
|---|---|---|---|---|---|---|
| Irrigated production | Dryland production | Irrigation productivity | Rainfed productivity | |||
| 1980 | 833.000 | 1.291.096 | 1.388.082 | 457.462 | 76.535 | 5,98 |
| 1981 | 827.700 | 1.136.934 | 1.183.340 | 398.631 | 65.400 | 6,10 |
| 1982 | 1.011.300 | 1.216.318 | 1.265.964 | 417.419 | 70.067 | 5,96 |
| 1983 | 1.198.600 | 1.311.049 | 1.311.049 | 448.528 | 72.667 | 6,17 |
| 1984 | 1.457.600 | 1.432.469 | 1.432.469 | 476.886 | 79.745 | 5,98 |
| 1985 | 1.532.100 | 1.425.811 | 1.341.679 | 474.259 | 75.115 | 6,31 |
| 1986 | 1.603.300 | 1.392.648 | 1.269.141 | 456.202 | 71.225 | 6,41 |
| 1987 | 1.769.900 | 1.486.765 | 1.302.663 | 478.706 | 73.459 | 6,52 |
| 1988 | 1.921.400 | 1.558.007 | 1.332.544 | 496.687 | 75.374 | 6,59 |
| 1989 | 1.908.600 | 1.465.579 | 1.220.599 | 462.444 | 69.349 | 6,67 |
| 1990 | 2.090.000 | 1.531.947 | 1.227.821 | 478.883 | 70.505 | 6,79 |
| 1991 | 2.097.300 | 1.447.523 | 1.163.921 | 453.286 | 67.144 | 6,75 |
| 1992 | 1.876.600 | 1.212.643 | 995.374 | 378.030 | 57.957 | 6,52 |
| 1993 | 1.923.700 | 1.190.939 | 973.224 | 367.642 | 57.779 | 6,36 |
| 1994 | 2.113.600 | 1.248.905 | 1.021.832 | 399.611 | 64.972 | 6,15 |
| 1995 | 2.131.100 | 1.202.580 | 983.929 | 376.053 | 56.681 | 6,63 |
| 1996 | 2.581.700 | 1.419.935 | 1.161.765 | 424.622 | 66.607 | 6,38 |
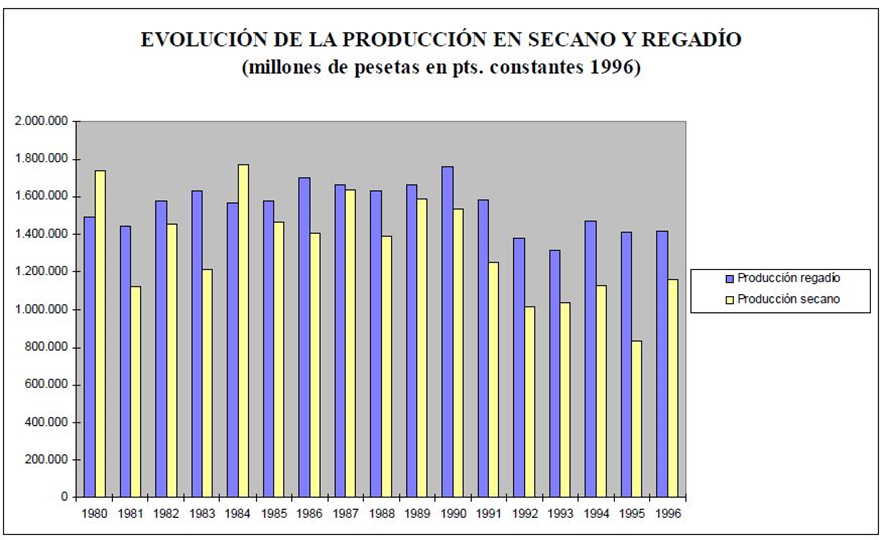
From these tables it can be deduced that in irrigated land 50% of the final agricultural production is obtained on only 13% of the agricultural surface and that the gross value of production per hectare is, depending on the year, between 400,000 and 500,000 pesetas, which is equivalent to slightly more than 6 times that of dryland farming.
From an employment perspective, it is clear that irrigated crops generate a greater demand for labor. To further illustrate this, we will now examine the labor needs for both dryland and irrigated farming in the various agricultural regions.
Despite the difficulties in differentiating employment between the two types due to the existence of mixed dryland-irrigated or agricultural-livestock farms, it has been estimated that in 1996, the year of the study, employment linked to irrigation was 610,000 UTA between permanent and temporary employment.
The greater labor requirements of irrigated agriculture compared to dryland farming vary considerably depending on the crop. Thus, they can range from 10% for cereal crops irrigated by sprinkler and full coverage or 100% for continental crops irrigated by gravity, up to 400% for fruits and vegetables or 4000% for forced crops.
The maps below give an idea of the labor needs in the agricultural regions.
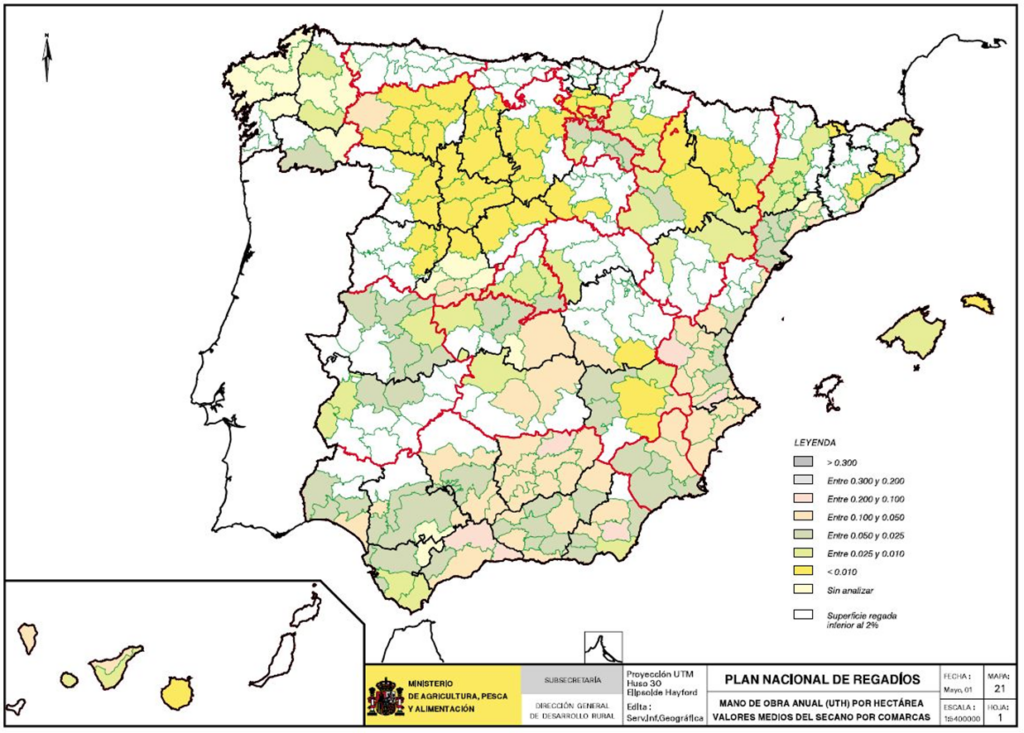
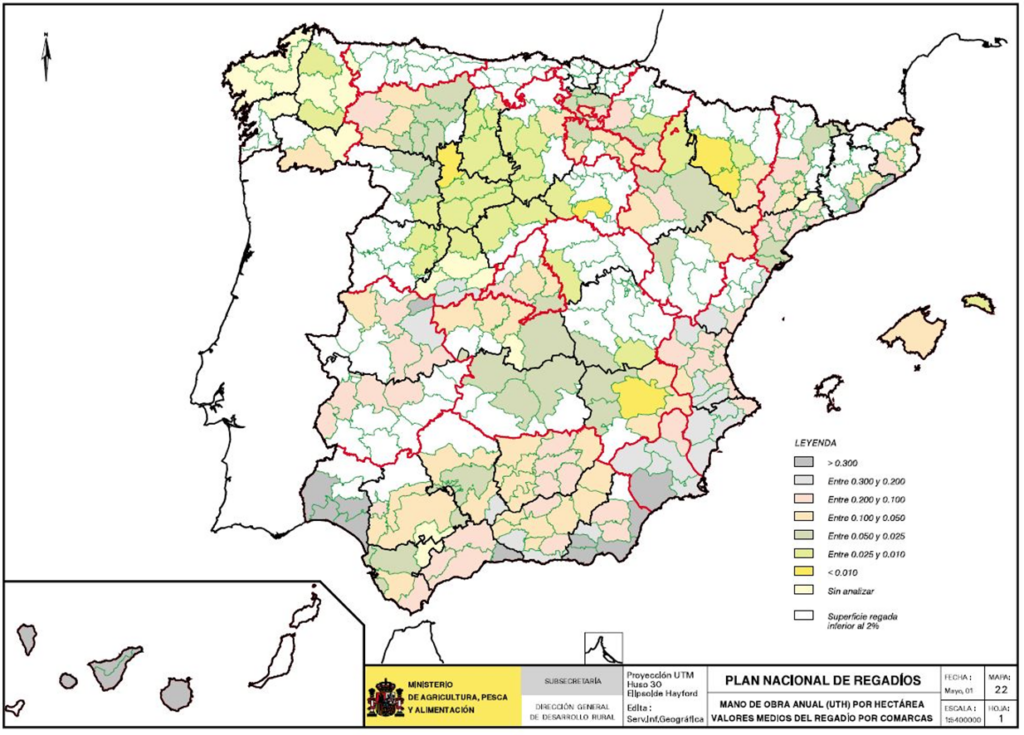
Analysis of the maps shows that the largest increases in the use of Agricultural Work Units (AWU) occur on the Mediterranean and southern Atlantic coasts, primarily in regions whose main activity is greenhouse and plastic-covered crops, followed by open-field horticulture and fruit orchards. In mainland Spain, the increase in labor resulting from irrigation conversions is less significant in absolute terms, ranging from 0.005 AWU per hectare to between 0.010 and 0.030, and potentially exceeding 0.20 AWU in certain regions.
It is worth noting that in several districts of Castilla-La Mancha, dryland farming appears on maps with a higher demand for employment than irrigated farming. This seemingly contradictory fact is explained by the fact that the most widely cultivated dryland crop in these districts is vineyards, while in irrigated areas it is cereals, corn, and alfalfa. Dryland farming requires more workdays than these irrigated crops do. This does not mean, however, that conversion to irrigated farming in these districts will necessarily lead to job losses, as a shift from dryland vineyard cultivation to irrigated cereal crops is unlikely. In all cases, the indirect employment generated by the increased consumption of inputs and the higher production generated in irrigated areas has not been taken into account.
4.2.2 Characterization and typification
To gain a better understanding of the current situation of irrigated land in operation, various studies have been carried out for its characterization and classification, with the aim of planning, quantifying and ordering its improvement and consolidation.
To carry out the study, information prepared by various agencies with agronomic or hydraulic expertise was compiled and analyzed, along with information gathered directly in the field through interviews with those responsible for irrigation units and visits to irrigated areas. The work phases were as follows:
- Collection and analysis of existing information.
- Identification of collective irrigation units and quantification of the areas of individual irrigated lands, defining as an irrigation unit the set of irrigated farms that have a common water intake, which may be collective irrigation units or individual irrigators.
- Hydraulic division of the territory into irrigation areas. The entire national territory has been divided into irrigation areas (811 areas), in which existing irrigation systems exhibit a degree of uniformity and a sufficiently homogeneous water source for grouped characterization. To make the results of these studies comparable with those carried out in the River Basin Management Plans, the irrigation areas must meet the condition that their entire surface area be included in a single hydraulic management unit of a river basin. The possibility of integrating all areas corresponding to the same hydraulic management unit or operating system of a river basin can make it useful as a primary planning element.
- Identification of administrative sub-areas. If the surface area of an irrigation zone belongs to two or more autonomous communities, the zone will be subdivided into as many sub-areas as there are autonomous communities affected.
- Obtaining and listing previous maps.
- Selection of a representative sample of existing irrigation systems.
- Definition of questionnaire models and completion guidelines.
- Interviews, tour of the irrigated area and delimitation of the irrigation unit.
- Verification of the information by the Study Management, by the Autonomous Communities and by the corresponding Hydrographic Confederations.
- Creation of graphic and documentary databases relating to irrigation units of collective and individual irrigation systems.
- Expansion of the data to the irrigation systems investigated, but not surveyed.
- Classification criteria and process. Irrigation classification is a process based on differentiating irrigation systems according to three basic characteristics: climate, water source, and irrigation application system.
- Criteria and characterization process. For the characterization of existing irrigation systems, 20 variables have been selected relating to climate, soil, crops, water quality, allocations, technical-economic orientation and farm structure.
All these work phases and their interrelationships correspond to the attached design.
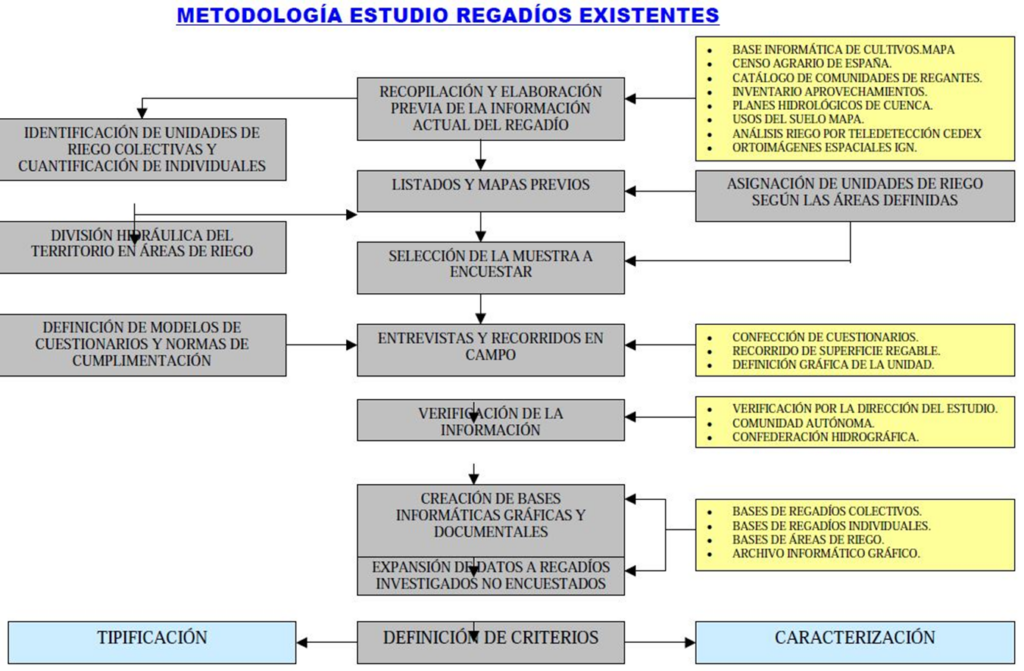
Following this methodological scheme, throughout the national territory 2,596,731 ha of irrigable surface managed by 7,196 irrigation communities and other types of irrigation collectives and 1,164,303 ha of irrigated land managed by farmers individually have been detected, which represents a total of 3,761,034 ha irrigable.
The total area surveyed in the study of the characterization and classification of irrigated land in operation, as shown in the following graph, amounts to 2,364,214 hectares, representing 63.1% of the total irrigable area. The results regarding the current situation, summarized in the following points, are derived from this high percentage surveyed.
It should be noted that comparing these irrigated area results with those provided in the approved River Basin Management Plans shows that the overall difference is very small (3,340 Mha versus 3,437 Mha, that is, on the order of 31% of the total), which confirms the validity and general agreement of the estimates made. In some basins, however, more significant differences are observed, which may be due to methodological disparities, different evaluation periods, or different criteria regarding the classification of certain areas as irrigated. From the perspective of water demand, the results obtained are also very much in agreement (24,094 hm³).3/year according to the PHC, compared to 23,552 hm3/year according to the studies offered here). Similar agreements are obtained with the unit allocations (7,010 m3/ha/year in the PHC compared to 7,042 m3/ha/year in the PNR studies).
All of this shows, without prejudice to some specific singularities, the good general agreement of both determinations, with figures perfectly fitting within the order of magnitude of the errors and uncertainties inherent in this type of work, especially if the objectives and time horizons of both plans are different and have been carried out with technical methodologies that are not necessarily the same.
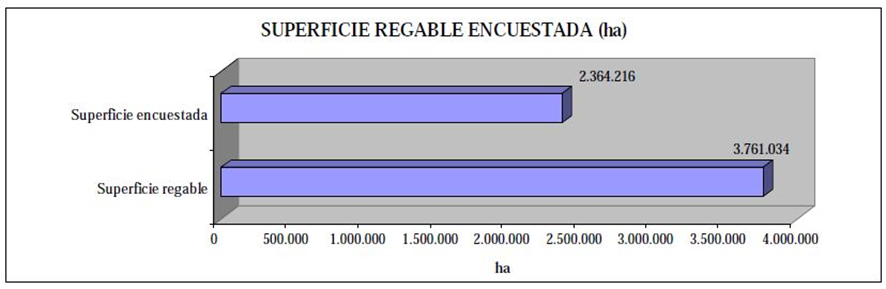
4.2.2.1 Irrigable and irrigated area by Autonomous Community
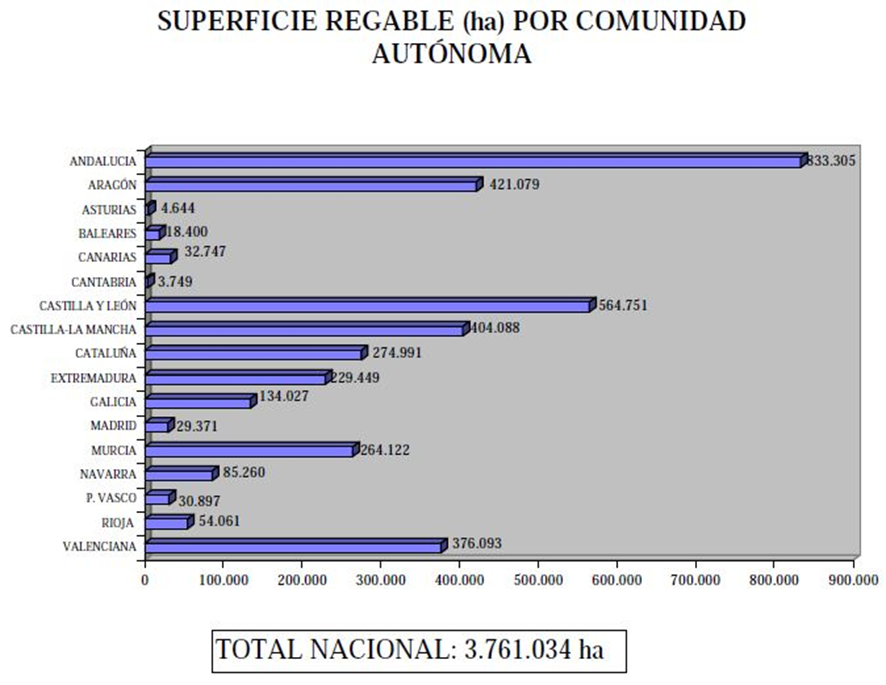
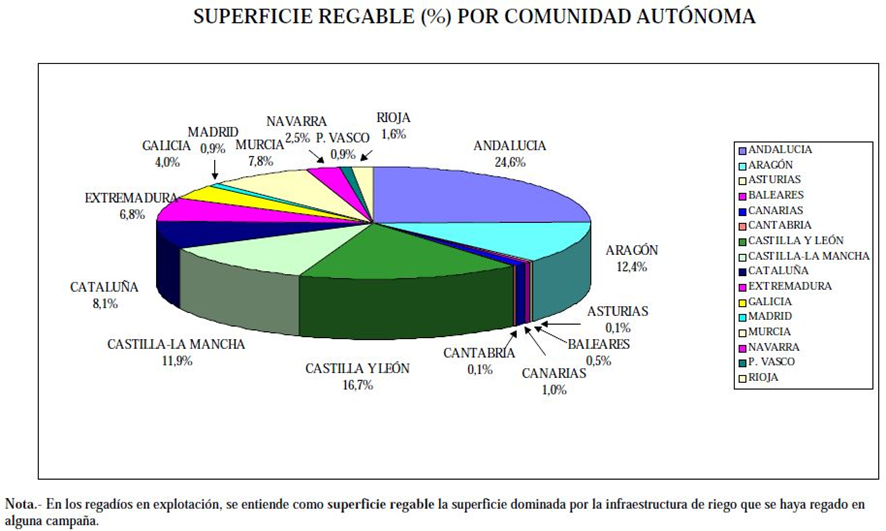
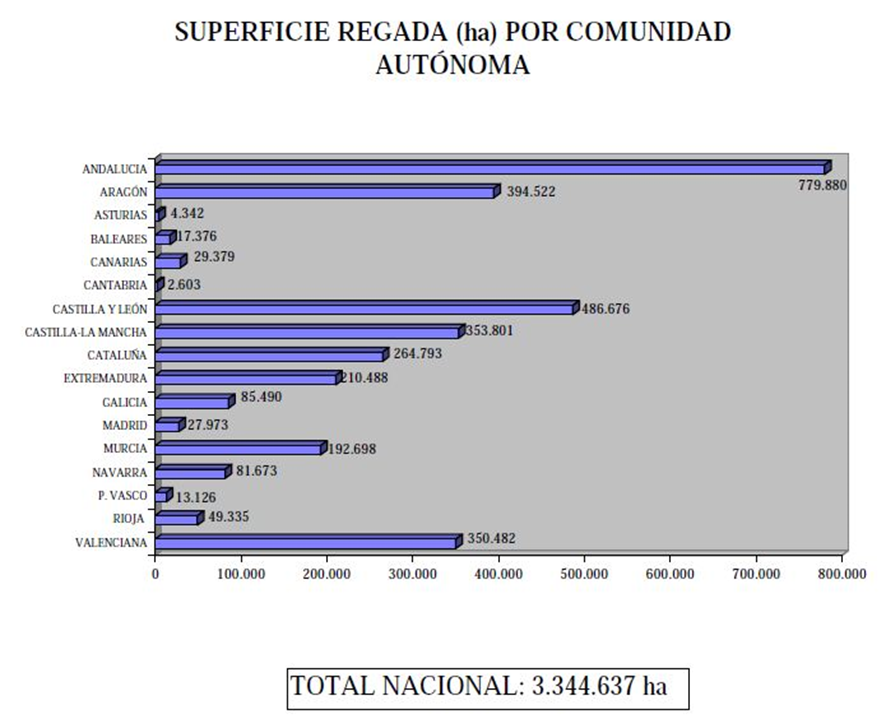
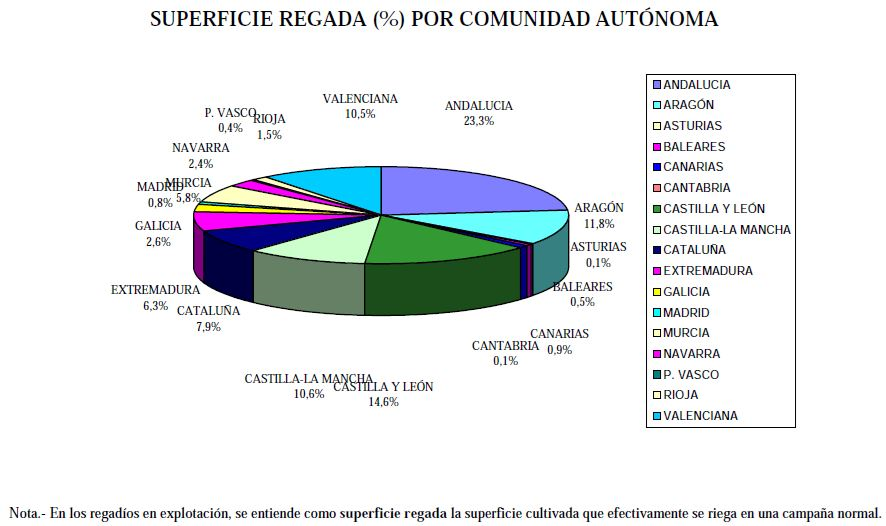
4.2.2.2 Irrigated area according to climatic types
| AUTONOMOUS COMMUNITY | SUBTROPICAL MEDITERRANEAN | MARITIME MEDITERRANEAN | FRESH MEDITERRANEAN MARITIME | TROPICAL MEDITERRANEAN | TEMPERATE MEDITERRANEAN | COOL TEMPERATE MEDITERRANEAN | CONTINENTAL MEDITERRANEAN | SUBTROPICAL SEMI-ARID MEDITERRANEAN | SEMI-ARID CONTINENTAL MEDITERRANEAN | WARM MARITIME | WARM TEMPERATE MARITIME | MARITIME TEMPERATE COLD | HUMID PATAGONIAN MARITIME | OTHERS | TOTAL |
|---|---|---|---|---|---|---|---|---|---|---|---|---|---|---|---|
| ANDALUSIA | 560.215 | 104.555 | 0 | 0 | 92.363 | 4.418 | 2.870 | 15.459 | 0 | 0 | 0 | 0 | 0 | 0 | 779.880 |
| ARAGON | 0 | 0 | 0 | 0 | 388.795 | 4.797 | 0 | 0 | 0 | 0 | 112 | 0 | 818 | 0 | 394.522 |
| ASTURIAS | 0 | 0 | 0 | 0 | 1.789 | 0 | 0 | 0 | 0 | 323 | 2.014 | 216 | 0 | 0 | 4.342 |
| BALEARICS | 5.331 | 12.045 | 0 | 0 | 0 | 0 | 0 | 0 | 0 | 0 | 0 | 0 | 0 | 0 | 17.376 |
| CANARY ISLANDS | 7.389 | 0 | 0 | 674 | 0 | 0 | 0 | 10.128 | 0 | 0 | 0 | 0 | 0 | 11.188 | 29.379 |
| CANTABRIA | 0 | 0 | 0 | 0 | 0 | 2.553 | 0 | 0 | 0 | 0 | 0 | 0 | 50 | 0 | 2.603 |
| CASTILE AND LEON | 0 | 0 | 0 | 0 | 414.636 | 72.040 | 0 | 0 | 0 | 0 | 0 | 0 | 0 | 0 | 486.676 |
| CASTILLA LA MANCHA | 170.112 | 0 | 0 | 0 | 159.972 | 892 | 17.190 | 0 | 6.335 | 0 | 0 | 0 | 0 | 0 | 353.801 |
| CATALONIA | 0 | 80.523 | 0 | 0 | 172.972 | 7.625 | 0 | 0 | 0 | 0 | 1.895 | 0 | 1.778 | 0 | 264.793 |
| ESTREMADURA | 199.390 | 0 | 3.646 | 0 | 7.452 | 0 | 0 | 0 | 0 | 0 | 0 | 0 | 0 | 0 | 210.488 |
| GALICIA | 0 | 19.829 | 5.358 | 0 | 48.855 | 223 | 0 | 0 | 0 | 1.689 | 9.536 | 0 | 0 | 0 | 85.490 |
| MADRID | 0 | 0 | 0 | 0 | 27.973 | 0 | 0 | 0 | 0 | 0 | 0 | 0 | 0 | 0 | 27.973 |
| MURCIA | 90.016 | 39.592 | 0 | 0 | 17.124 | 0 | 35.088 | 10.878 | 0 | 0 | 0 | 0 | 0 | 0 | 192.698 |
| NAVARRE | 0 | 0 | 0 | 0 | 81.673 | 0 | 0 | 0 | 0 | 0 | 0 | 0 | 0 | 0 | 81.673 |
| BASQUE P. | 0 | 0 | 0 | 0 | 12.899 | 0 | 0 | 0 | 0 | 0 | 227 | 0 | 0 | 0 | 13.126 |
| RIOJA | 0 | 0 | 0 | 0 | 48.241 | 0 | 0 | 0 | 0 | 0 | 0 | 0 | 0 | 0 | 49.335 |
| VALENCIAN | 202.343 | 122.576 | 0 | 0 | 25.563 | 1.094 | 0 | 0 | 0 | 0 | 0 | 0 | 0 | 0 | 350.482 |
| TOTAL | 1.234.796 | 379.120 | 9.004 | 674 | 1.499.607 | 93.642 | 55.148 | 36.465 | 6.335 | 2.012 | 13.784 | 216 | 2.646 | 11.188 | 3.344.637 |
4.2.2.3 Irrigated area according to water source and irrigation system
| AUTONOMOUS COMMUNITY | SUPERFICIAL | UNDERGROUND | TRANSFERS | RETURNS | TREATMENT PLANTS | DESALINATION PLANTS | TOTAL IRRIGATION |
|---|---|---|---|---|---|---|---|
| ANDALUSIA | 546.703 | 224.670 | 2.783 | 85 | 5.639 | 0 | 779.880 |
| ARAGON | 373.886 | 20.315 | 0 | 321 | 0 | 0 | 394.522 |
| ASTURIAS | 4.110 | 232 | 0 | 0 | 0 | 0 | 4.342 |
| BALEARICS | 21 | 15.895 | 0 | 0 | 1.460 | 0 | 17.376 |
| CANARY ISLANDS | 2.054 | 26.277 | 0 | 0 | 775 | 273 | 29.379 |
| CANTABRIA | 2.600 | 3 | 0 | 0 | 0 | 0 | 2.603 |
| CASTILE AND LEON | 361.055 | 113.164 | 0 | 12.428 | 29 | 0 | 486.676 |
| CASTILLA LA MANCHA | 124.262 | 228.528 | 1.011 | 0 | 0 | 0 | 353.801 |
| CATALONIA | 205.031 | 53.043 | 0 | 6.377 | 342 | 0 | 264.793 |
| ESTREMADURA | 207.337 | 3.151 | 0 | 0 | 0 | 0 | 210.488 |
| GALICIA | 85.061 | 92 | 337 | 0 | 0 | 0 | 85.490 |
| MADRID | 25.650 | 1.789 | 0 | 0 | 534 | 0 | 27.973 |
| MURCIA | 42.553 | 93.810 | 54.104 | 360 | 1.600 | 271 | 192.698 |
| NAVARRE | 79.941 | 1.682 | 0 | 50 | 0 | 0 | 81.673 |
| BASQUE P. | 10.167 | 1.208 | 0 | 0 | 1.751 | 0 | 13.126 |
| RIOJA | 45.771 | 3.564 | 0 | 0 | 0 | 49.335 | |
| VALENCIAN | 146.691 | 154.821 | 40.258 | 4.178 | 4.534 | 0 | 350.482 |
| TOTAL | 2.262.893 | 942.244 | 98.493 | 23.799 | 16.664 | 544 | 3.344.637 |
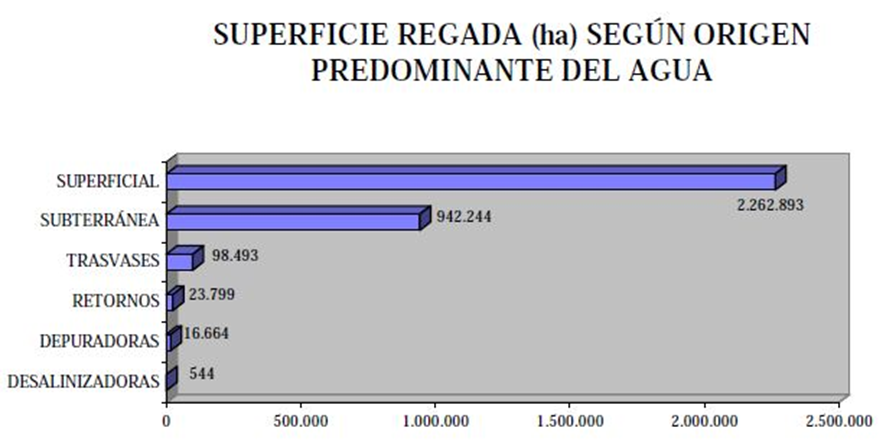
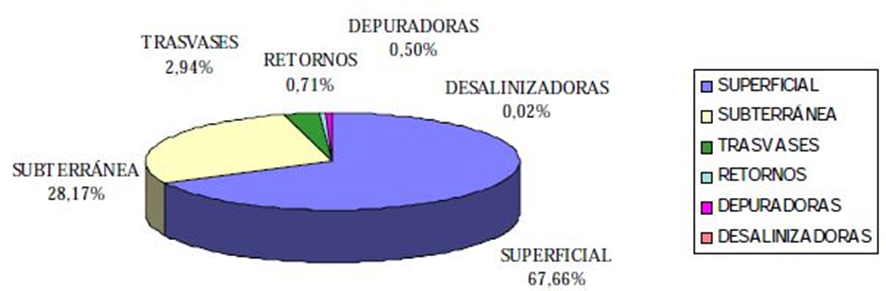
SUPERFYocYoIrrigated area (ha) per autonomous community according to the predominant irrigation system
| AUTONOMOUS COMMUNITY | GRAVITY | ASPERSION | LOCATED | TOTAL IRRIGATION |
|---|---|---|---|---|
| ANDALUSIA | 330.231 | 164.343 | 285.306 | 779.880 |
| ARAGON | 317.409 | 68.480 | 8.633 | 394.522 |
| ASTURIAS | 2.114 | 2.228 | 0 | 4.342 |
| BALEARICS | 4.381 | 9.823 | 3.172 | 17.376 |
| CANARY ISLANDS | 4.610 | 5.598 | 19.171 | 29.379 |
| CANTABRIA | 286 | 2.317 | 0 | 2.603 |
| CASTILE AND LEON | 298.089 | 188.344 | 243 | 486.676 |
| CASTILLA LA MANCHA | 113.240 | 195.585 | 44.976 | 353.801 |
| CATALONIA | 182.104 | 32.339 | 50.350 | 264.793 |
| ESTREMADURA | 145.188 | 55.085 | 10.215 | 210.488 |
| GALICIA | 55.081 | 30.405 | 4 | 85.490 |
| MADRID | 24.080 | 3.708 | 185 | 27.973 |
| MURCIA | 116.103 | 5.686 | 70.909 | 192.698 |
| NAVARRE | 72.828 | 7.984 | 861 | 81.673 |
| BASQUE P. | 1.320 | 11.766 | 40 | 13.126 |
| RIOJA | 32.583 | 14.188 | 2.564 | 49.335 |
| VALENCIAN | 281.191 | 3.066 | 66.225 | 350.482 |
| TOTAL | 1.980.838 | 800.945 | 562.854 | 3.344.637 |
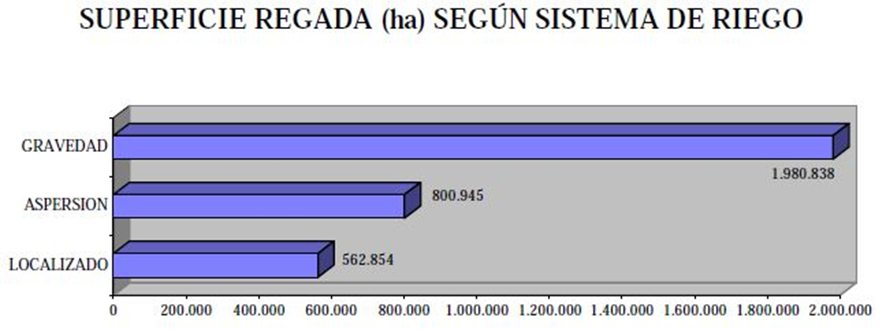
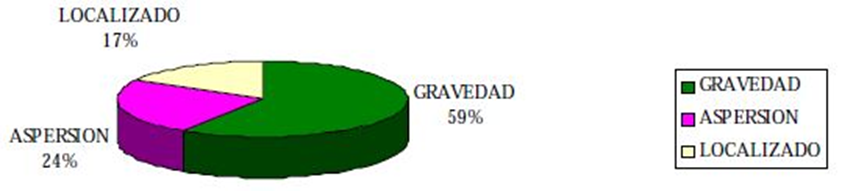
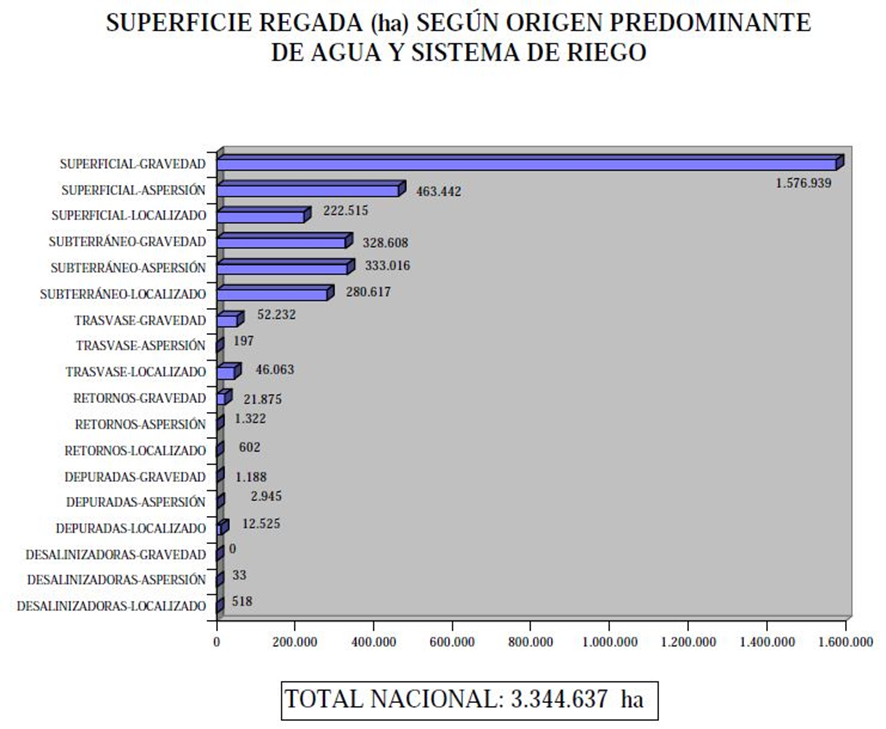
4.2.2.4 Irrigated area according to predominant crops
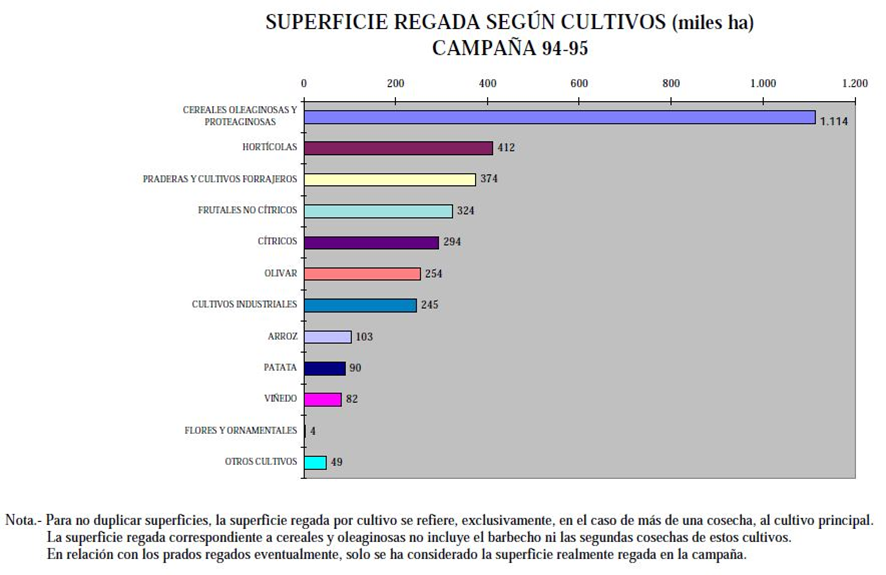
4.2.2.5 Irrigated area according to the water allocation index
The section “The demand and consumption of irrigation water” includes the methodology and the results of the water demand for existing irrigation systems, irrigation systems under construction and new irrigated areas.
The following charts show the irrigated area at the national level, in hectares and percentage, according to irrigation water allocation.
For the classification of irrigated land according to the allocation index, four main groups have been established in relation to the theoretical gross demand calculated in the PNR and the demands supplied:
- Overloaded surface: when the gross supply exceeds the gross demand at the headwaters calculated in the PNR by 10%.
- Area provided: when the gross supply is included in the interval between 90% and 110% of the gross demands at the head.
- Slightly under-endowed surface: when this ratio is between 75% and 90%.
- Underfunded areas: when the gross supply is less than 75%.
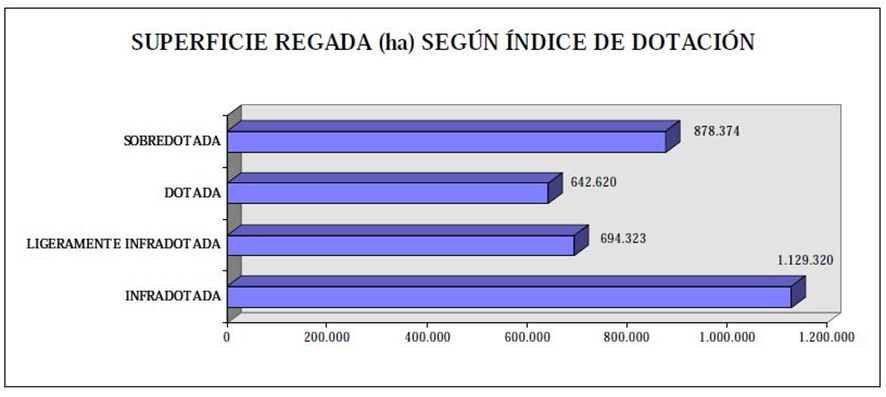
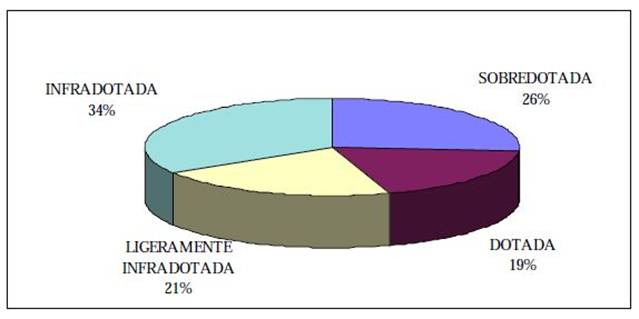
4.2.2.6 State of irrigation infrastructure
The existence of 1,810,000 hectares transformed before 1960, of which 1,077,000 hectares are over 100 years old, means that today there are 735,000 hectares where the distribution networks, largely earthen channels, suffer significant water losses. Furthermore, of the 1,295,000 hectares currently irrigated by concrete ditches, 392,000 hectares present serious conservation and maintenance problems. These irrigation systems were designed according to the technology available at the time, using the traditional gravity-fed irrigation system (1,981,000 hectares), and a large portion of them (1,635,000 hectares) with rotational irrigation. The declining efficiency of irrigation systems over time, coupled with changes in cropping practices, has resulted in 1,129,000 hectares currently being under-irrigated and another 694,000 hectares being slightly under-irrigated. This situation justifies the implementation of a program to consolidate and improve existing irrigation systems, aiming for more efficient water use and improved farm profitability and living standards for farmers.
| Autonomous Community | Surface with ditches on land | Surface with concrete pipes in poor condition |
|---|---|---|
| Andalusia | 125.980 | 123.764 |
| Aragon | 171.984 | 50.506 |
| Asturias | 497 | 85 |
| Balearics | 0 | 411 |
| Canary Islands | 0 | 1.050 |
| Cantabria | 74 | 93 |
| Castilla la Mancha | 17.805 | 14.225 |
| Castile and León | 133.287 | 72.937 |
| Catalonia | 119.345 | 20.534 |
| Estremadura | 2.718 | 35.748 |
| Galicia | 1.515 | 739 |
| Madrid | 5.267 | 357 |
| Murcia | 17.312 | 3.099 |
| Navarre | 37.880 | 24.839 |
| the Basque Country | 676 | 530 |
| Rioja | 25.601 | 5.221 |
| Valencian | 74.533 | 38.056 |
| Total | 734.475 | 392.194 |
4.2.2.7 Type of irrigation fee
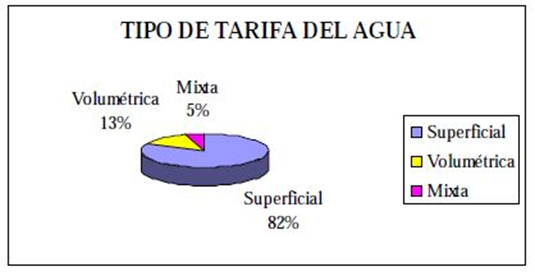
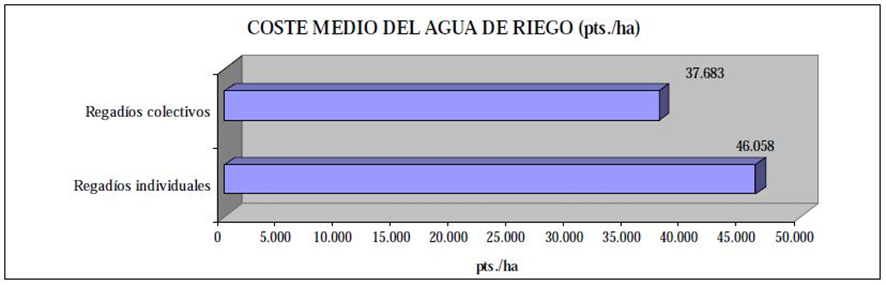
4.2.2.8 The size of irrigated farms
Spanish agriculture has faced the difficult challenge of integration into the European Union. However, recent changes to the Common Agricultural Policy and multilateral trade agreements under the GATT mark a new phase of market change, and therefore, Spanish agriculture will have to undergo a new adaptation process in which it must overcome the structural deficiencies that limit the competitiveness of many farms. Currently, problems persist such as the small size of farms, an aging agricultural population, rigid land markets, limited flexibility in the means of production, and insufficient sector organization and marketing structure.
Law 19/1995, of July 4, on the Modernization of Agricultural Holdings, addresses these problems by focusing on priority holdings, whether family-run or cooperative, to ensure their economic viability and justify preferential access to public support. For a holding, whether individual or cooperative, to be considered a priority holding and thus eligible for preferential access to the benefits, aid, and other support measures provided for in this law, it must employ at least one agricultural worker and the unit income derived from it must be equal to or greater than 35 percent of the reference income and less than 120 percent of it.
Article 2, point 11 of the Law defines as unit labor income the economic return generated in the agricultural holding that is attributed to the work unit and is obtained by dividing by the number of agricultural work units dedicated to the holding the figure resulting from adding the net margin or net surplus of the holding and the amount of wages paid.
Article 2, point 12, establishes the reference income as an indicator of gross non-agricultural wages in Spain. The annual determination of its amount will be made by the Ministry of Agriculture, Fisheries and Food, in accordance with the provisions of European Union regulations and taking into account wage data published by the National Statistics Institute. The reference income for 2001 was set at 3,133,051 pesetas.
At this point, the distribution of irrigated areas is analyzed according to the income intervals of the farms (RE) established by the aforementioned Law in relation to the reference income (RF).
- Income less than 0.35 of the reference income.
- Income equal to or greater than 0.35 and less than 1.2 of the reference income.
- Income equal to or greater than 1.2 of the reference income.
The data by Autonomous Community included in the attached tables have been obtained using the 1997 Survey of the Structure of Agricultural Holdings, regarding the size of holdings, and the PNR database regarding the economic dimension and the definition of income (family availability plus wages paid).
DISTRIBUTION OF IRRIGATED AREAS (ha) ACCORDING TO THE INCOME OF AGRICULTURAL HOLDINGS YEAR 1997
| Autonomous Community | RE<0.35*RF | 0.35*RF≤RE <1.2*RF | RE≥1.2*RF | Total |
|---|---|---|---|---|
| Andalusia | 16.041 | 197.129 | 566.710 | 779.880 |
| Aragon | 2.112 | 109.307 | 283.103 | 394.522 |
| Asturias | 136 | 3.781 | 425 | 4.342 |
| Balearics | 146 | 1.441 | 15.789 | 17.376 |
| Canary Islands | 16 | 1.049 | 28.314 | 29.379 |
| Cantabria | 44 | 1.153 | 1.405 | 2.602 |
| Castilla la Mancha | 8.434 | 73.699 | 271.669 | 353.802 |
| Castile and León | 12.491 | 273.025 | 201.160 | 486.676 |
| Catalonia | 1.246 | 56.811 | 206.736 | 264.793 |
| Estremadura | 5.882 | 37.411 | 167.195 | 210.488 |
| Galicia | 2.660 | 73.179 | 9.651 | 85.490 |
| Madrid | 73 | 4.428 | 23.472 | 27.973 |
| Murcia | 2.571 | 53.462 | 136.665 | 192.698 |
| Navarre | 438 | 22.645 | 58.591 | 81.674 |
| the Basque Country | 76 | 3.774 | 9.276 | 13.126 |
| Rioja | 264 | 13.679 | 35.392 | 49.335 |
| Valencian | 2.320 | 95.772 | 252.390 | 350.482 |
| Total | 54.950 | 1.021.745 | 2.267.943 | 3.344.638 |
RF= Reference income: 2,769,215 pesetas. in 1997
DISTRIBUTION (%) OF THE NUMBER OF IRRIGATED FARMS ACCORDING TO INCOME GRADES
YEAR 1997
| Autonomous Community | RE<0.35*RF | 0.35*RF≤RE< 1.2*RF | RE≥1.2*RF | Total |
|---|---|---|---|---|
| Andalusia | 29 | 59 | 12 | 100 |
| Aragon | 18 | 51 | 30 | 100 |
| Asturias | 16 | 79 | 4 | 100 |
| Balearics | 13 | 26 | 62 | 100 |
| Canary Islands | 1 | 10 | 89 | 100 |
| Cantabria | 12 | 52 | 35 | 100 |
| Castilla la Mancha | 35 | 45 | 20 | 100 |
| Castile and León | 37 | 44 | 19 | 100 |
| Catalonia | 13 | 64 | 23 | 100 |
| Estremadura | 33 | 38 | 29 | 100 |
| Galicia | 16 | 80 | 4 | 100 |
| Madrid | 7 | 58 | 35 | 100 |
| Murcia | 22 | 66 | 12 | 100 |
| Navarre | 15 | 54 | 31 | 100 |
| the Basque Country | 16 | 58 | 25 | 100 |
| Rioja | 7 | 67 | 25 | 100 |
| Valencian | 5 | 65 | 30 | 100 |
| Total | 21 | 57 | 22 | 100 |
RF= Reference income: 2,769,215 pesetas. in 1997
4.3 Irrigation projects under construction
4.3.1 Scope and methodology
Irrigation projects are considered to be those irrigable areas, regardless of whether the developer is the central or regional government, where significant public investment has already been made. Of the total irrigable area in the zone, the area considered to be under development is the total irrigable area minus any area that, whether officially declared as being under irrigation or not, has already been irrigated.
Thirty-six areas under construction have been identified, which, grouped by Autonomous Community, are as follows:
| ANDALUSIA: | Baza-Huéscar Northwest Coast of Cadiz Almanzora Caves Joke Genil-Goat Guaro South Andévalo (center) |
|---|
| ARAGON: | Bardenas II (Part 2) Calanda-Alcañiz Canal (Part 1) Cinca Canal (Part 3) and El Tormillo Civan Canal Monegros I (4th section) Monegros II |
|---|
| CASTILLA LA MANCHA: | Albacete Canal La Sagra – Torrijos |
|---|
| CASTILLA Y LEÓN: | La Armuña Las Cogotas (ZR Río Adaja) Left Bank of the Tera Lower Moor Riaño (Porma) Riaño (Payuelos) |
|---|
| CATALONIA: | Aldea-Camarles Alguerri-Balaguer (1st phase) Vallfornés expansion Margalef Muga – Right bank Pla del Sas Perelló-Rasquera Saint Martin of Tous Segarra-Garrigas Xerta-Senia |
|---|
| ESTREMADURA: | Ambroz Center of Extremadura Zújar (Sectors V and VIII) |
|---|
| NAVARRE: | Navarre Canal Mendavia |
|---|
| RIOJA: | Najerilla |
|---|
The irrigable area of Ribera de Fresnedosa (Extremadura), whose transformation has not yet been completed, is not included among the irrigation projects under construction, at the request of the Autonomous Community, because the transfer of water from the Left Bank Canal of the Gabriel y Galán, necessary to complete the area, has been rejected.
In all these areas considered as irrigation projects under construction, a detailed analysis has been carried out in coordination with the Regional Government, according to the following methodology:
- Background data: compilation and analysis of graphic and documentary information from:
* General Transformation Plans
* Coordinated Works Plans
* Thematic studies of the physical environment: climate, soils, water
* Environmental Impact Studies
* Sectoral Studies of the PNR.
* Construction projects
* Crop alternatives
* Schedules of actions by the Central and Regional Administrations
- Study of irrigable areas
* Controlled area and irrigable area
* Current state of the works
* Currently irrigated area
* Transformation slope
* Investments made by the Central and Regional Administrations
* Current pace of transformation
It should be noted that the areas finally irrigated, both in the case of irrigable areas under construction, and in irrigations of social interest, may be altered in some specific cases due to reasons of availability of water resources, environmental considerations or other special circumstances.
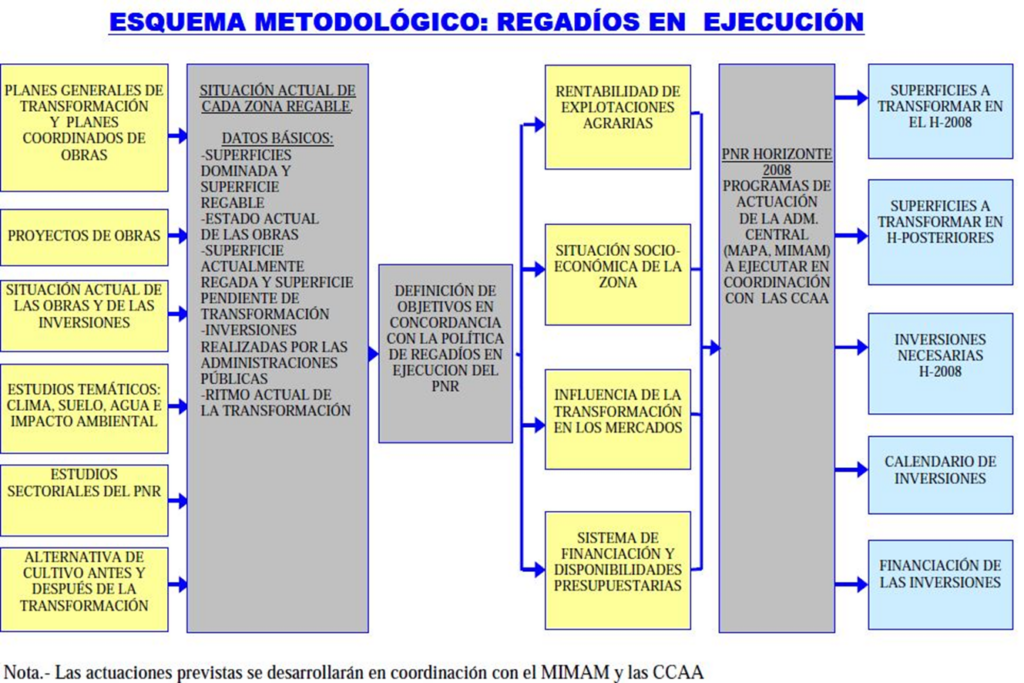
4.3.2 Administrative situation of the zones
The legal basis for the actions being taken in the irrigated areas under development, within the scope of each Autonomous Community, is as follows:
Andalusia: Prior to the Royal Decree on transfers (June 16, 1984), the irrigated areas of the Northwest Coast of Cádiz, Cuevas de Almanzora, Genil-Cabra, and Guaro were declared Areas of National Interest. The Chanza area was declared an Area of General Interest of the Nation after the Royal Decree on transfers. The Baza-Huéscar area is an Area of General Interest of the Autonomous Community, while the area defined as South Andévalo (central) is being developed at the initiative of the farmers, with financial assistance from the Autonomous Community. The headworks have been completed and financed by the Guadiana River Basin Authority.
Aragon: The six zones, Bardenas II, Calanda Canal – Alcañiz, Cinca Canal (3rd part), Civán Canal, Monegros I (4th section) and Monegros II are declared of National Interest prior to the transfers (10-5-85).
Castilla – La Mancha: Of the two areas included as irrigation projects under construction, Canal de Albacete is declared to be of General Interest to the Nation, and La Sagra – Torrijos is of National Interest.
Castilla y León: The areas on the Left Bank of the Tera River and the Riaño area have been declared of National General Interest, following the Royal Decree on the transfer of powers. The Las Cogotas irrigation zone (Adaja River Irrigation Zone) has been declared of General Interest to the Autonomous Community. In La Armuña, the Comprehensive Development Plan for the Tormes River Basin, approved by the Council of Ministers in 1961, is being implemented, while the Páramo Bajo area is included in the Duero River Basin Hydrological Plan.
Catalonia: The Alguerri-Balaguer, Muga-Right Bank, and Aldea-Camarles areas have been declared of National Interest; while in the Margalef, Perelló-Rasquera, San Martín de Tous, and Valfornés areas, action is being taken in accordance with the legislation on land management zones. The Segarra-Garrigas irrigation zone has had the construction of the Main Canal declared of National General Interest, with its conversion to irrigated land included in the Ebro River Basin Management Plan. The Pla del Sas area is being processed in accordance with the Catalan Irrigation Law, and the Xerta-Senia area according to the Ministerial Order that authorized the perpetual water concession for this zone.
Extremadura: The Central Extremadura area is declared of General Interest to the Nation, while the irrigated areas of Ambroz and Zújar are declared of National Interest.
Navarre: The irrigation zone of the Navarre Canal has been declared to be of General National Interest for the construction of the canal, while the transformation of the area is declared to be of Regional Interest by Regional Law. The Mendavia irrigation zone is declared to be of National Interest.
Rioja: The Najerilla area is being transformed by the Water Administration in accordance with the Public Works Law of 1939.
As a summary of the provisions on which the actions in the different areas are based, we have:
| ZONES ACCORDING TO LEGISLATION | Number of Zones |
|---|---|
| Areas declared to be of General Interest to the Nation | 6 |
| Areas declared of National Interest | 16 |
| Areas declared of interest by the Autonomous Community | 2 |
| Farm Management Zones | 4 |
| Public Works Legislation (Najerilla and South Andévalo-center) | 2 |
| Comprehensive Development Plan for the Tormes River (La Armuña) | 1 |
| Regional Legislation | 3 |
| Without Legislation (Páramo Bajo and Segarra-Garrigas) | 2 |
| TOTAL | 36 |
4.3.3 Current status of irrigation projects under construction
The analysis carried out with the indicated methodology has been performed in the aforementioned 36 zones, whose distribution of irrigable, irrigated and pending transformation areas by Autonomous Community is as follows:
| Autonomous Community | Irrigable surface (ha) | Irrigated area (ha) | Transfer pending area (ha) |
|---|---|---|---|
| Andalusia | 115.576 | 54.847 | 60.729 |
| Aragon | 122.356 | 47.841 | 74.515 |
| Castilla-La Mancha | 55.660 | 1.015 | 54.645 |
| Castile and León | 128.857 | 15.494 | 113.363 |
| Catalonia | 111.980 | 2.496 | 109.484 |
| Estremadura | 38.299 | 17.026 | 21.273 |
| Navarre | 60.761 | 1.861 | 58.900 |
| Rioja | 18.788 | 10.380 | 8.408 |
| Total | 652.277 | 150.960 | 501.317 |
This chapter includes for each zone a summary sheet with the following data and current status:
- Situation of the area
- Origin and quality of waters
- Irrigation application system and allocation
- Area dominated, irrigable, irrigated and transformation slope
- Soil and type of land
- Climate
- Current and future alternative
- Social characteristics
- Current status of the works
- Proposed action
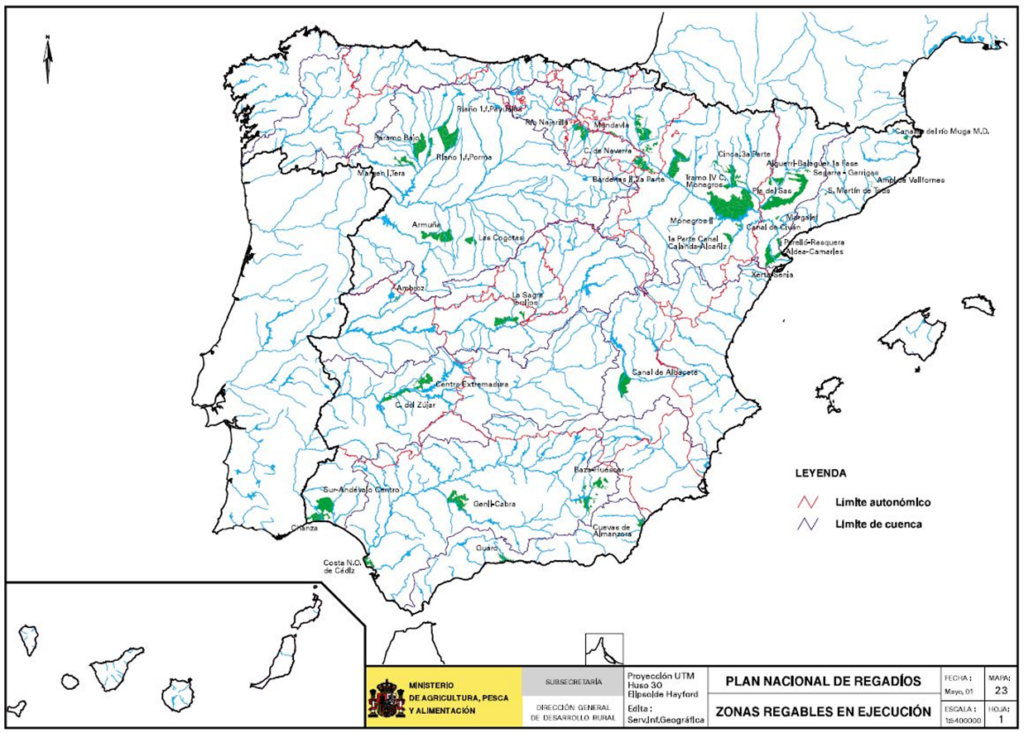
IRRIGATION AREAS UNDER CONSTRUCTION IN THE AUTONOMOUS COMMUNITY OF ANDALUSIA:
BAZA-HUESCAR
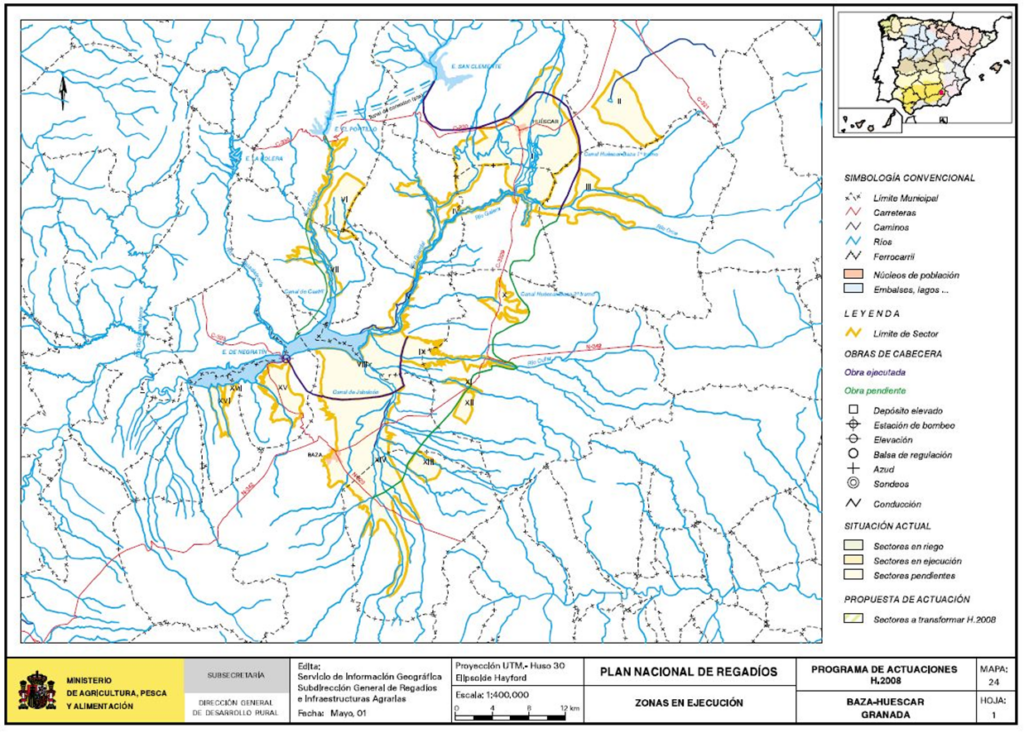
NORTHWEST COAST OF CADIZ
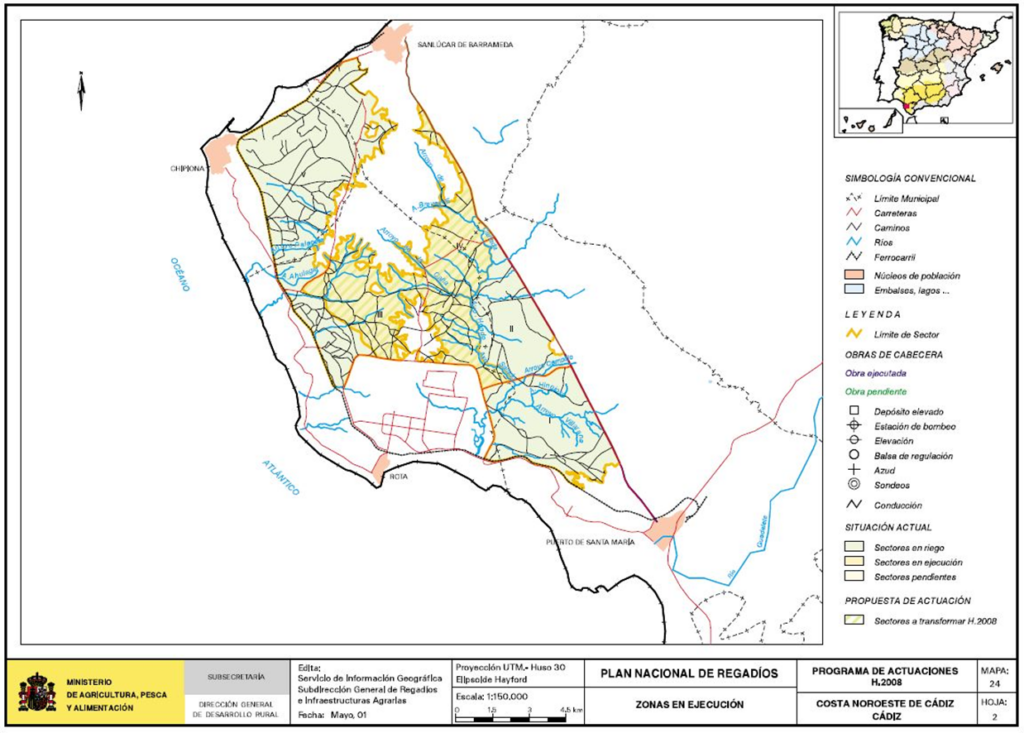
ALMANZORA CAVES
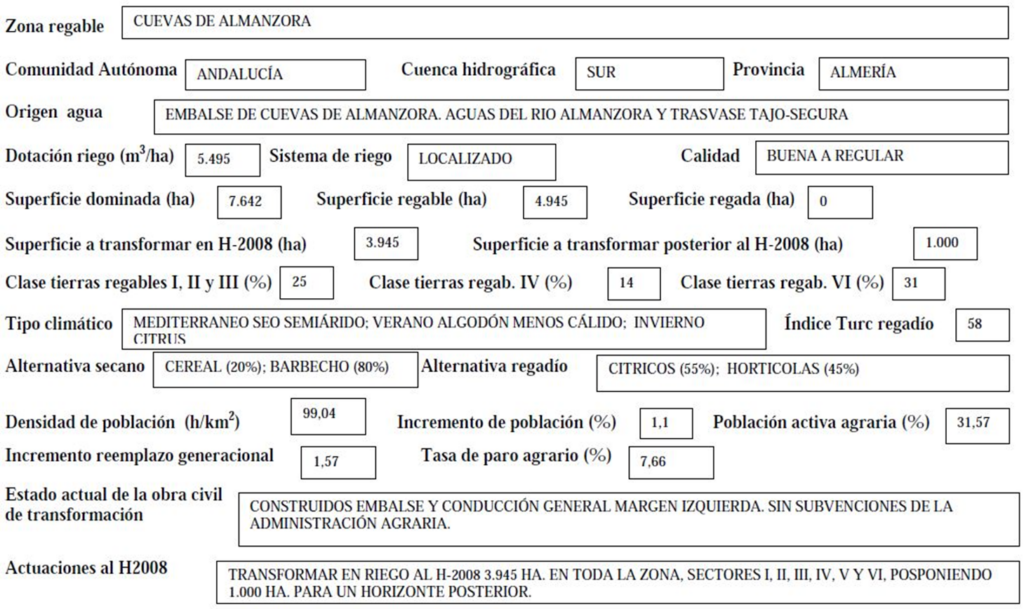
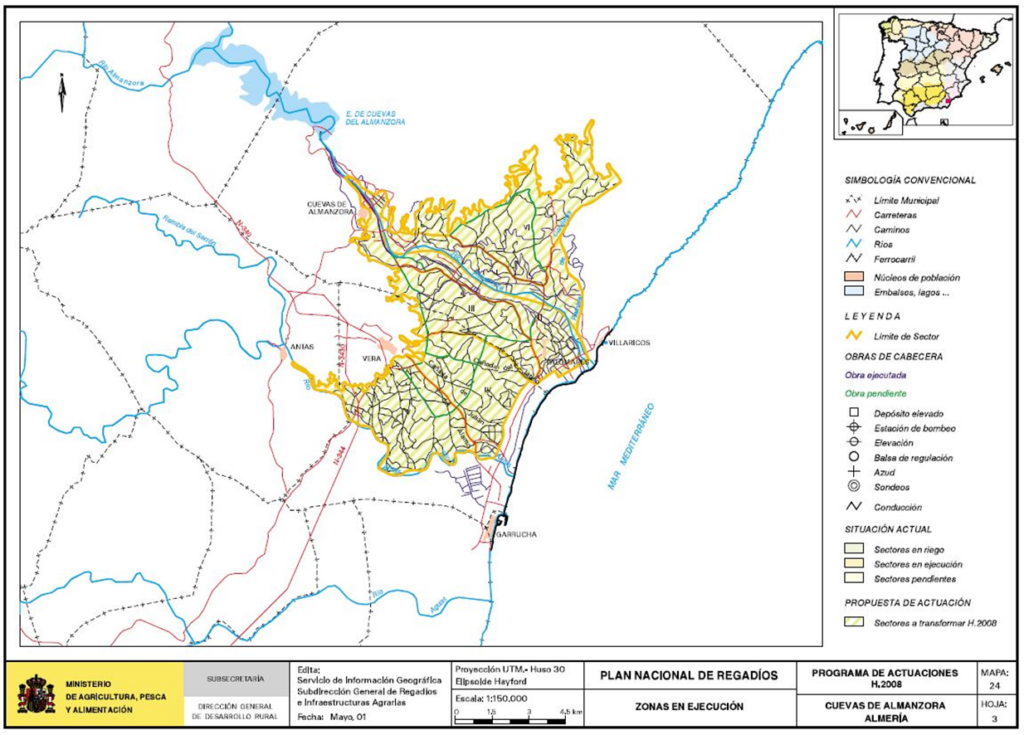
JOKE
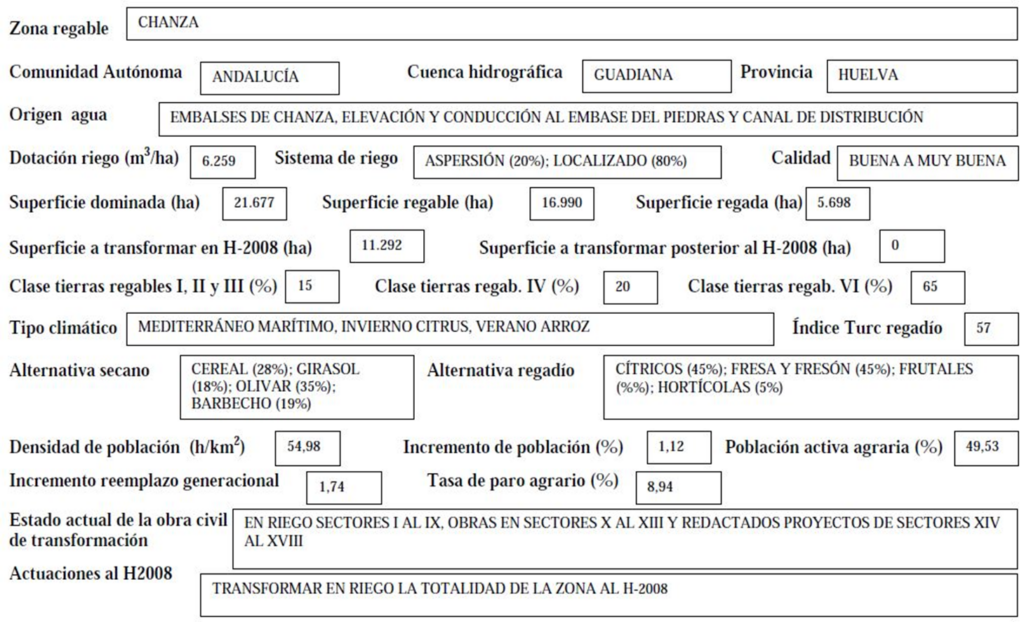
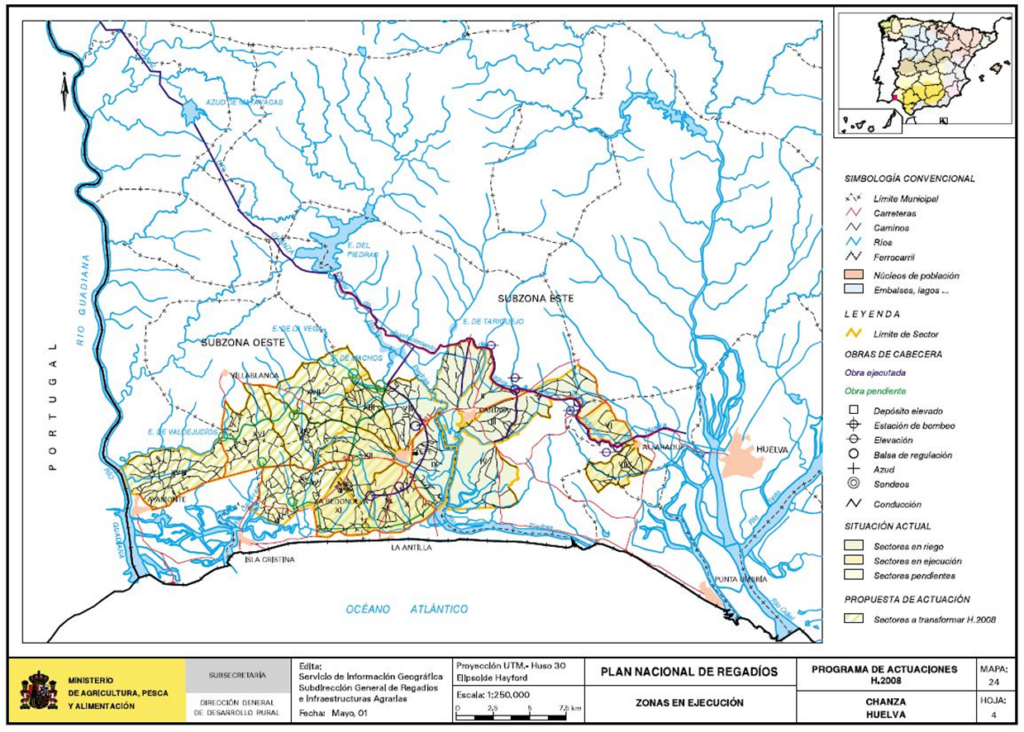
GENIL-GOAT
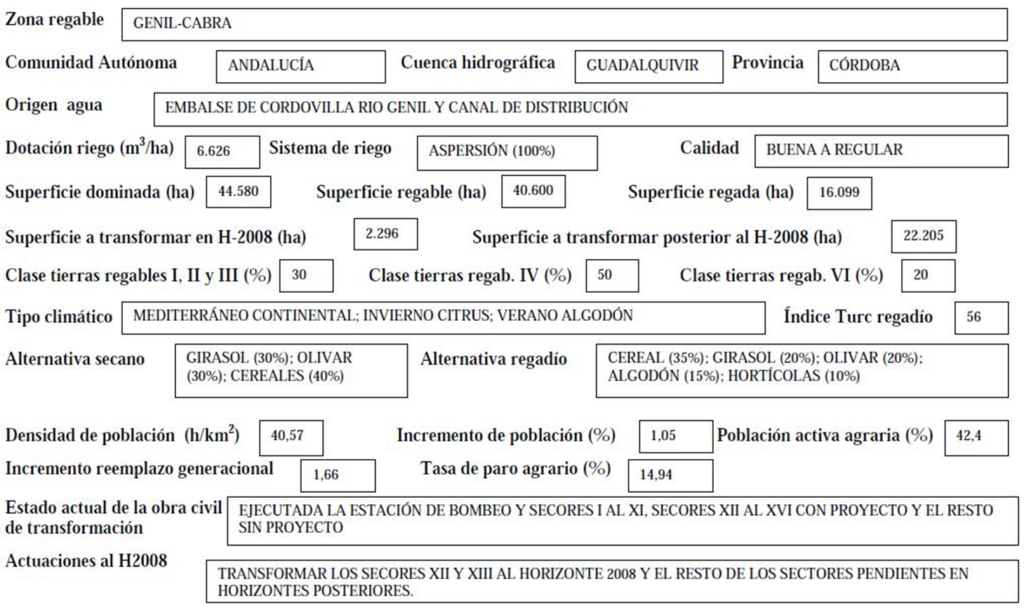
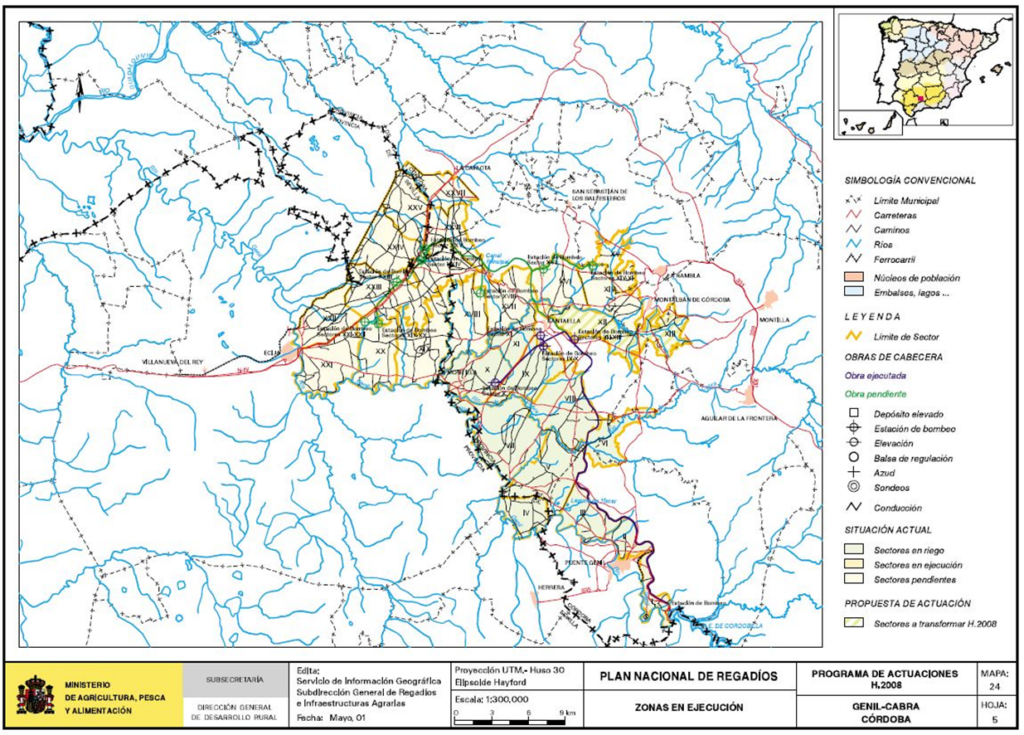
GUARO RIVER
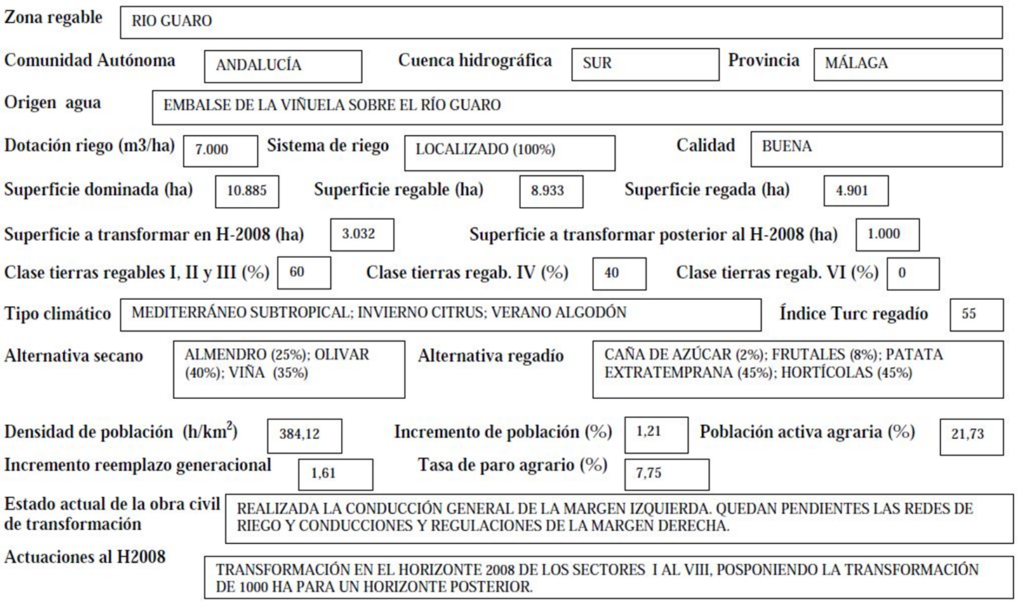
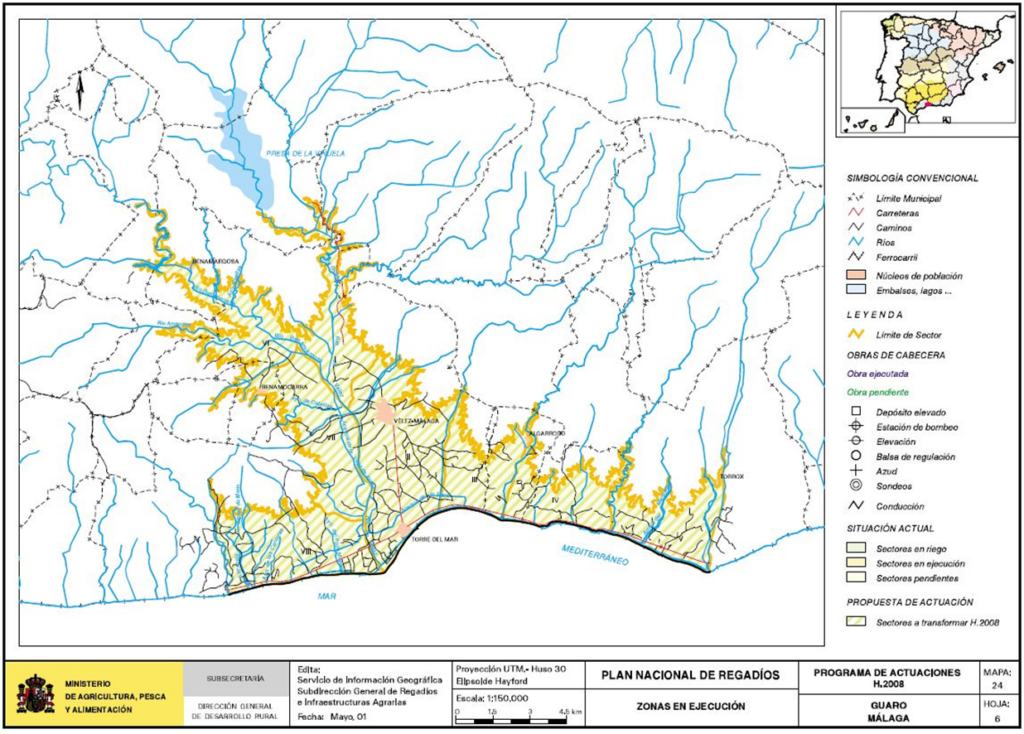
SOUTH ANDÉVALO-CENTER
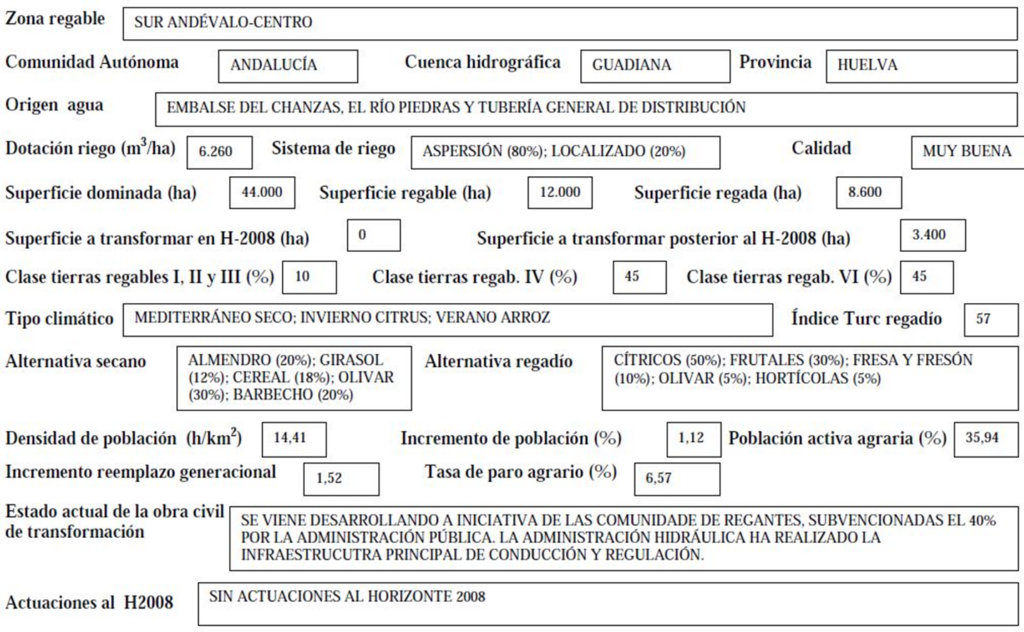
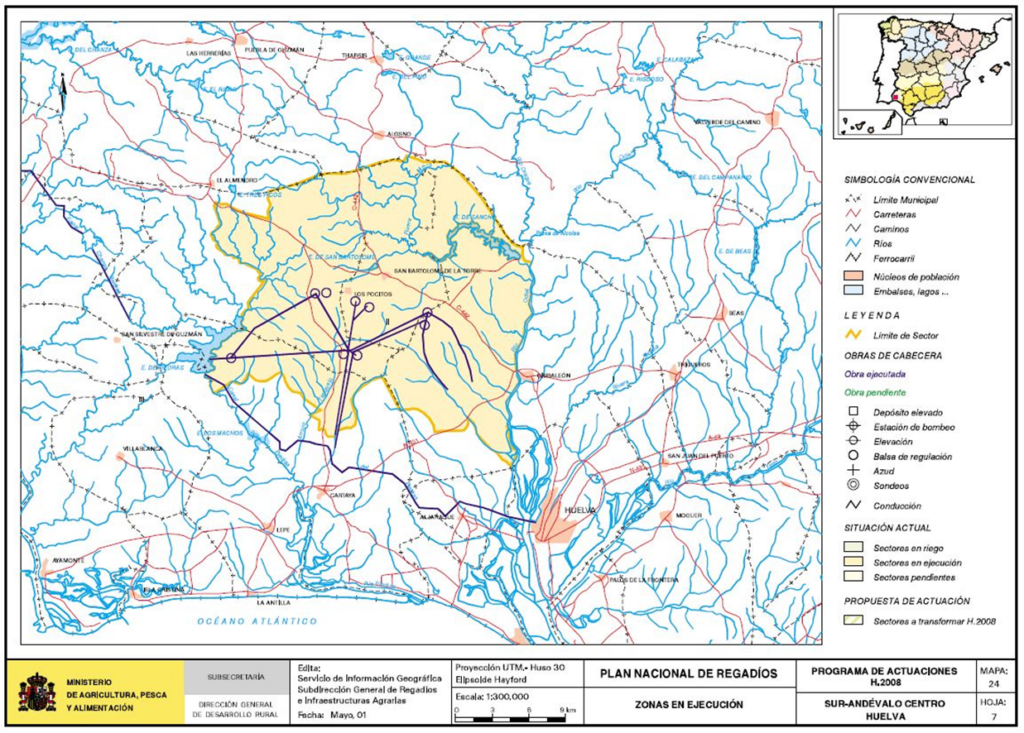
IRRIGATION AREAS UNDER CONSTRUCTION IN THE AUTONOMOUS COMMUNITY OF ARAGON:
BÁRDENAS II (2to PART)
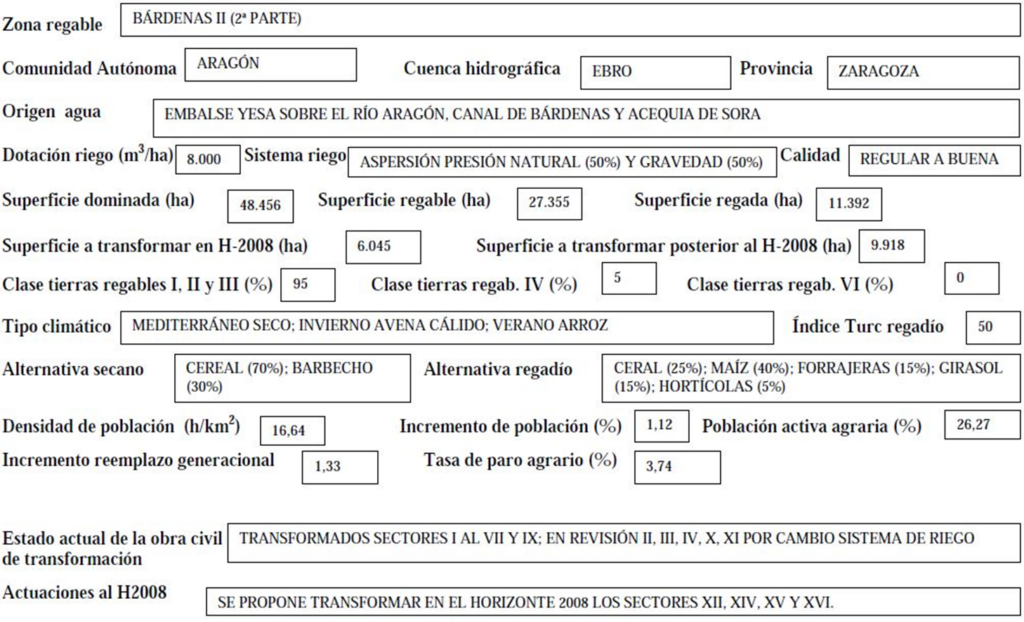
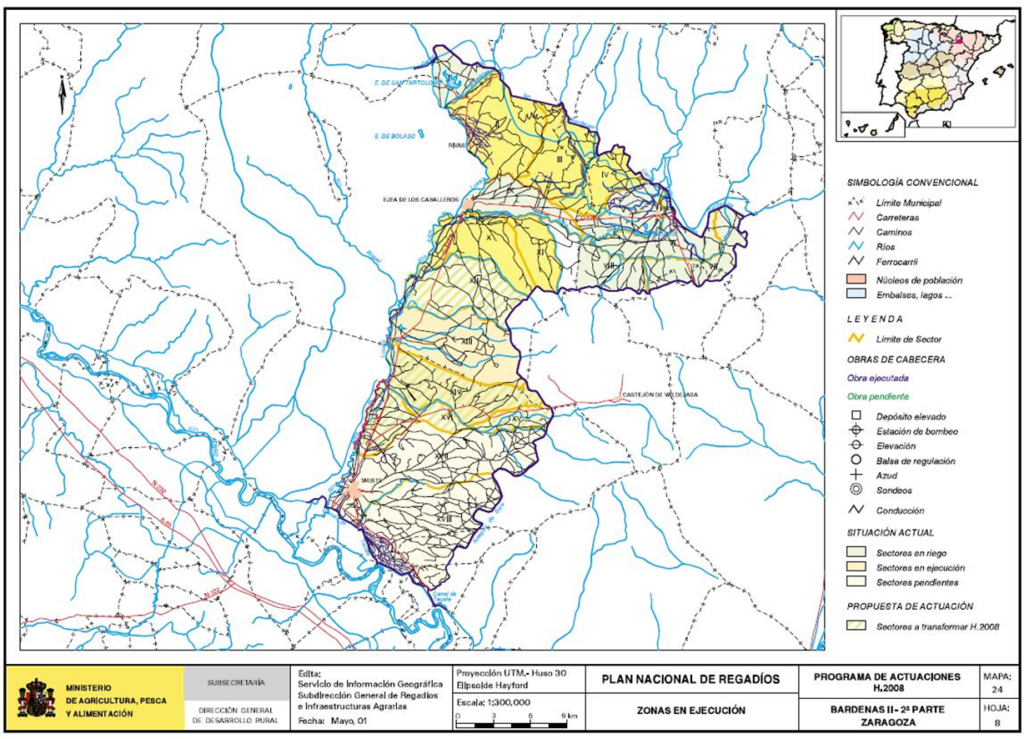
CALANDA-ALCAÑIZ CANAL (1to PART)
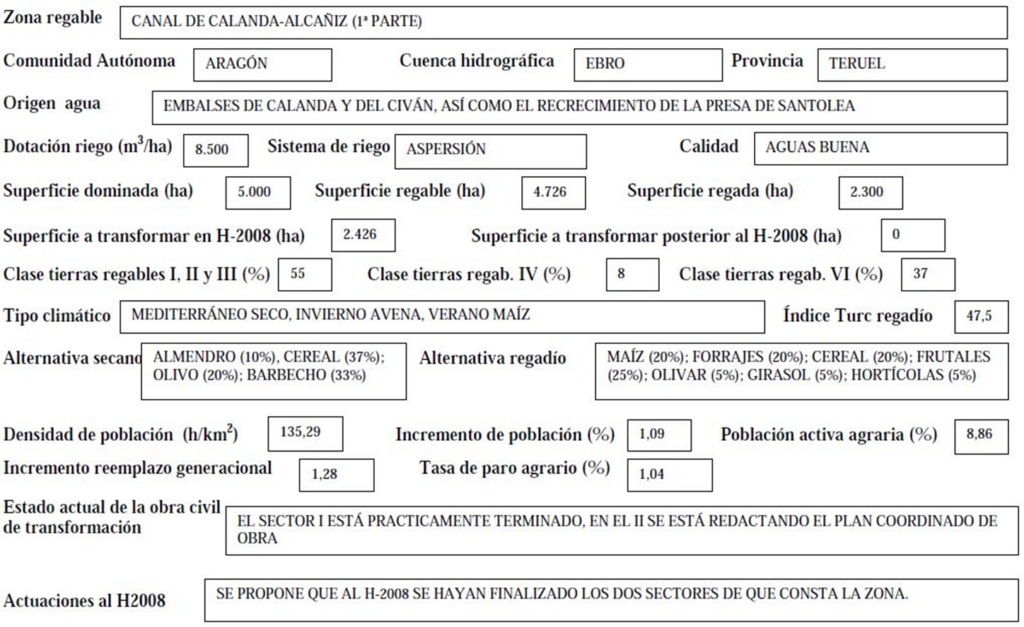
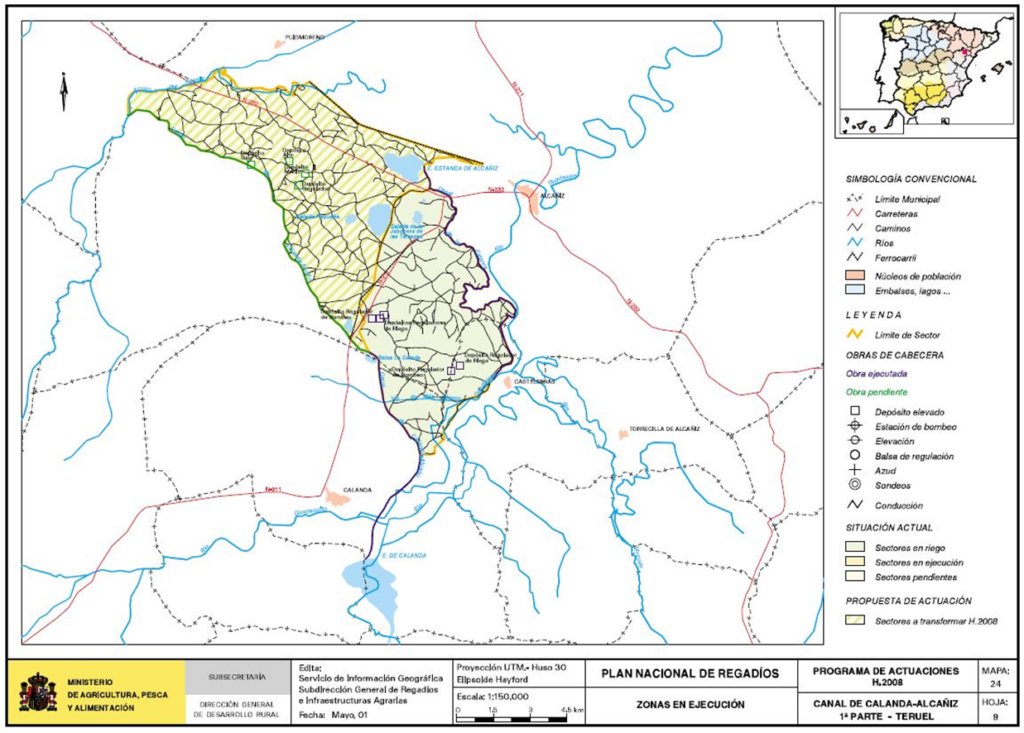
CIVÁN CANAL
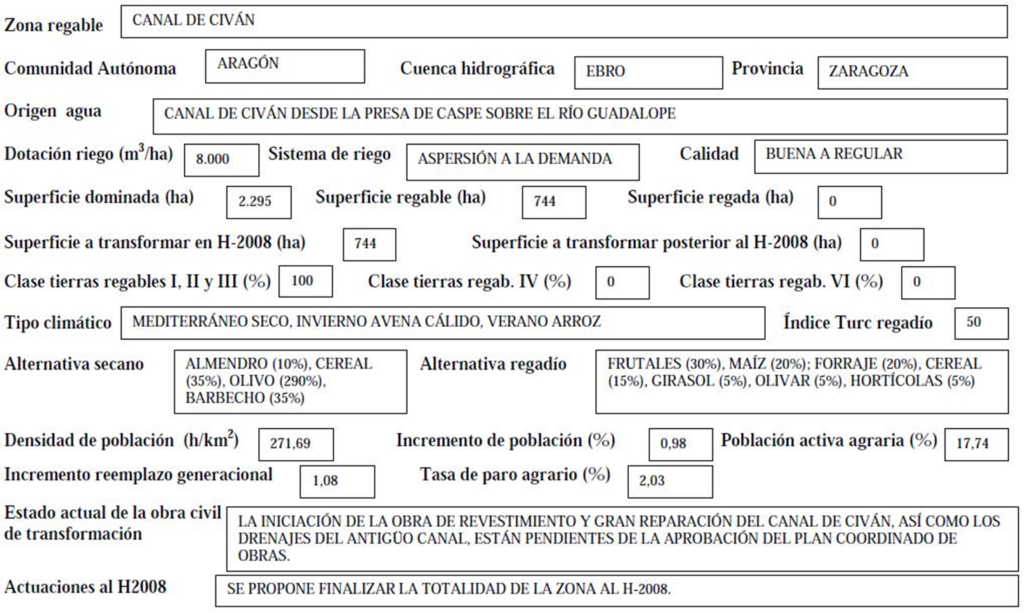
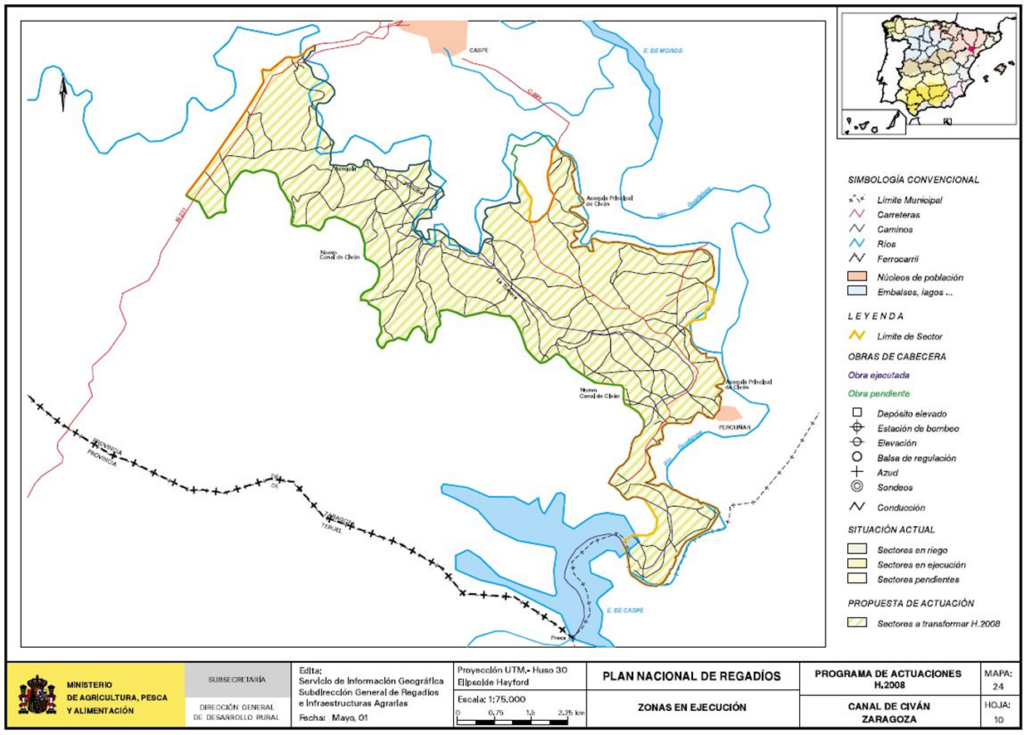
CINCA CANAL- 3to PART
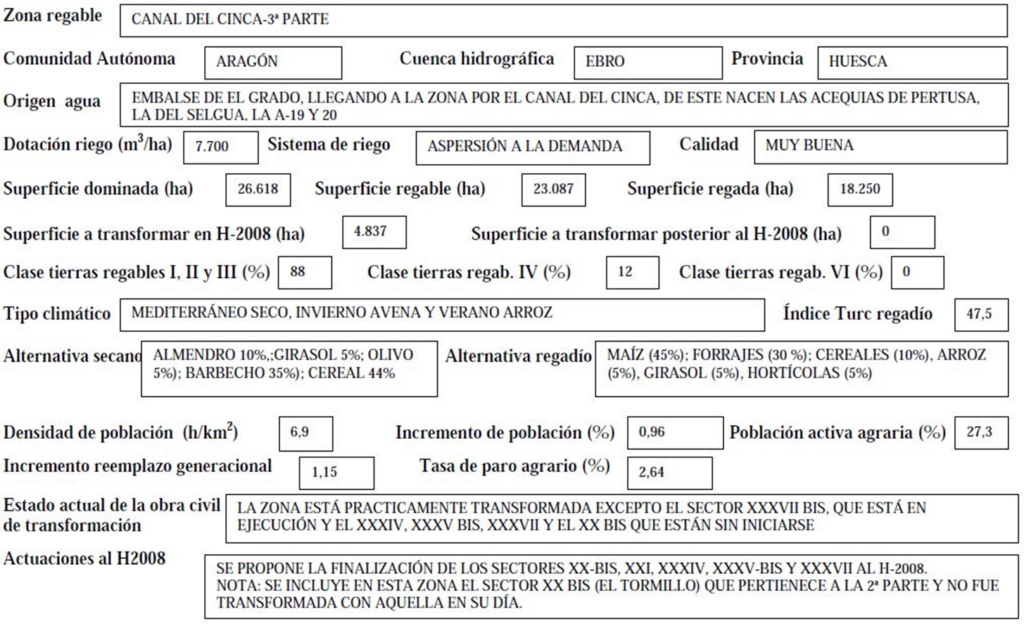
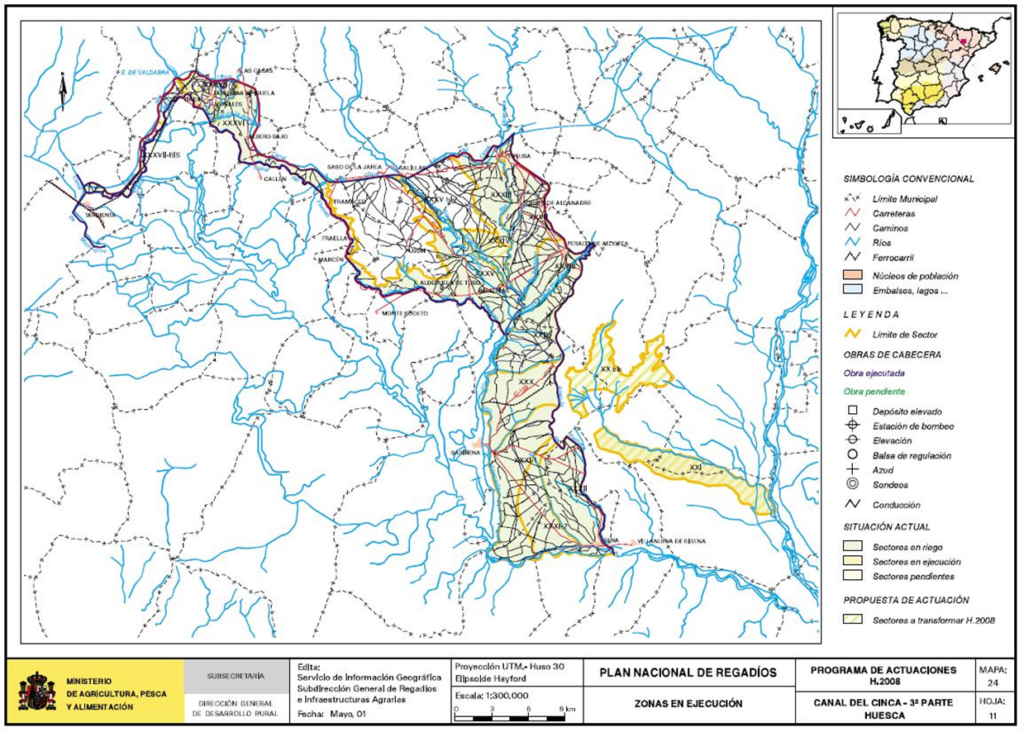
MONTENEGRO I. 4either SECTION
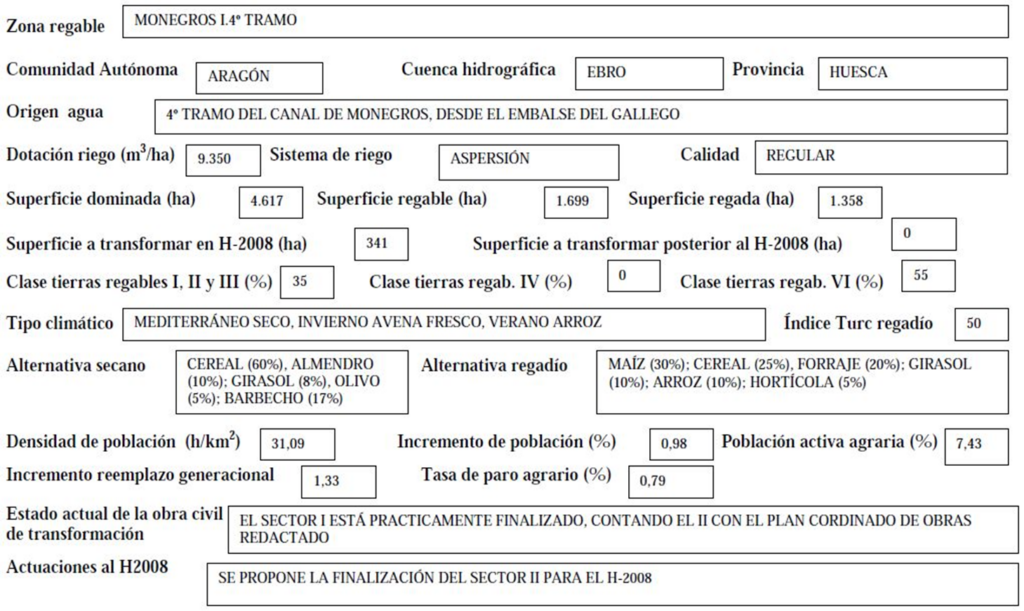
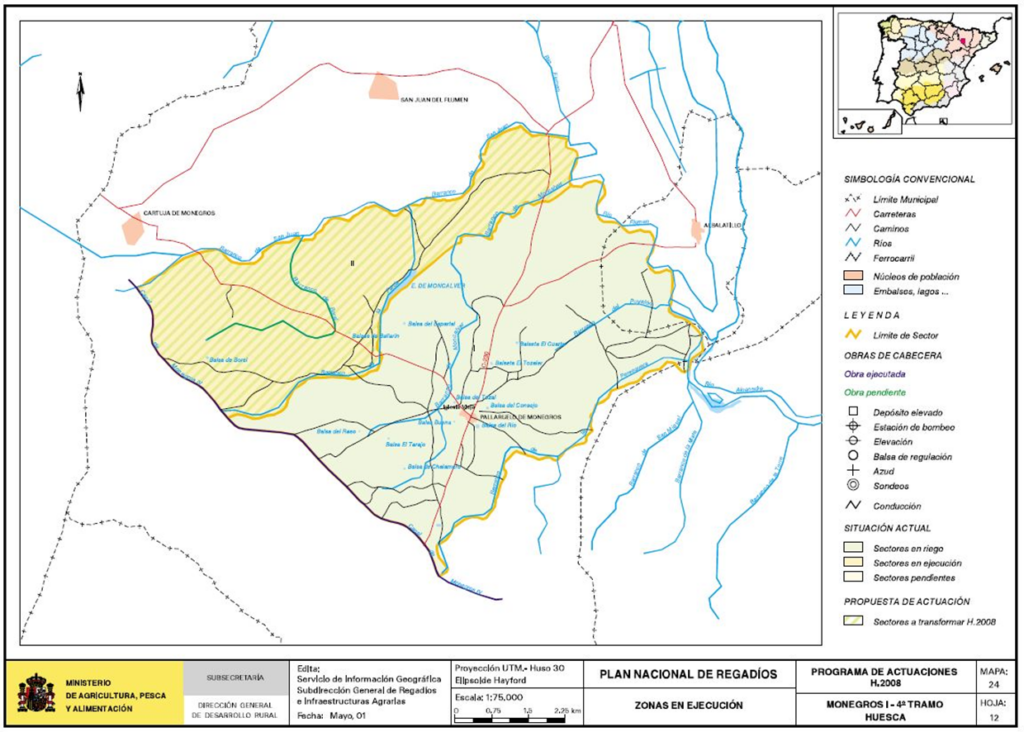
MONTENEGROS II
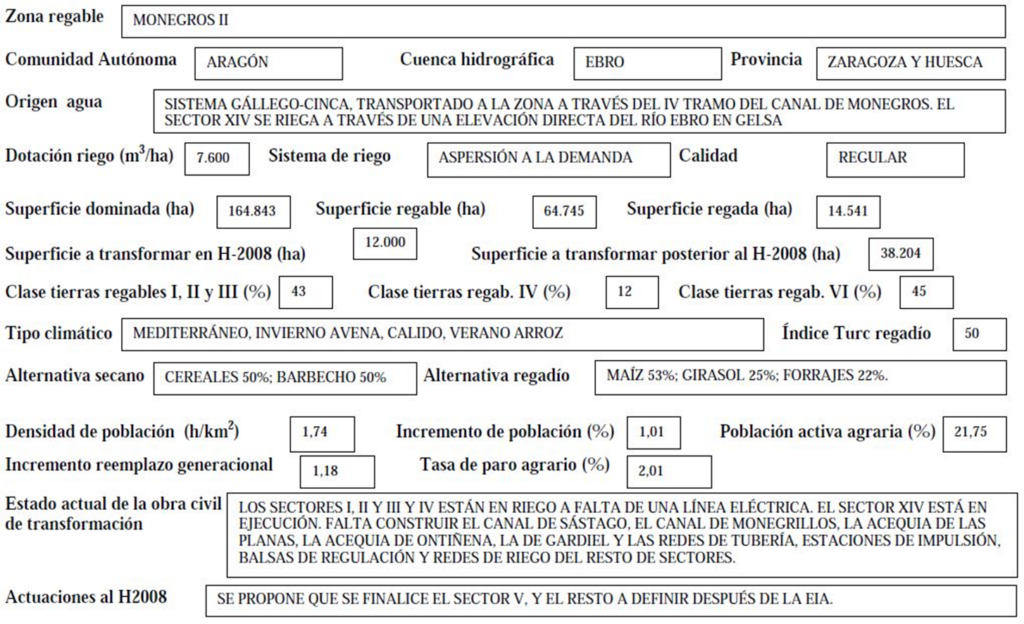
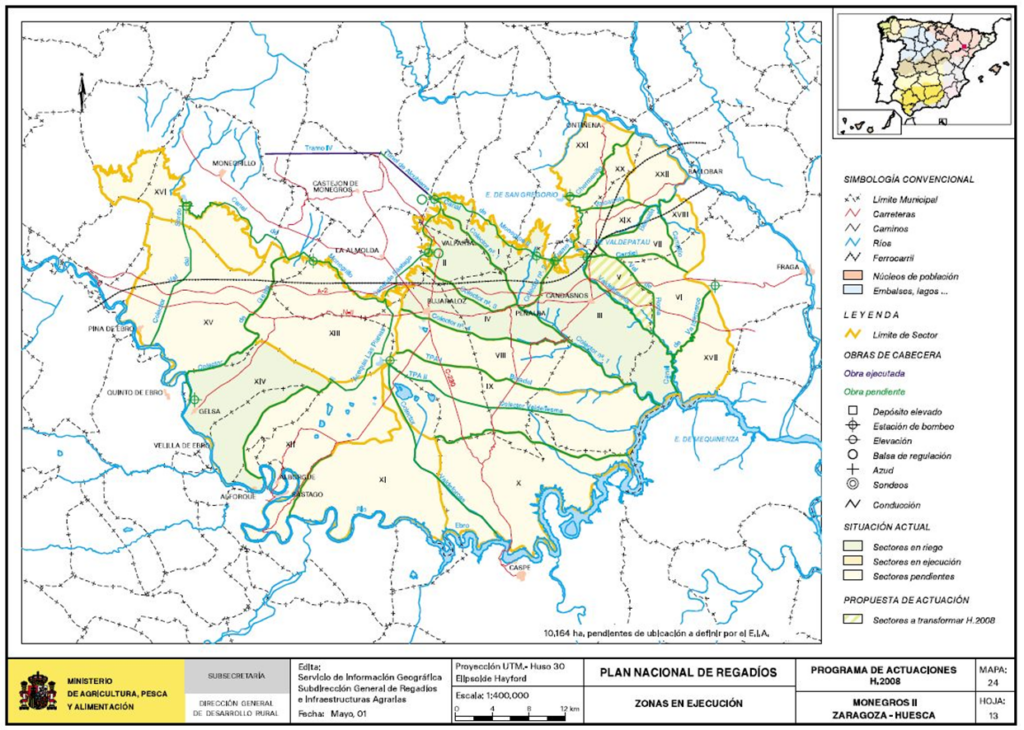
IRRIGATION AREAS UNDER CONSTRUCTION IN THE AUTONOMOUS COMMUNITY OF CASTILLA Y LEÓN:
THE ARMUNE
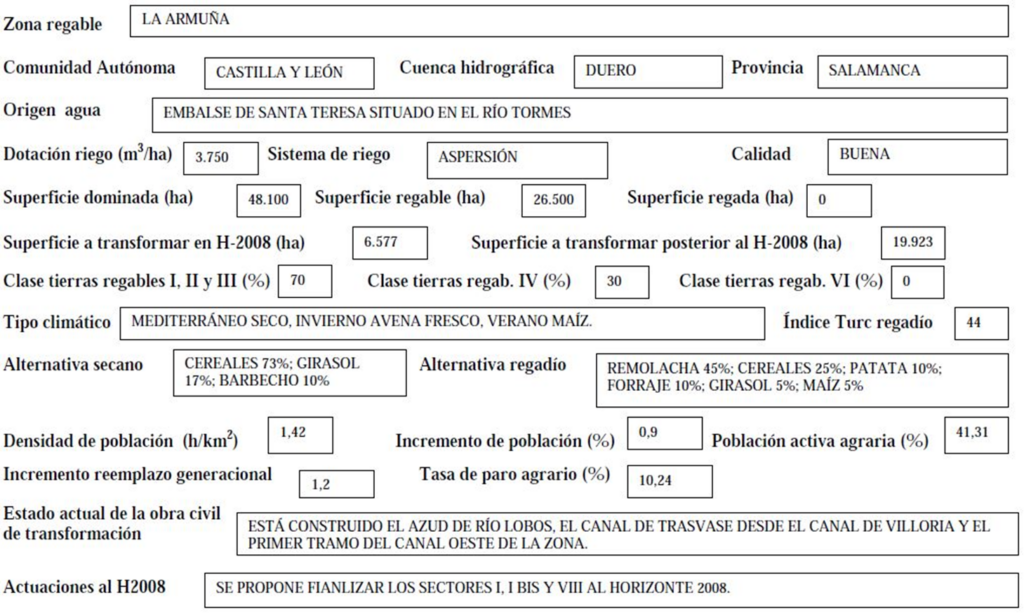
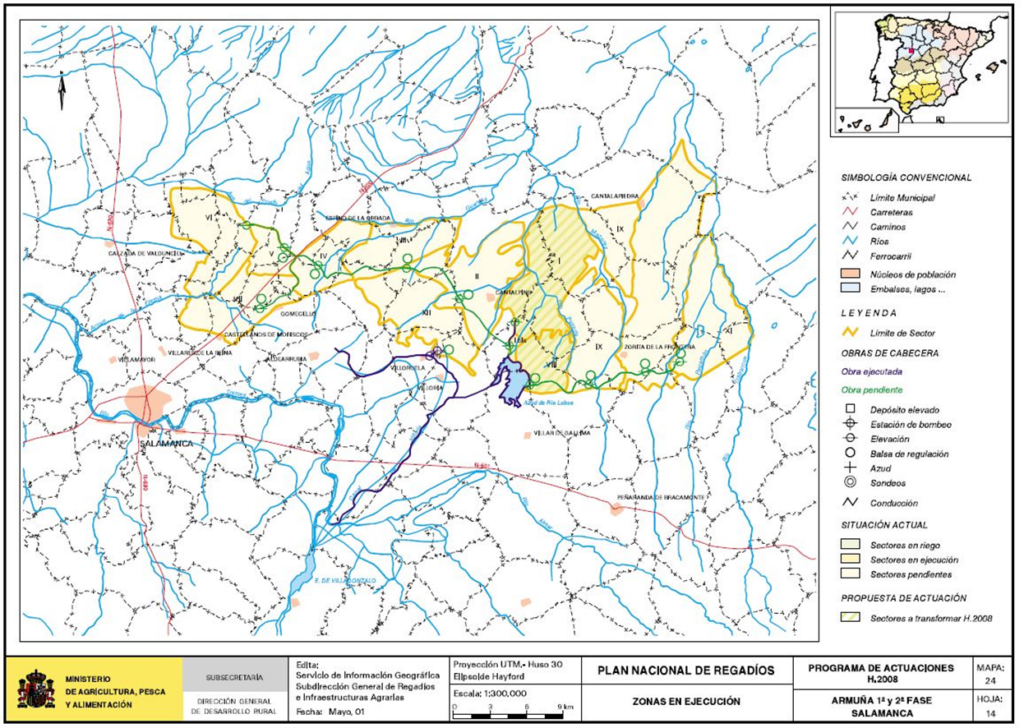
LAS COGOTAS (ZR RÍO ADAJA)
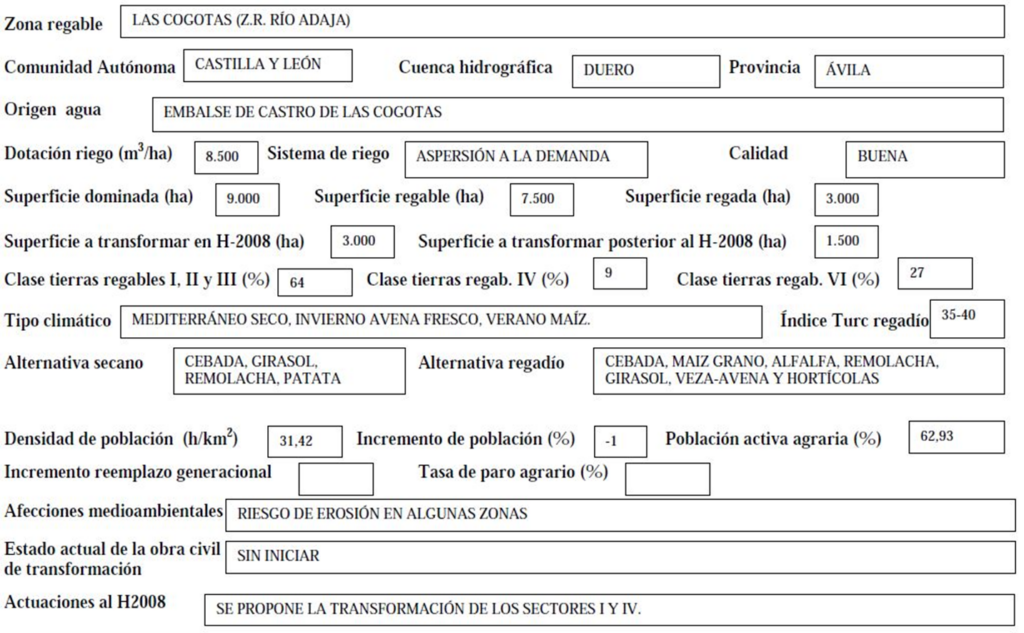
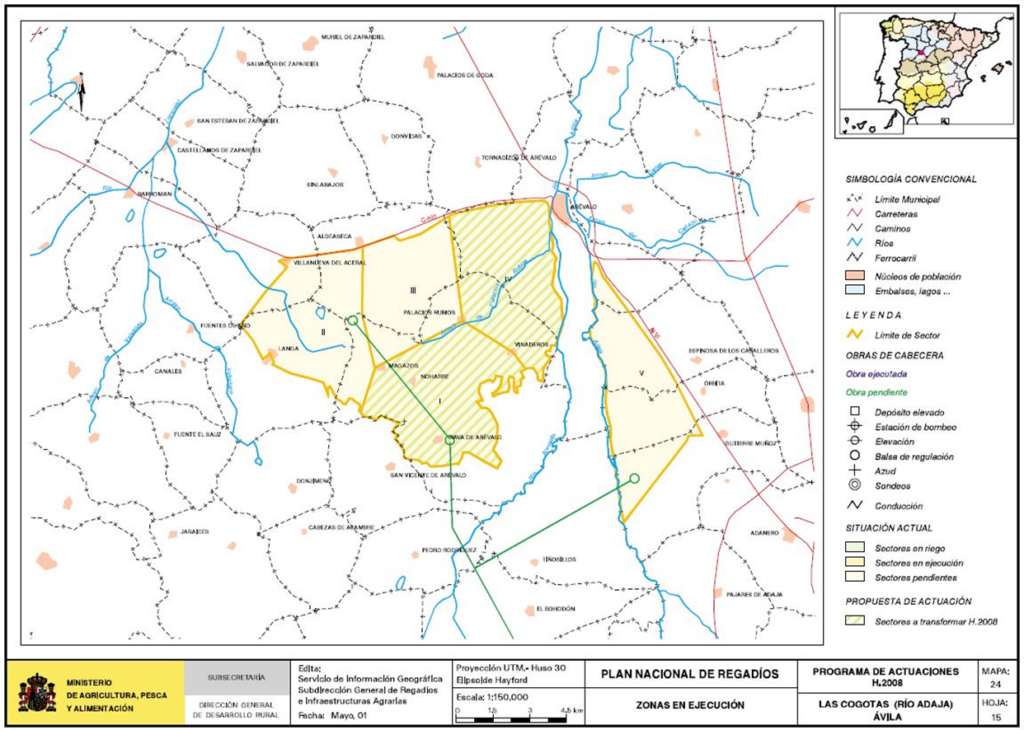
LEFT BANK OF THE TERA
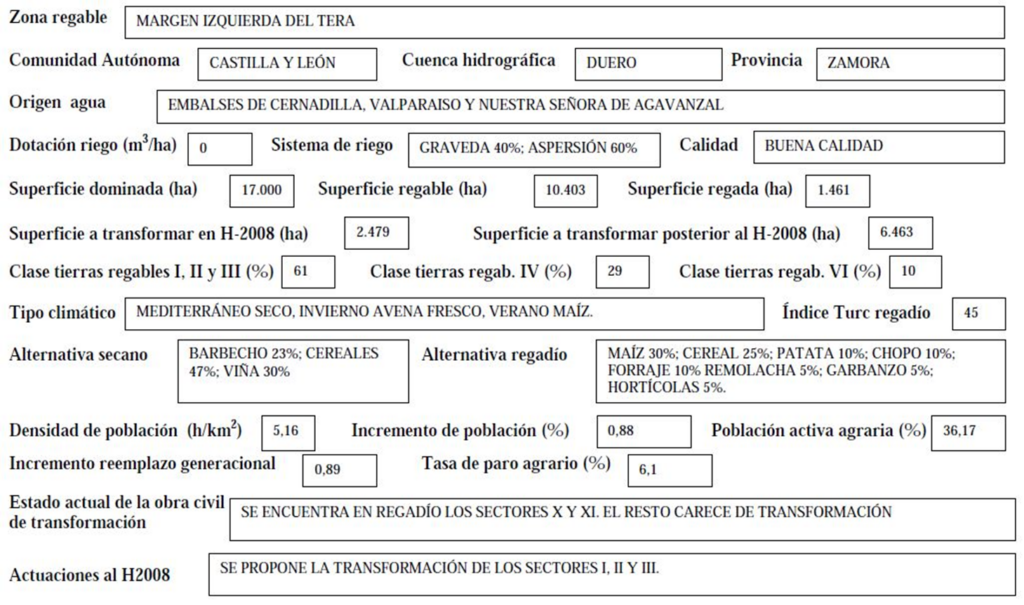
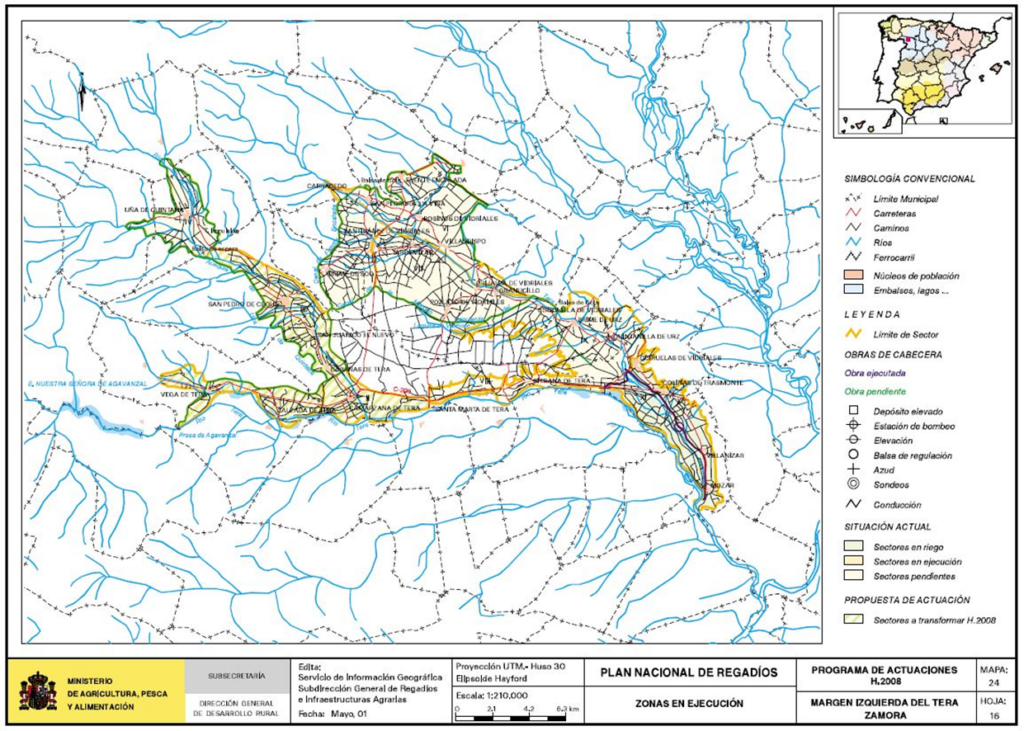
LOWER PARAMO
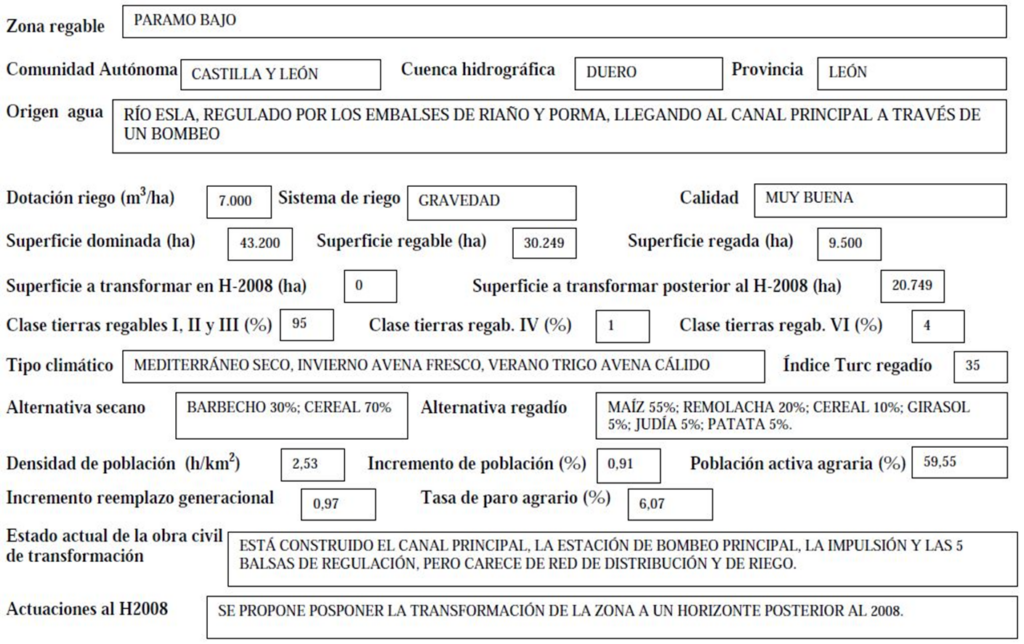
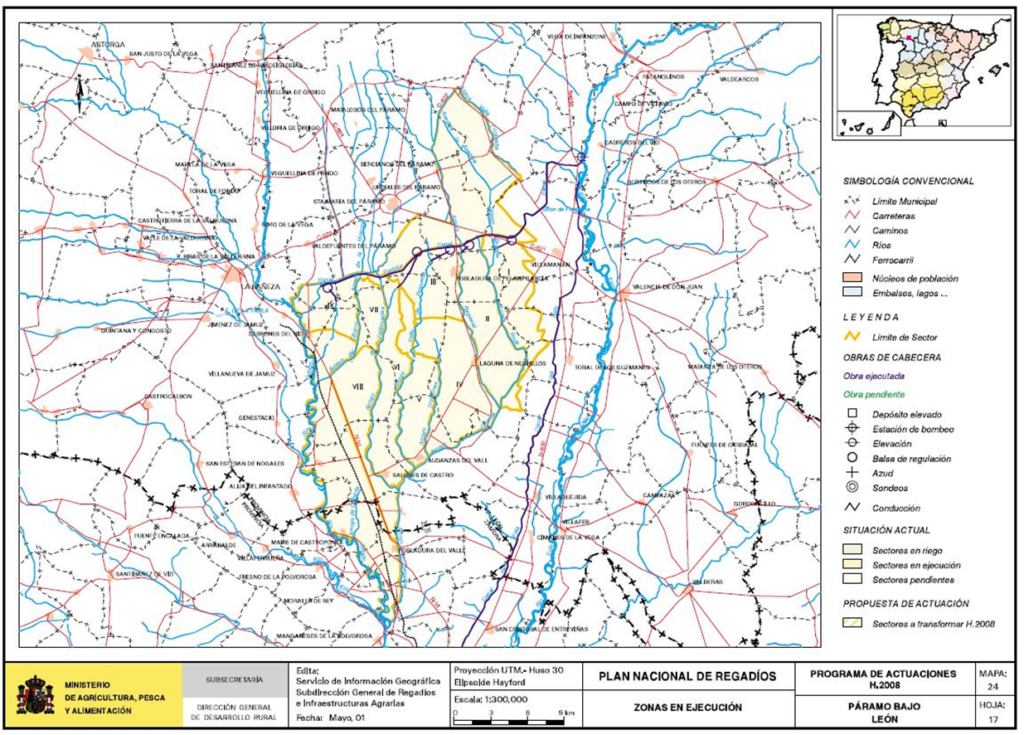
RIAÑO
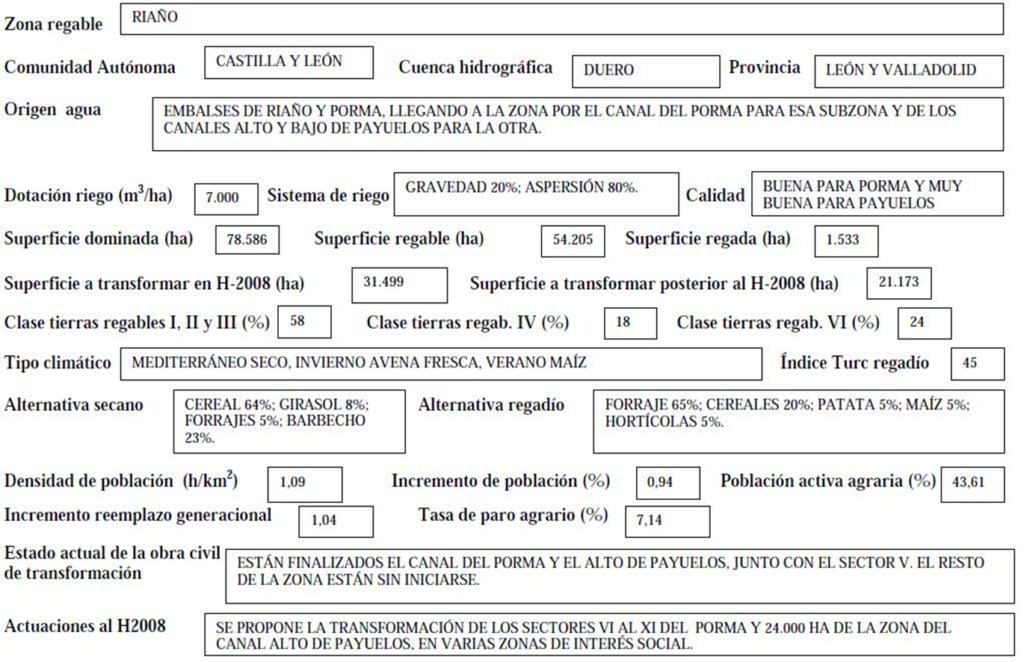
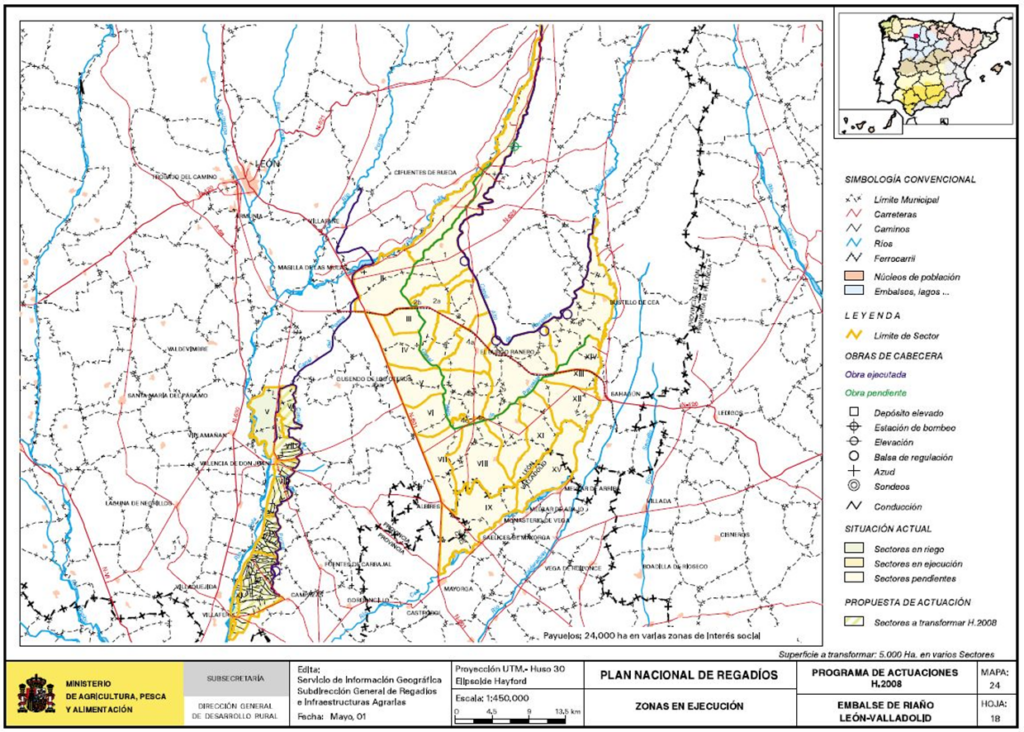
IRRIGATION AREAS UNDER CONSTRUCTION IN THE AUTONOMOUS COMMUNITY OF CASTILLA-LA MANCHA:
ALBACETE CANAL
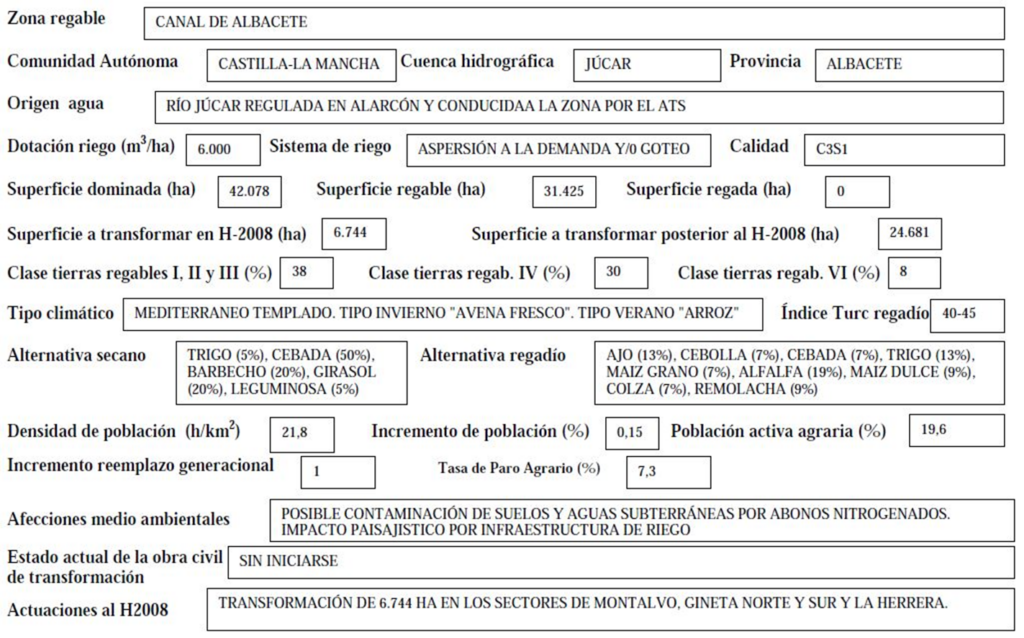
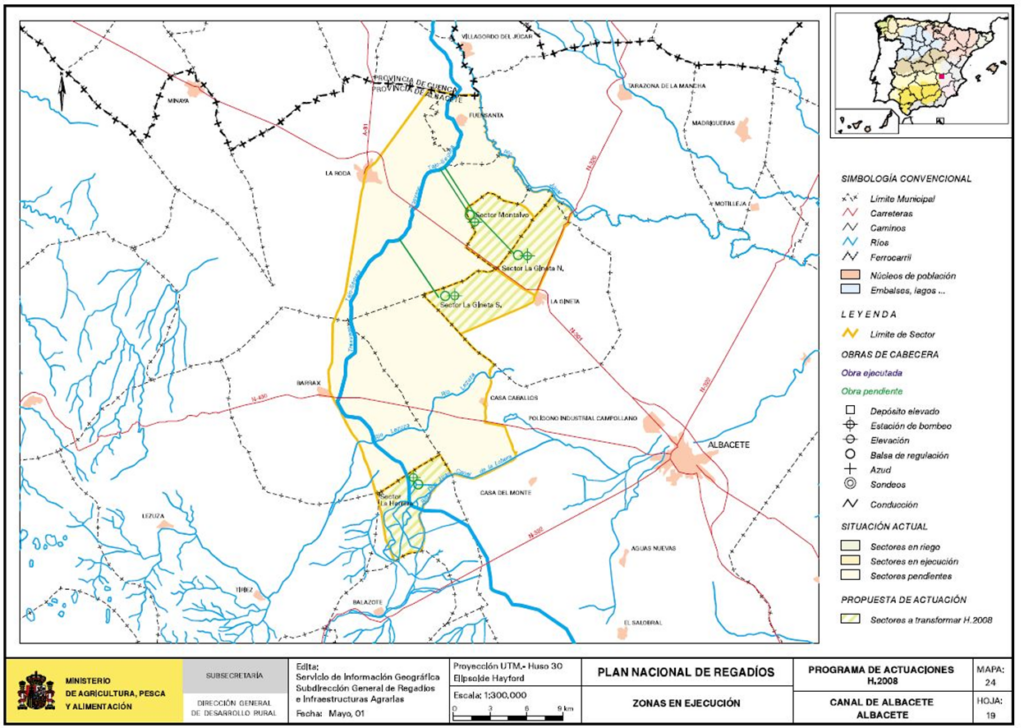
LA SAGRA- TORRIJOS
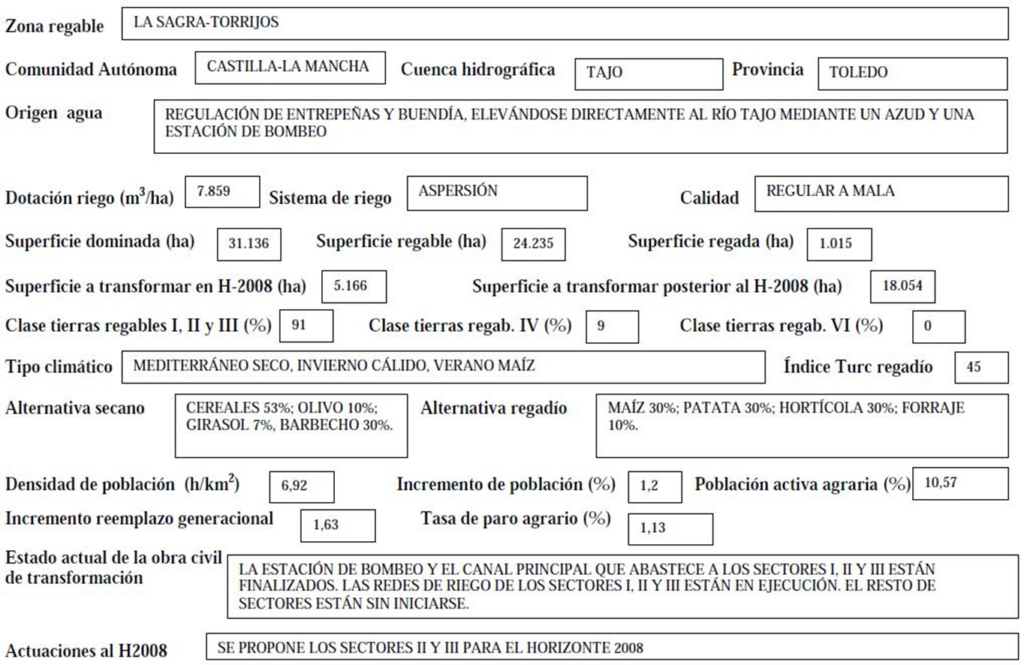
IRRIGATED AREAS UNDER CONSTRUCTION IN THE AUTONOMOUS COMMUNITY OF CATALONIA:
VILLAGE- CAMARLES
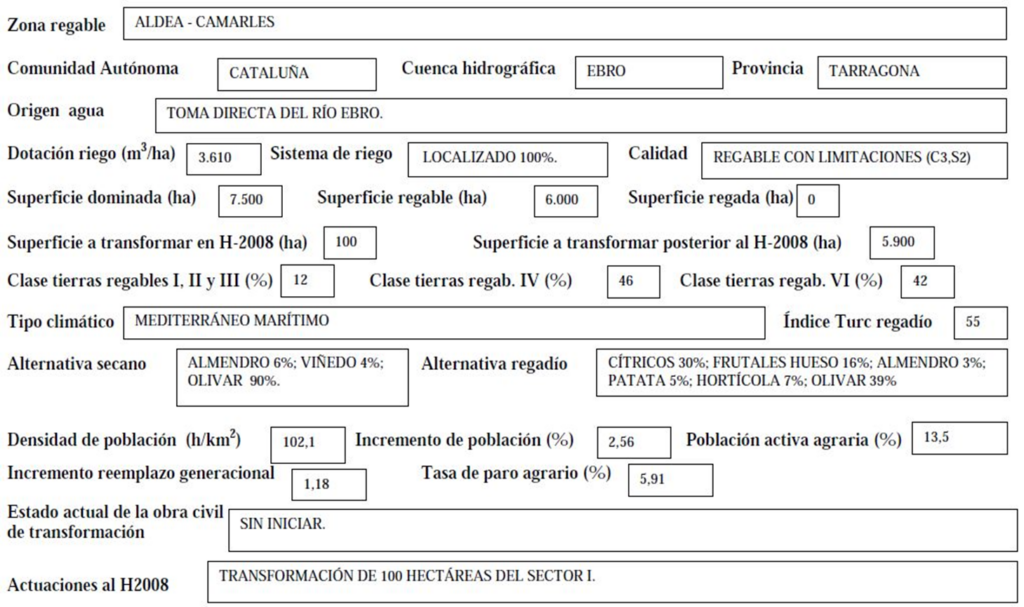
ALGUERRI- BALAGUER 1to PHASE
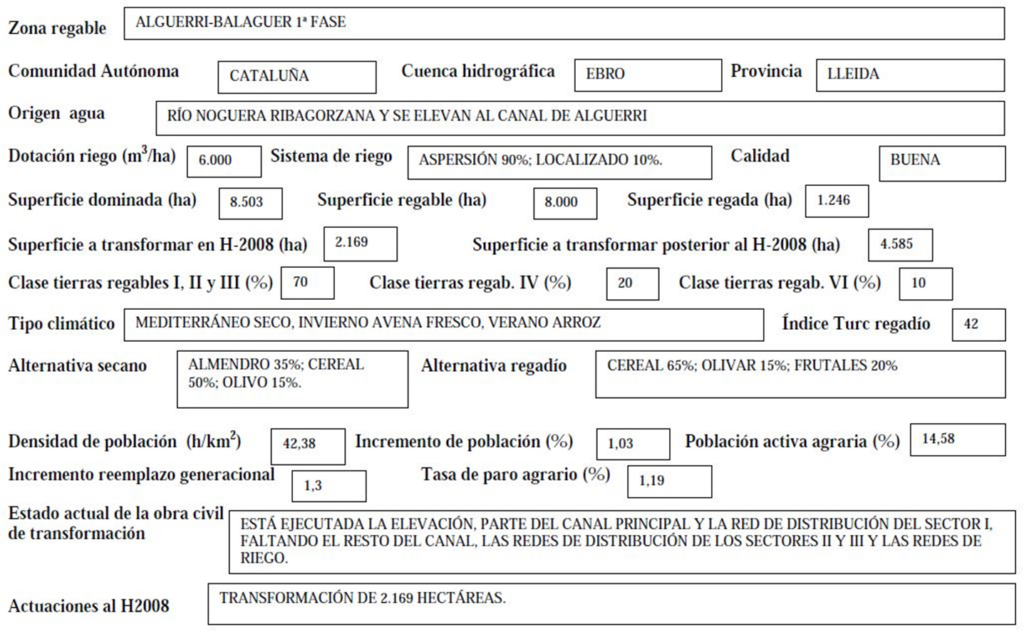
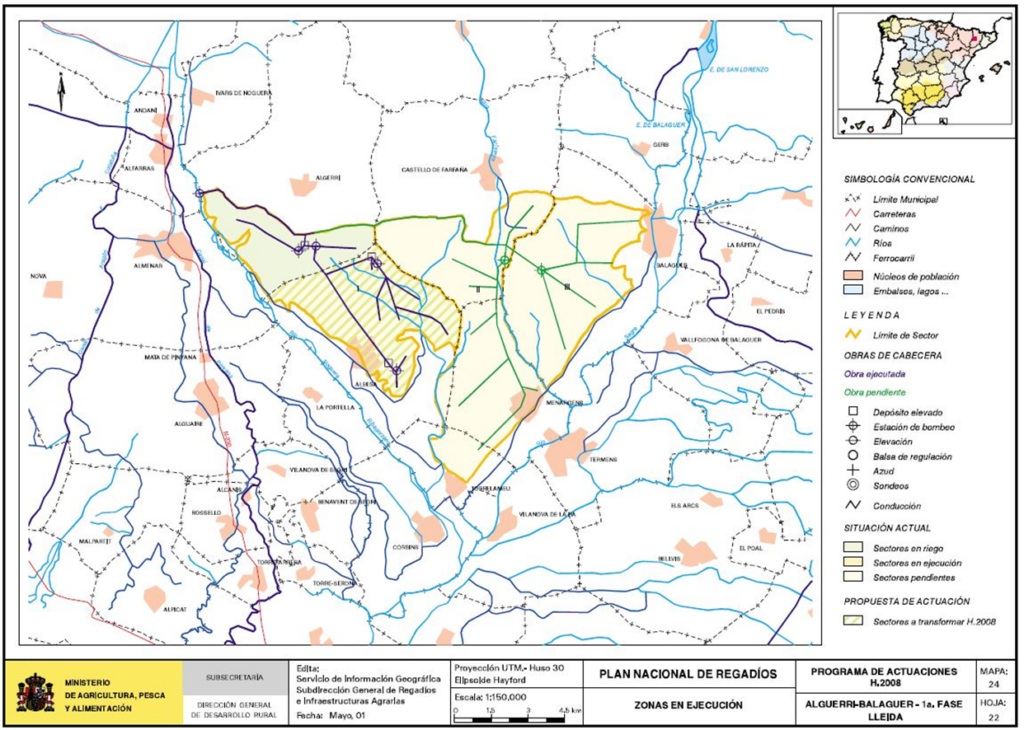
VALLFORNÉS EXTENSION
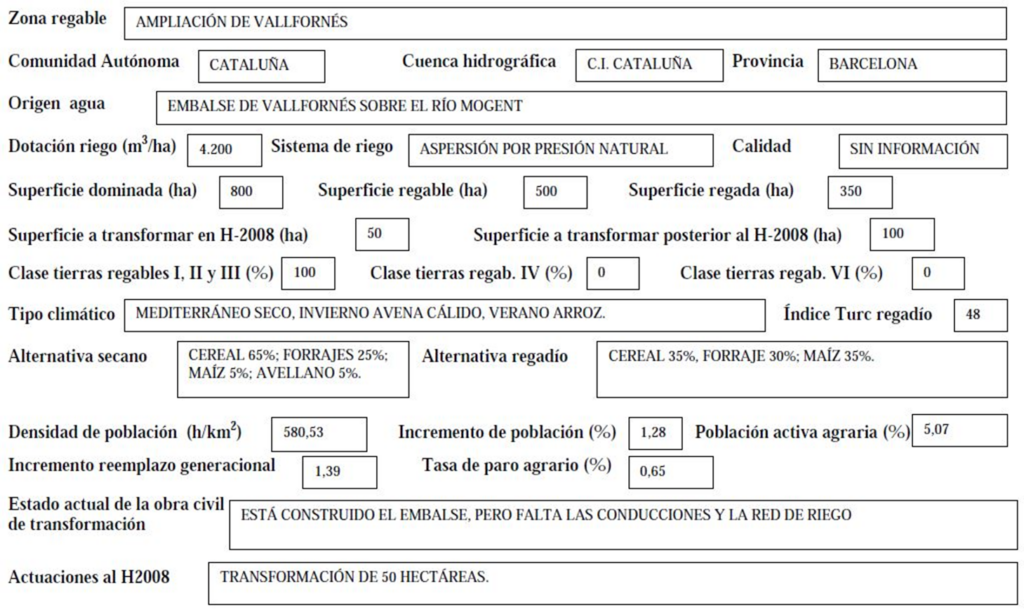
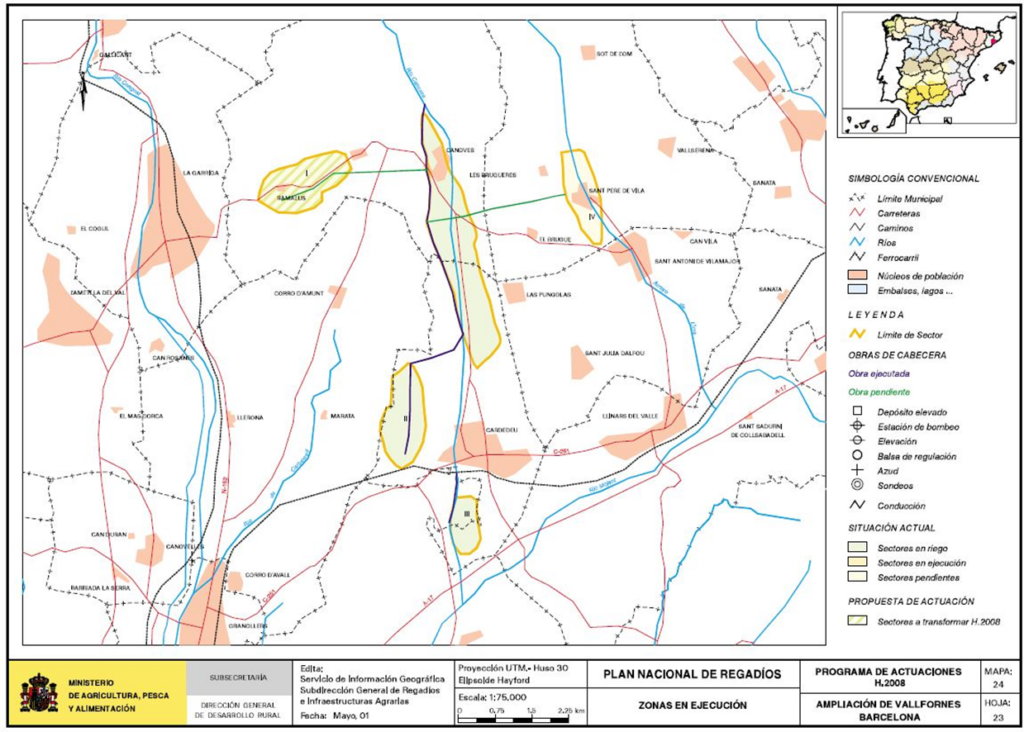
MARGALEF
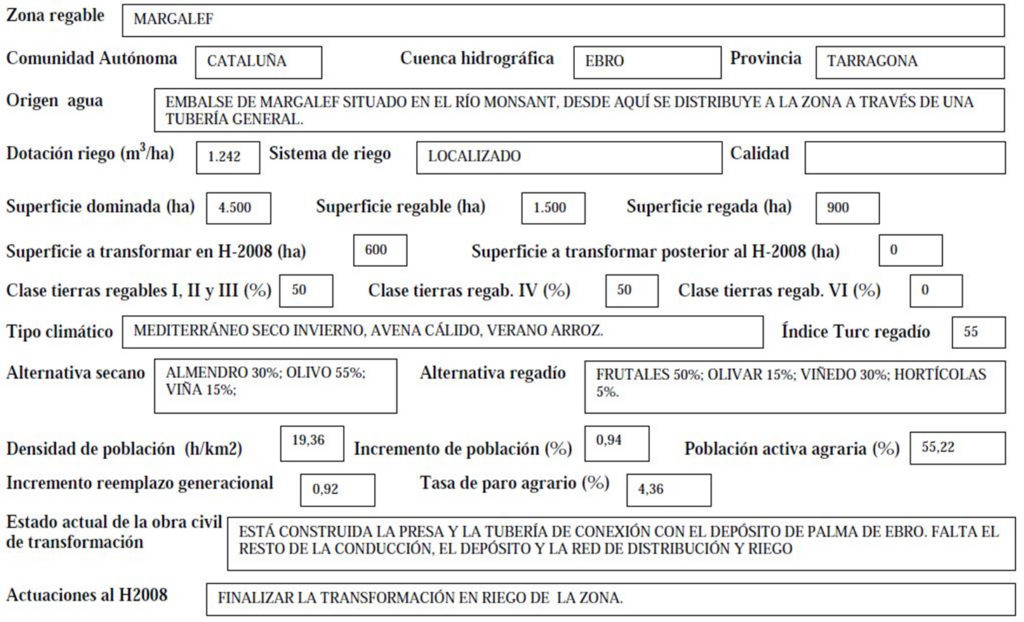
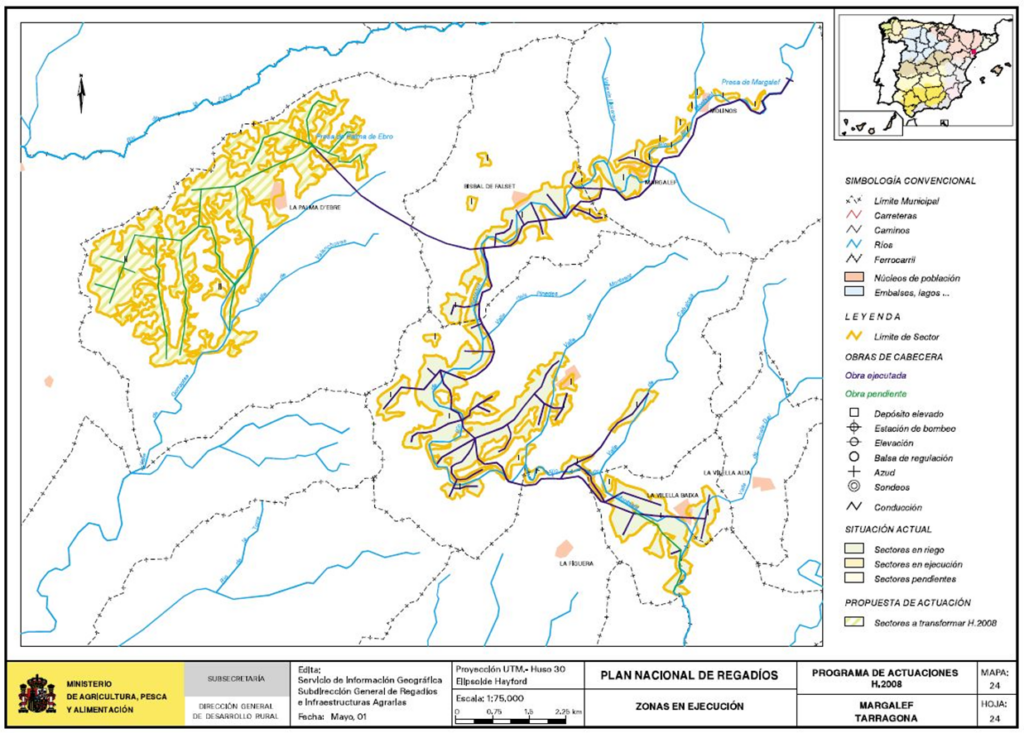
MUGA MD
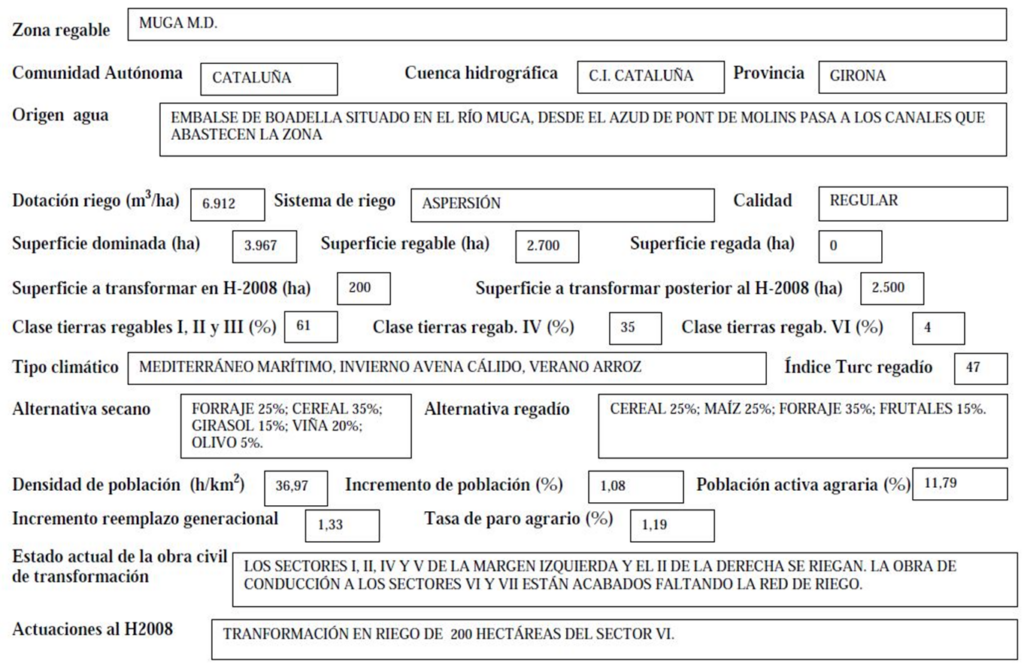
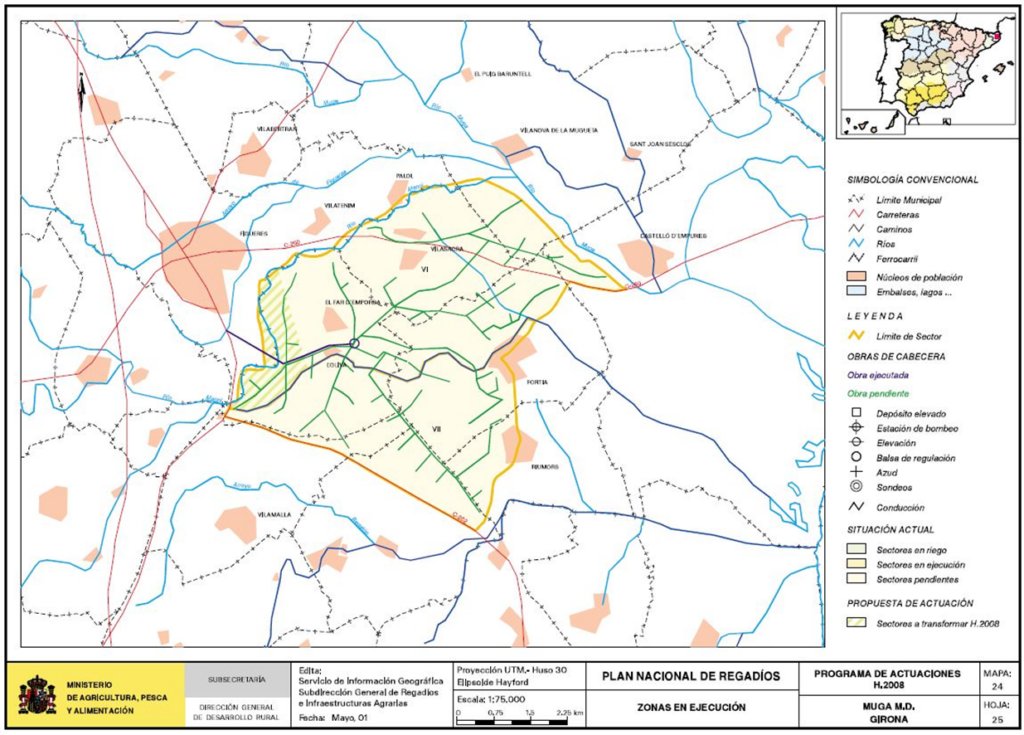
PERELLÓ- RASQUERA
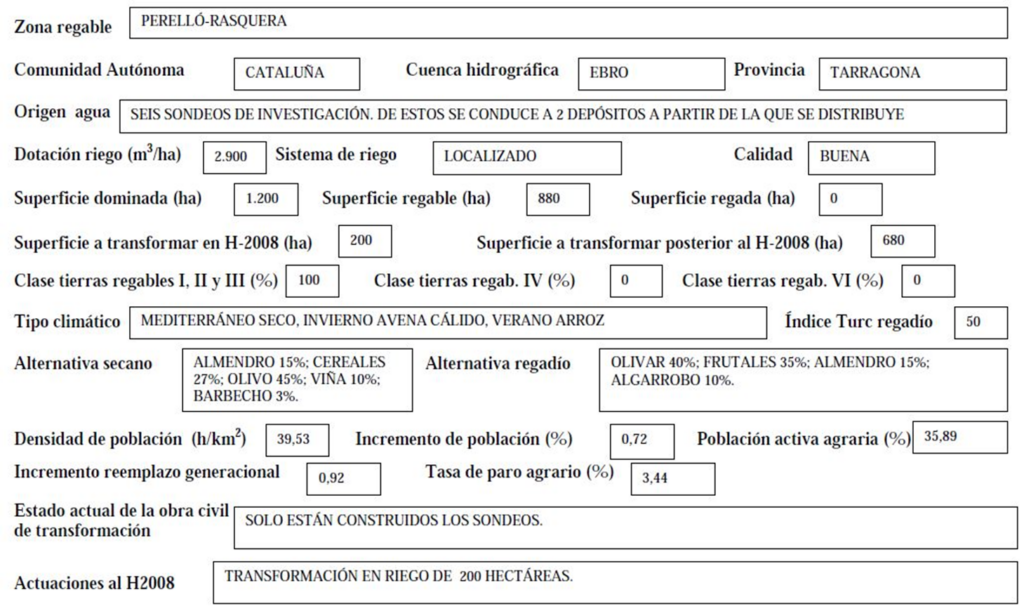
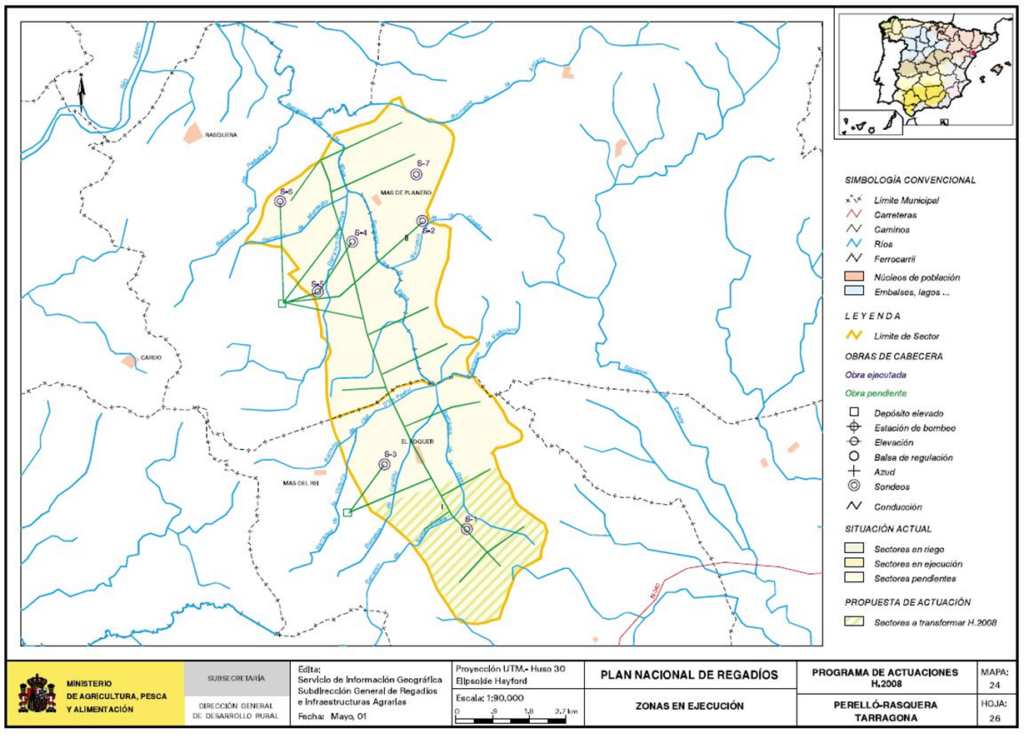
SAS PLA
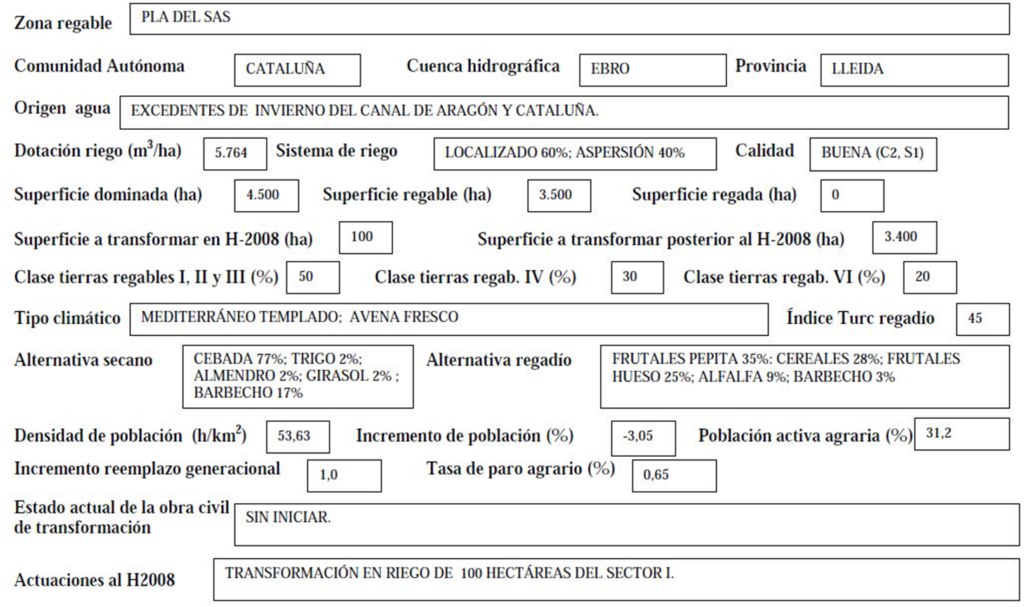
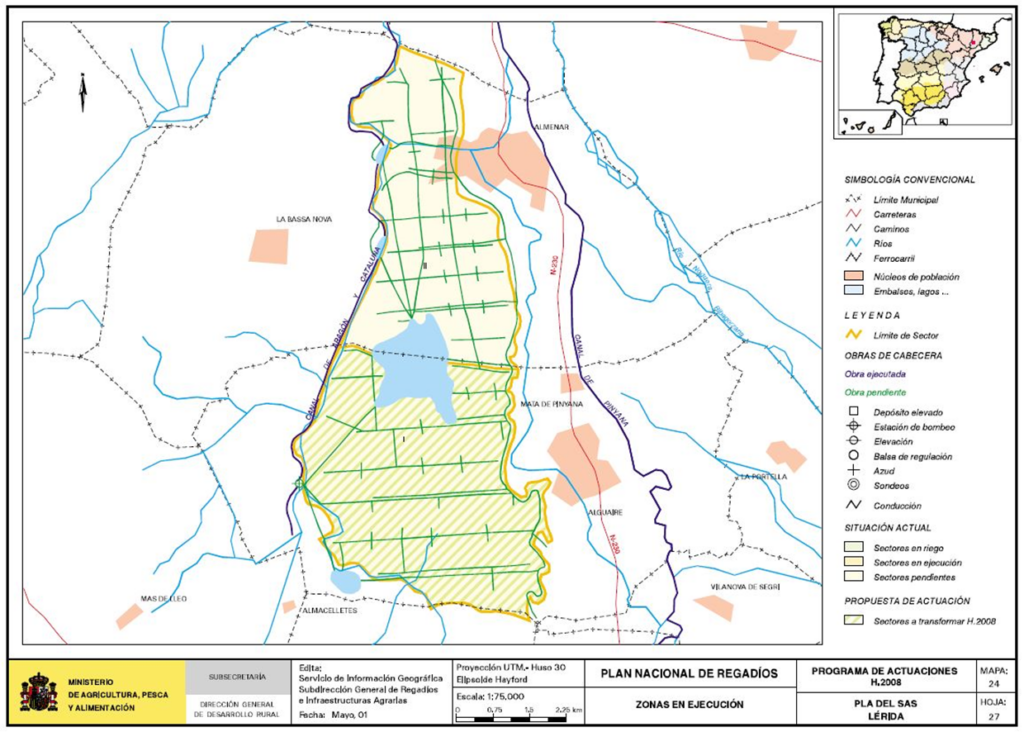
SAN MARTIN DE TOUS
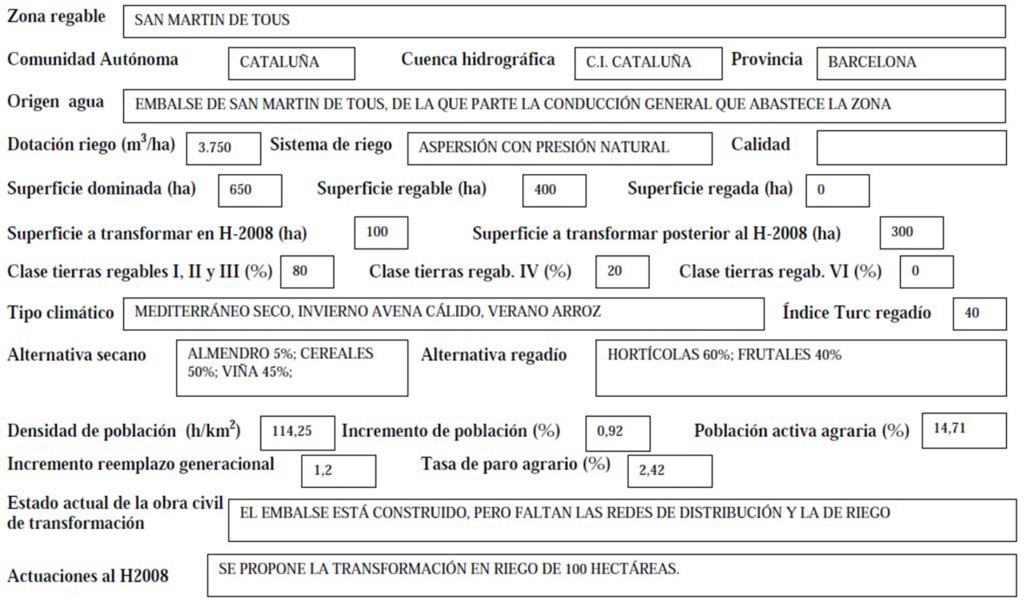
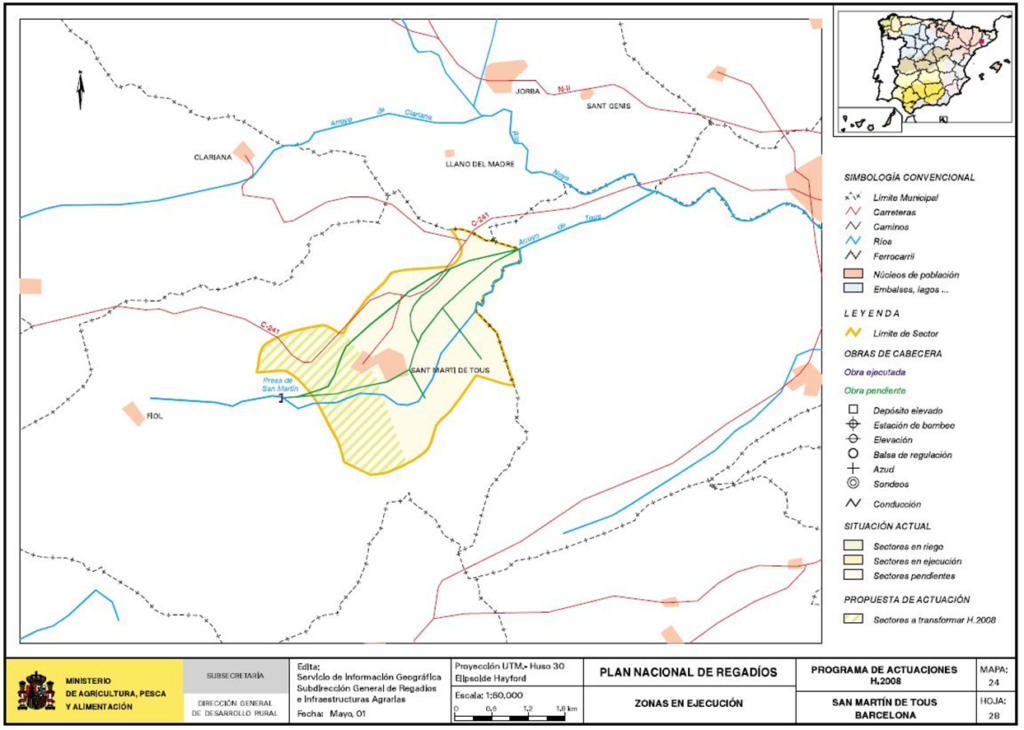
SEGARRA- GARRIGA
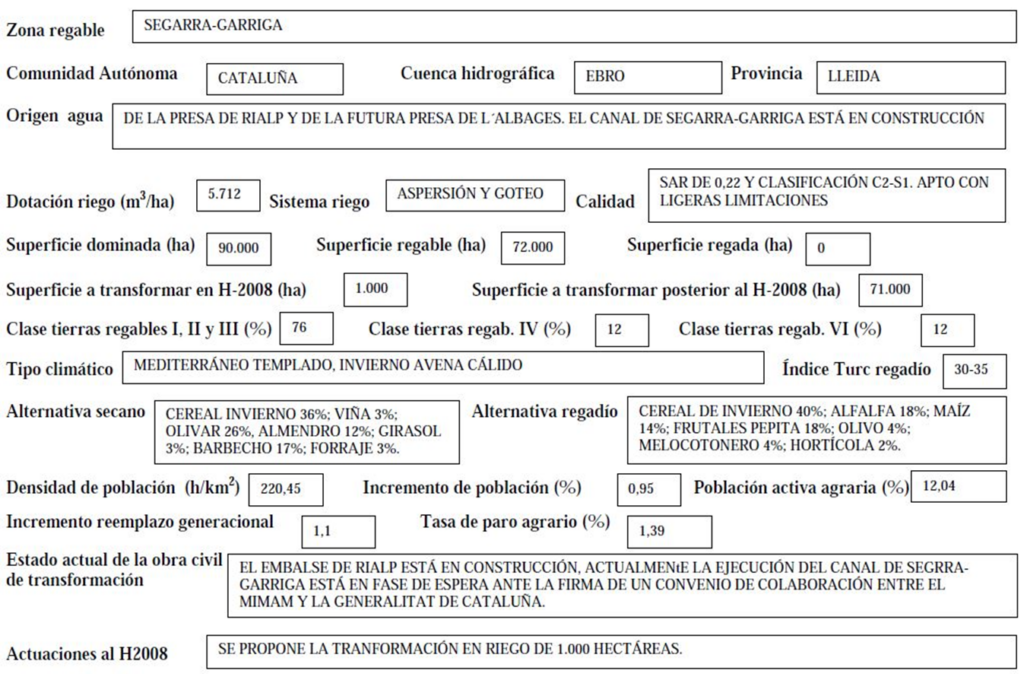
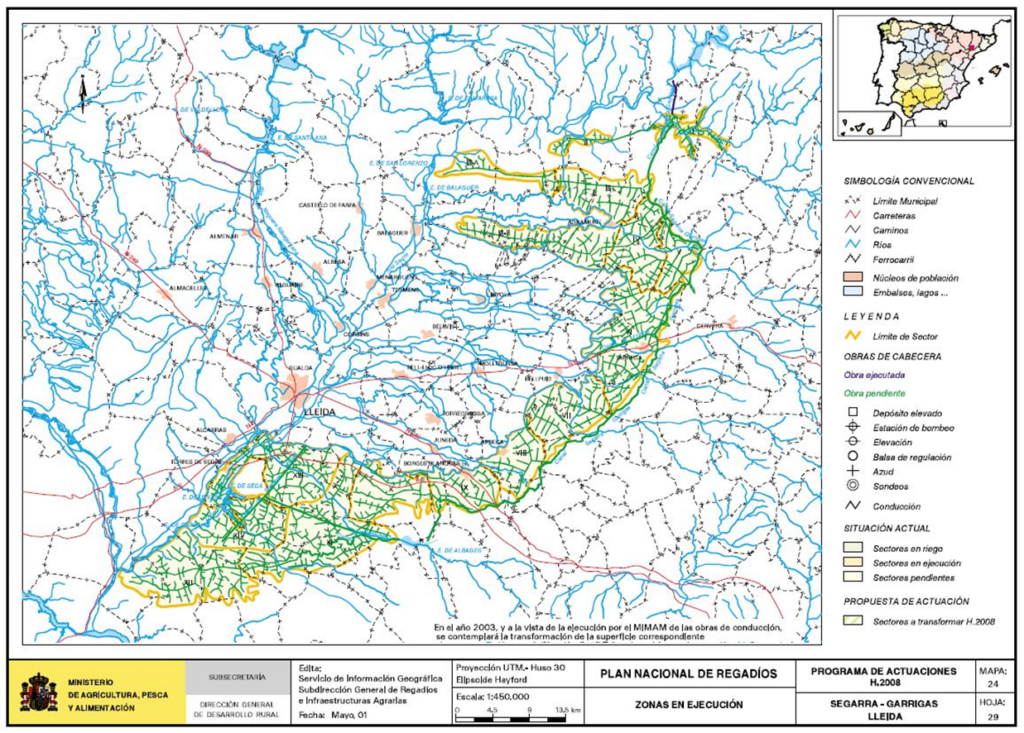
XERTA-SENIA
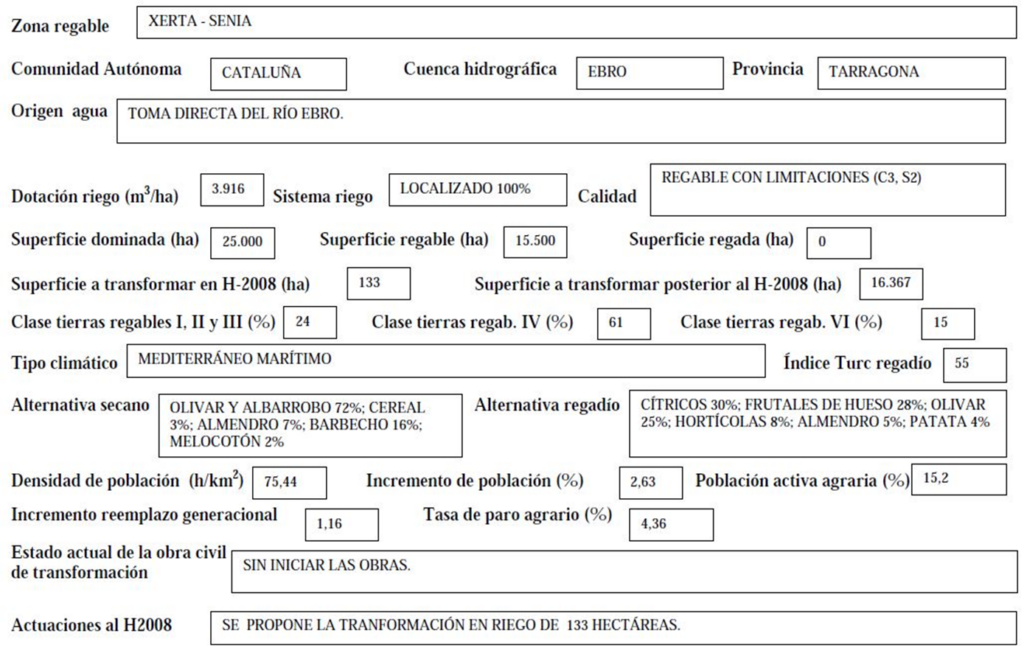
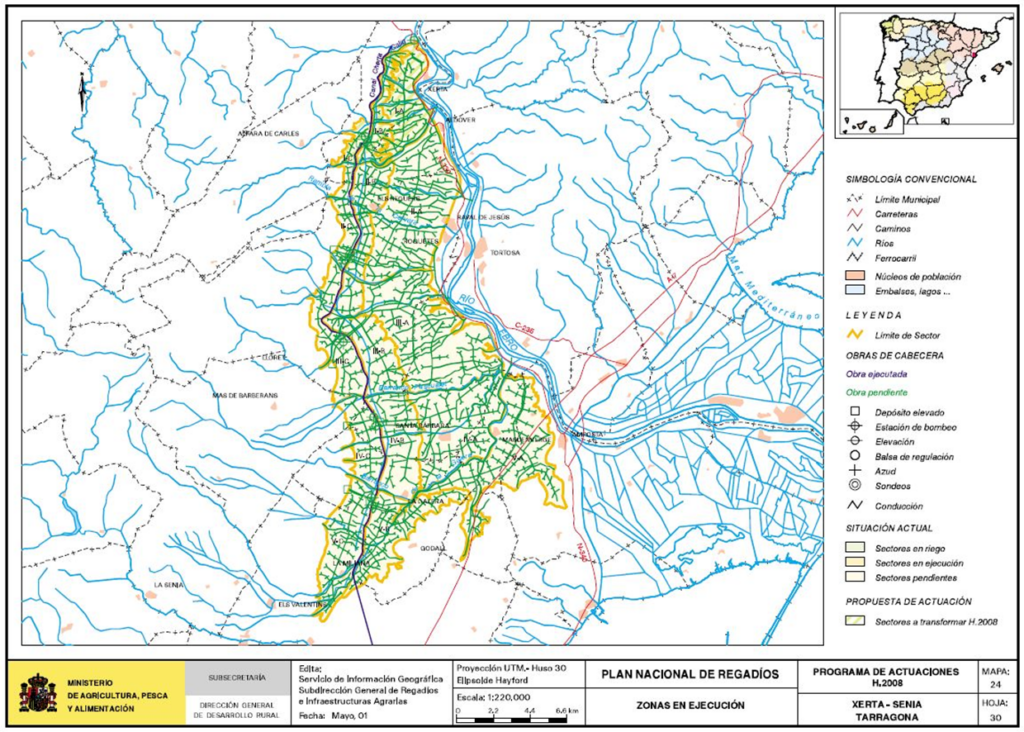
IRRIGATION AREAS UNDER CONSTRUCTION IN THE AUTONOMOUS COMMUNITY OF EXTREMADURA:
AMBROZ
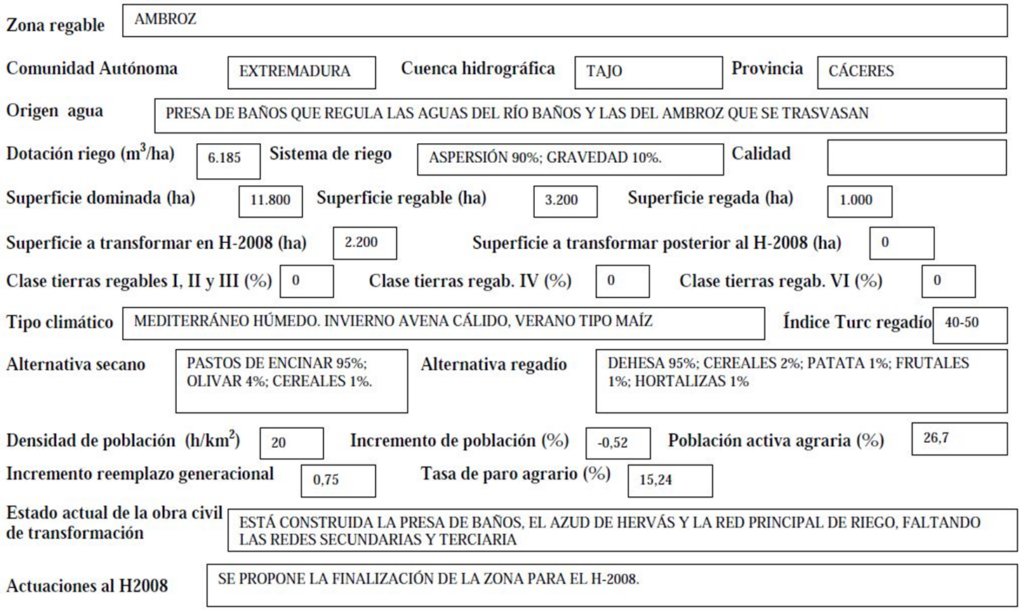
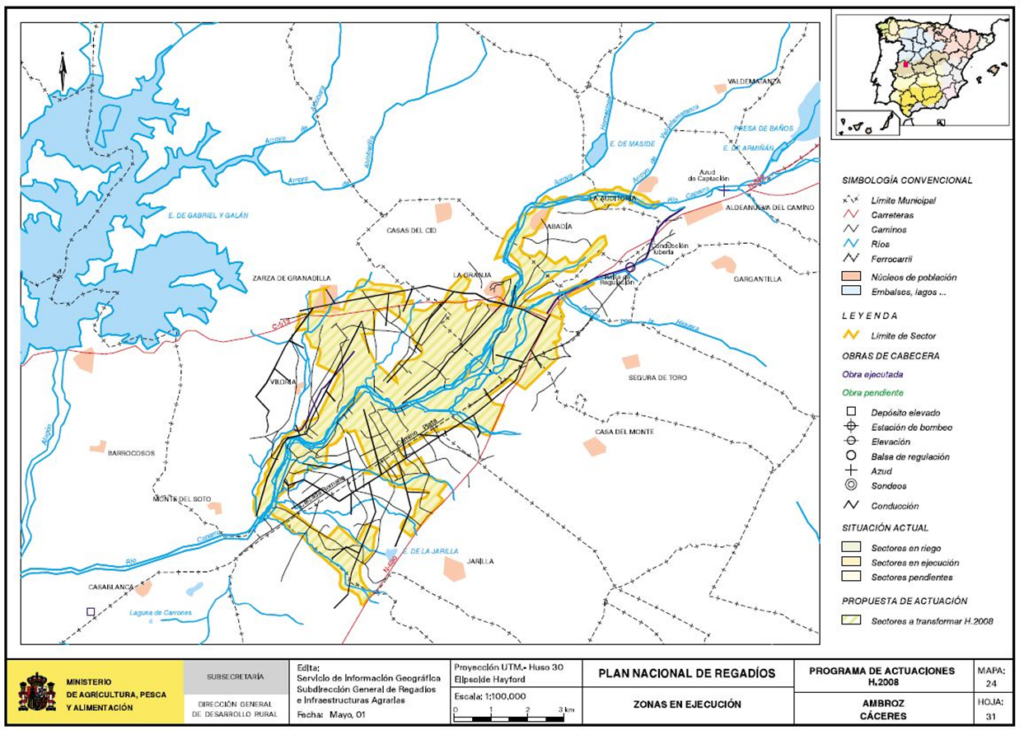
CENTER OF EXTREMADURA
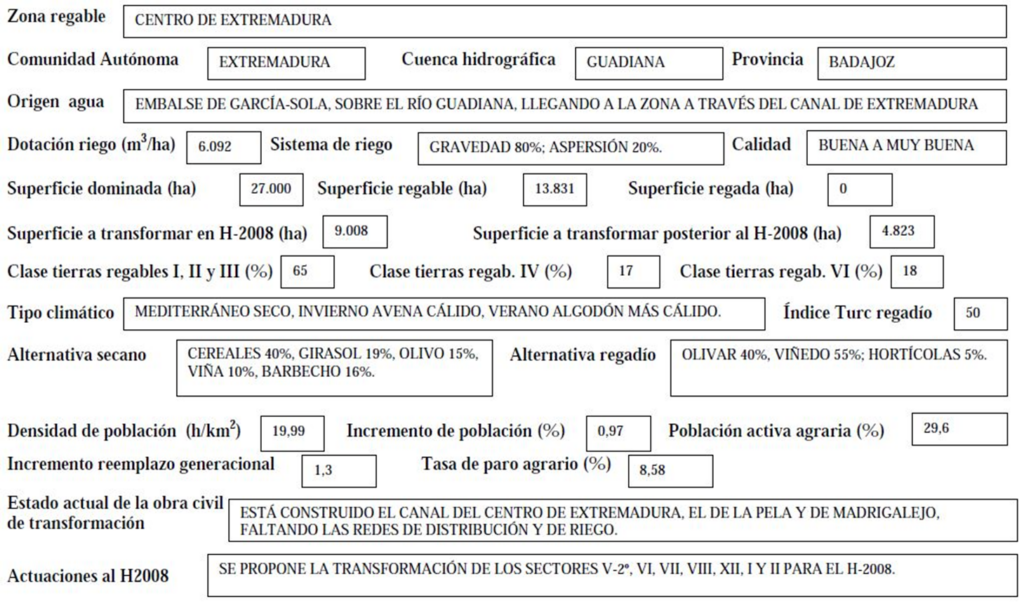
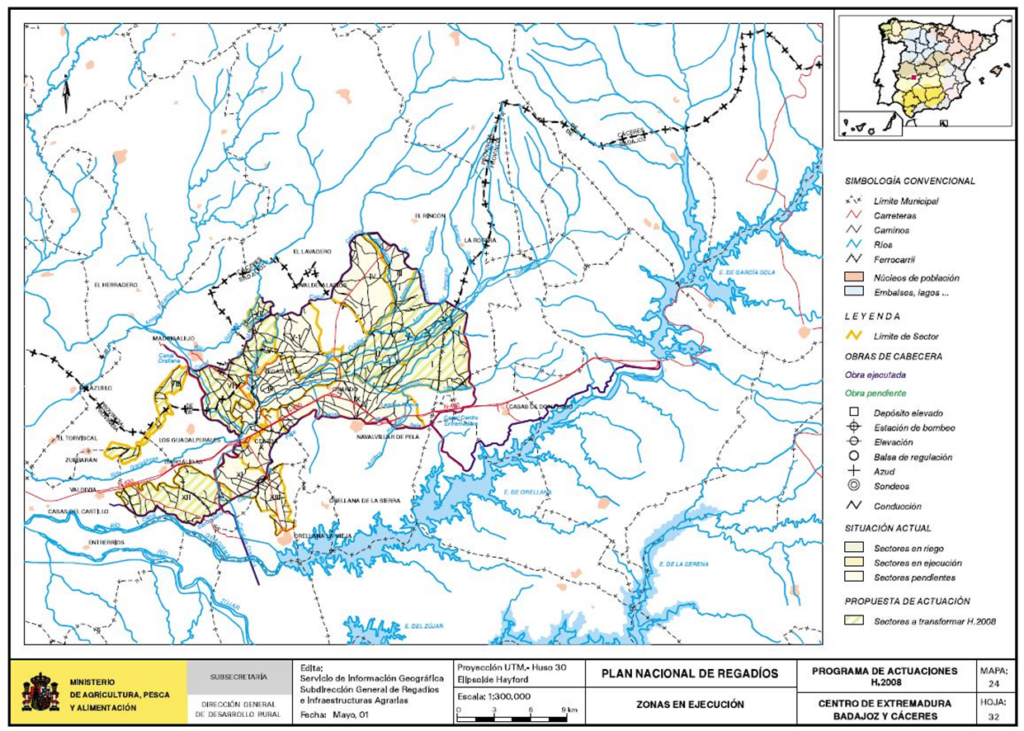
ZÚJAR
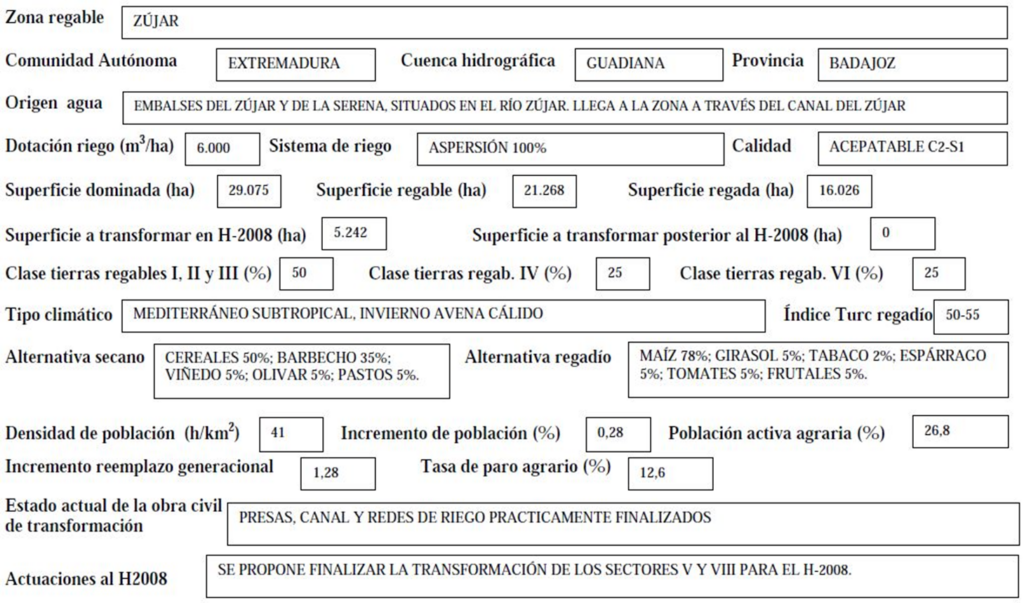
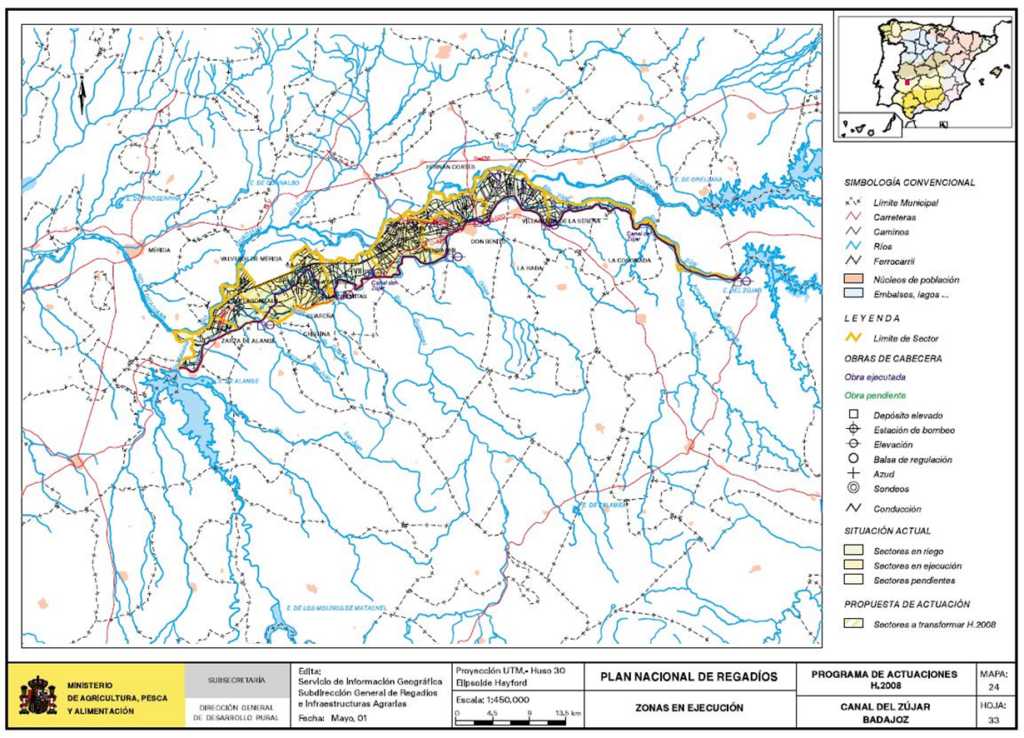
IRRIGATION AREAS UNDER CONSTRUCTION IN THE AUTONOMOUS COMMUNITY OF LA RIOJA:
NAJERILLA
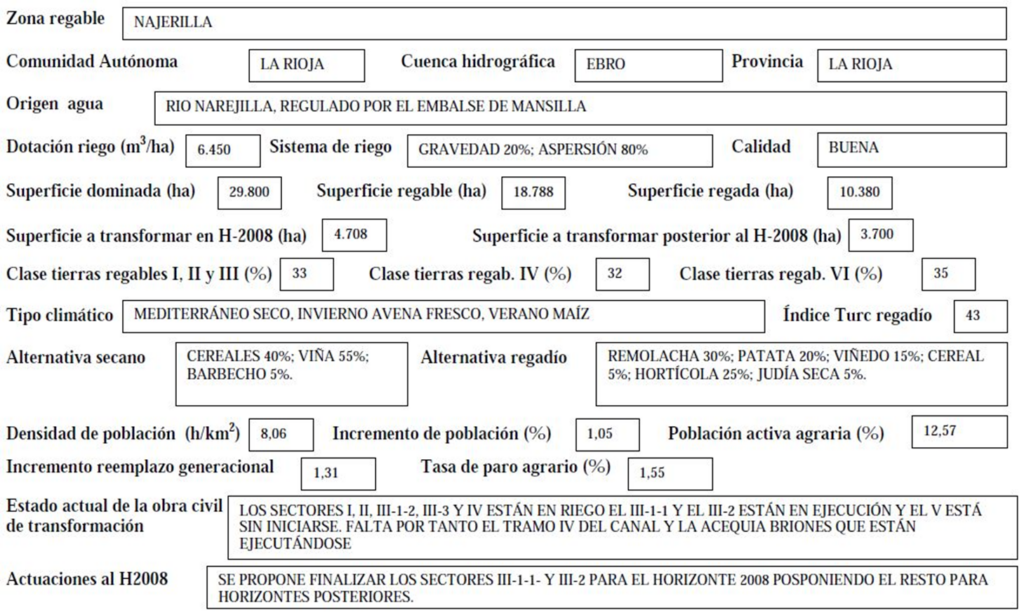
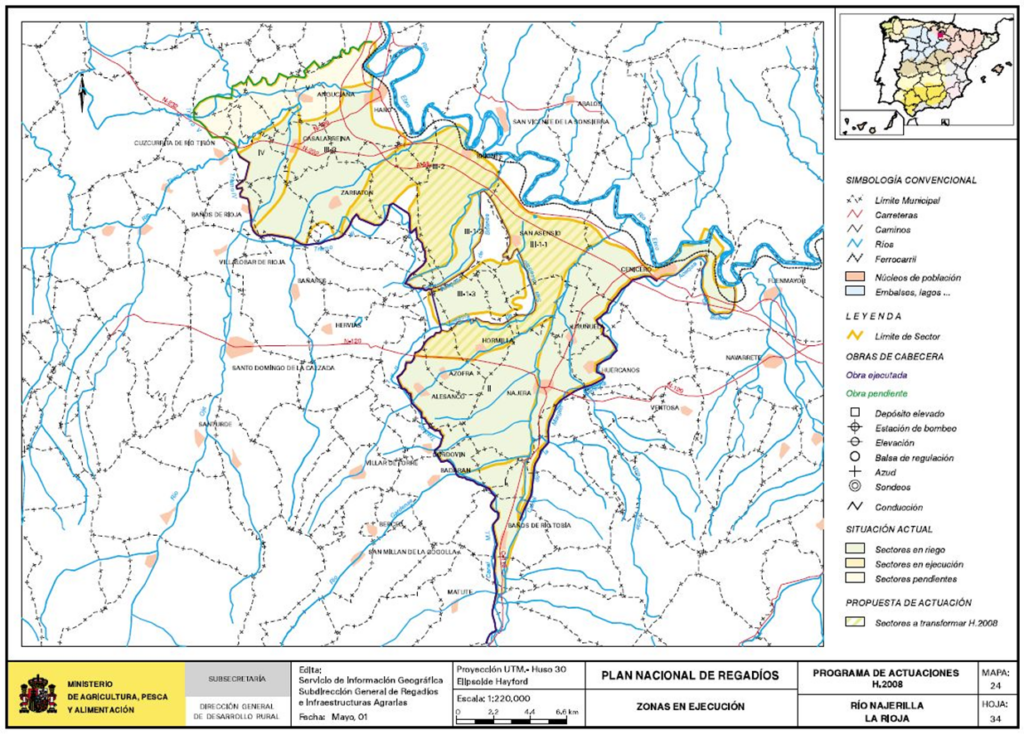
IRRIGATION AREAS UNDER CONSTRUCTION IN THE AUTONOMOUS COMMUNITY OF NAVARRA:
NAVARRE CANAL
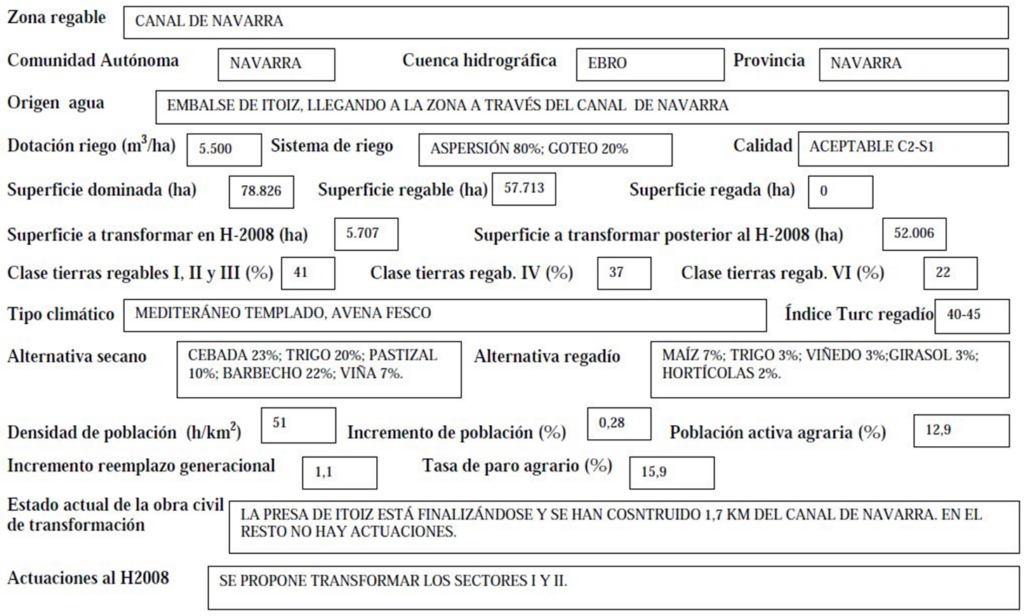
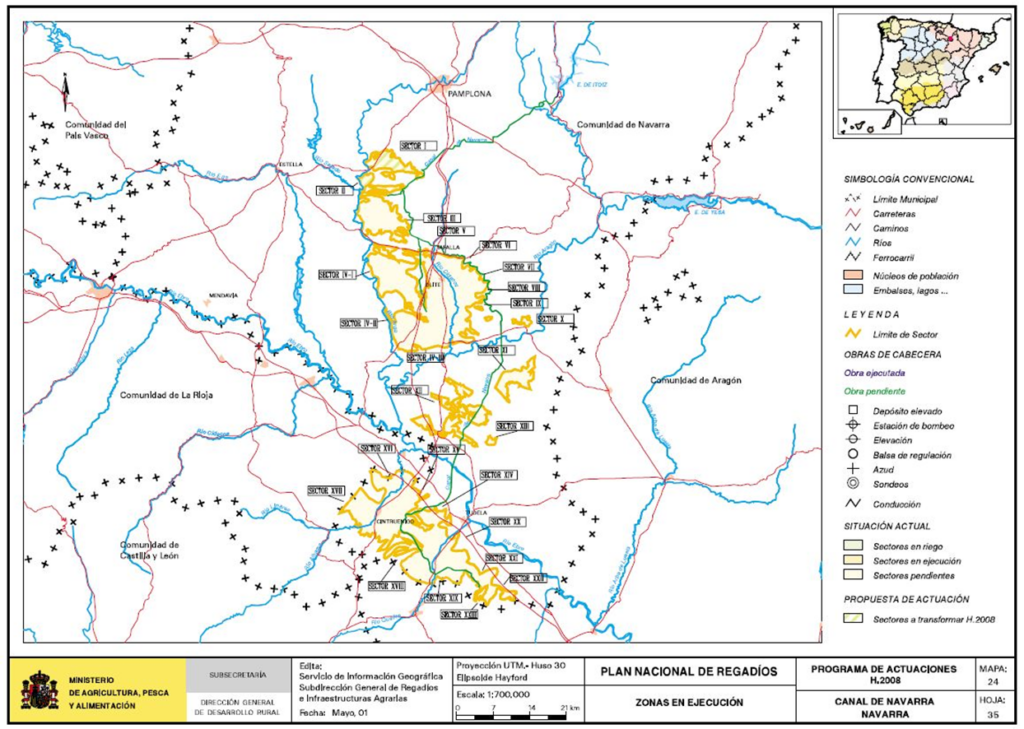
MENDAVIA
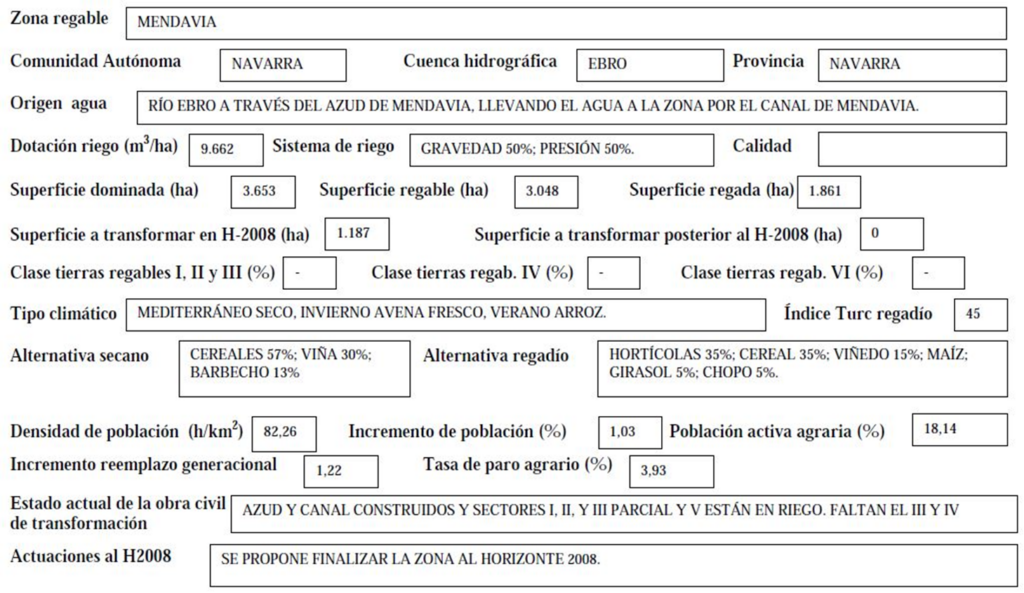
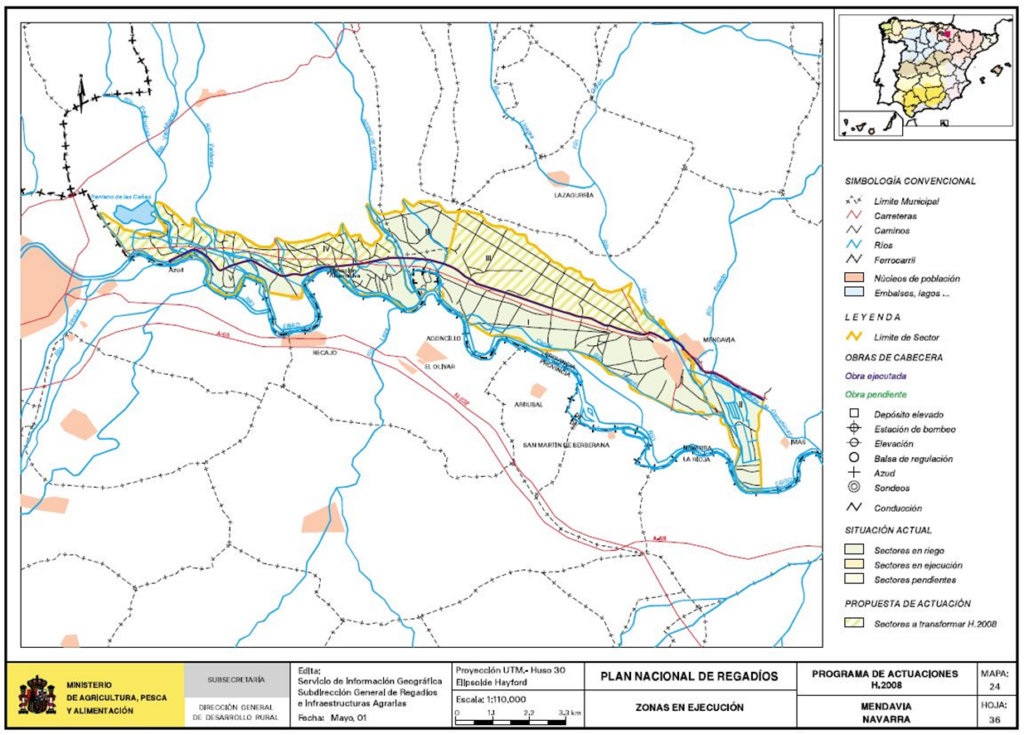
4.3.4 Environmental characteristics of irrigation systems under construction
Within the geographical perimeter of the irrigation projects under construction, there are environmental interactions of varying significance.
The attached table shows the possible environmental impacts on 238,977 ha, 22.8% of the analyzed territory, with special relevance in areas such as La Armuña, Chanza, Northwest Coast of Cádiz, Monegros II, Segarra Garrigas and South Andévalo.
In some of them, such as Chanza, Costa Noroeste de Cádiz or Sur Andévalo, the transformation to irrigation with surface water will reduce the overexploitation of groundwater.
In any case, although the start of the works in some areas has taken place before Spain's accession to the European Union, the new projects in the sectors to be executed must be subject to the environmental impact assessment procedures, as well as defining the relevant corrective measures.
SURFACE INTERACTIONS OF THE PERIMETERS OF IRRIGATION SYSTEMS UNDER CONSTRUCTION WITH GEOGRAPHICAL AND ENVIRONMENTAL BOUNDARIES
| irrigable area | Surface with interactions ha. | Surface without interactions ha. | Type of interactions |
|---|---|---|---|
| AMBROZ | 591 | 2.501 | LIC 591 |
| AMPL. OF VALFORNES | 6 | 752 | LIC 6 |
| ARMUÑA | 15.471 | 31.935 | LIC AND ZEPAS 15471 |
| BAZA-HUESCAR | 1.194 | 39.310 | LIC 896, ENP and LIC 298 |
| EXTREMADURA CENTER | 2.180 | 23.900 | LIC 1,963, ENP, LIC AND ZEPA 217 |
| Calanda Alcañiz | 651 | 8.692 | LIC 651 |
| NAVARRE CANAL | 5.144 | 65.734 | LIC 1,398, LIC, ENP 3,116, LIC, ENP and ZEPA 630 |
| CINCA | 214 | 33.728 | LIC 214 |
| ZUJAR | 1.621 | 22.072 | LIC 1,058, LIC and ZEPA 563 |
| JOKE | 23.278 | – | UHS 22.011, LIC, ENP and UHS 1.266, LIC and UHS 1 |
| COAST NO. CADIZ | 9.100 | – | UHS and ZV 4.711 |
| ALMANZORA CAVES | 10 | 7.976 | SPA 10 |
| GENIL-CABRA | 14.673 | 27.136 | ENP 8, LIC and ZEPA 35, LIC, ENP and FPN 149 |
| GUARO | 8.750 | 1.952 | ZV 8,750 |
| THE COGOTAS | 118 | 10.748 | LIC and SPA 118 |
| MARGALEF | 170 | 1.704 | LIC 170 |
| LEFT MARGIN THERA | 186 | 16.864 | LIC 186 |
| MENDAVIA | 1 | 3.970 | LIC 3 |
| MONEGROS I – 4TH SECTION | 3 | 5.208 | LIC 3 |
| MONEGROS II | 90.518 | 93.953 | SPA 34,236, SCI 2,956, SCI and SPA 53,326 |
| MUGA | 1.823 | 1.216 | ZV 1,823 |
| LOW MOOR | 110 | 40.561 | LIC 110 |
| PERELLÓ RASQUERA | 113 | 4.113 | LIC 113 |
| RIAÑO 1ST PHASE (PORMA) | 87 | 10.319 | LIC 50, LIC and SPA 37 |
| RIAÑO PAYUELOS | 6.294 | 68.116 | LIC 240, LIC and ZEPA 6,054 |
| NAJERILLA | 22 | 27.578 | LIC 22 |
| St. Martin of Tous | 11 | 816 | LIC 11 |
| SEGARRA GARRIGAS | 35.339 | 58.787 | ZV 31,131, LIC 2,514, ENP 19, LIC and ZEPA 18, ENP and ZEPA 5, ENP and LIC 263, LIC, ENP and ZEPA 1,409 |
| SOUTH ANDÉVALO | 21.207 | 22.267 | UHS 21,193, ENP, LIC and ZEPA 14 |
| XERTA SENIA | 72 | 23.879 | LIC 72 |
LIC = Sites of Community Interest
ZEPA = Special Protection Area for Birds UHS = Overexploited Hydrogeological Unit ZV = Nitrate Vulnerable Zone
NO INTERACTIONS:
Albacete Canal, Civán Canal, Sagra Torrijos and Pla del Sas. TOTAL 80,040 ha.
WITHOUT AFFECTIONS:
TOTAL 806,682
WITH CONDITIONS:
TOTAL 238,977 22.8 % territory
4.4 Study of other areas
To complete the overall picture of the irrigation situation, it is essential to consider various areas that are not currently under development but are susceptible to further transformation. Indeed, several estimates of potential long-term irrigation projects exist, and this National Irrigation Plan has highlighted the following areas based on their relevance and feasibility.
It should be noted that all these actions have been included in the River Basin Management Plans, thus ensuring the compatibility of this Irrigation Plan. Likewise, and in accordance with the National Hydrological Plan, the possibility of developing new irrigation systems in the basins receiving water transfers from the diverted waters has not been foreseen under any circumstances.
The different areas have been grouped into:
New areas studied with cartographic representation: those areas that have a significant entity and dimension, forming a territorial unit with cartographic representation and relevant socio-economic significance in their territorial scope.
New areas studied without precise mappingThese are areas that, due to their smaller size (usually less than 1,000 hectares), have less weight in the planning of future irrigation systems, and those that, even though they have a considerable surface area, are geographically dispersed and lack individual physical identity. The latter generally include areas to be developed through private initiatives.
Irrigated areas where investments have been made in works of some importance, regardless of their administrative status, have been considered as areas under execution, excluding from this section the area still pending transformation.
The objective of this study was to analyze and evaluate the potential for irrigation conversion in each area studied, considering economic, social, water, territorial, and environmental aspects. Based on these evaluation criteria, and applying the methodology described below, the actions included in the section "Program of Actions for New Irrigation Systems" were selected.
4.4.1 Methodology for the study of the new areas studied
The new areas have been studied, defined and characterized in order to establish the action program regarding future irrigable areas.
4.4.1.1 Previous data: graphic and documentary information
- Existing studies on new areas.
- Hydrological Plans of the different Hydrographic Basins.
- Sectoral studies carried out within the framework of the PNR.
- General thematic studies and specialized publications.
- Agricultural Census of Spain.
- MAPA crop database.
- INE census data.
- Study of Current Land Use by Remote Sensing. MAP.
- Agroclimatic Studies. MAPA.
- MTN 1:50,000.
- Existing plans of the new areas studied.
4.4.1.2 Methodological process
- Identification of the new areas.
- Compare with the Autonomous Communities and River Basin Authorities of the identified potential areas.
- Inventory and justification of excluded areas and areas to be developed in the study.
- Collection and analysis of area-specific studies.
- Review of information for each zone.
- Preparation of necessary studies by area.
- Hydraulic scheme design.
- Valuation and estimation of transformation costs.
- Preparation of individual records in significant areas and collective records for other areas.
- Development of cartographic information for each significant irrigated area.
- Influence of the Common Agricultural Policy.
- Technical, social, economic and environmental feasibility analysis by area.
- Comparative analysis of zones and grouping according to their temporal feasibility of execution.
4.4.1.3 Methodological scheme: new areas studied
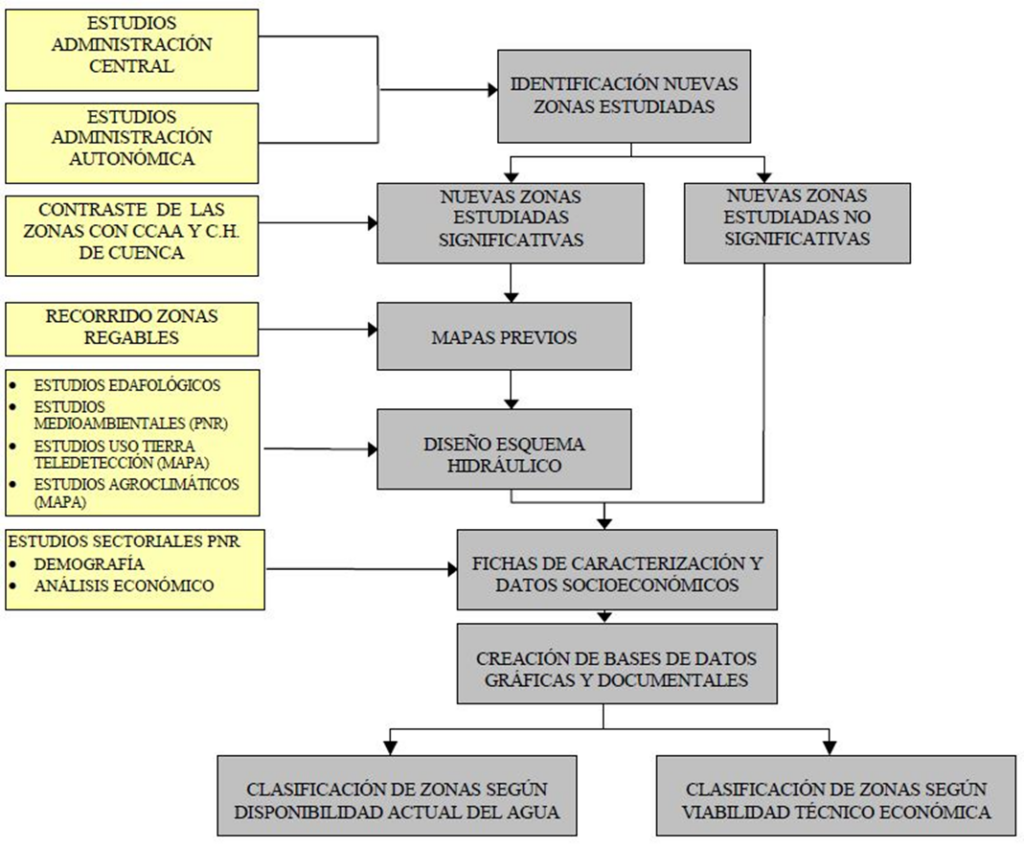
4.4.2 New studied areas mapped
NEWS MAPPED STUDY AREAS (1)
| AUTONOMOUS COMMUNITY | REGULABLE AREA | HYDROGRAPHIC BASIN | PROVINCE | IRRIGABLE SURFACE (ha) |
|---|---|---|---|---|
| ANDALUSIA | CORUMBEL – CLARINA | GUADIANA | HUELVA | 1.306 |
| ANDALUSIA | SOUTH-ANDÉVALO EAST SUB-ZONE | GUADIANA | HUELVA | 6.000 |
| ANDALUSIA | SOUTH-ANDÉVALO WESTERN SUB-ZONE | GUADIANA | HUELVA | 2.500 |
| ANDALUSIA | BARBATE | GUADALQUIVIR | CADIZ | 2.777 |
| ANDALUSIA | RIGHT MARGIN OF TERMINALS | GUADALQUIVIR | CADIZ | 1.200 |
| ANDALUSIA | VILLAMARTÍN | GUADALQUIVIR | CADIZ | 3.054 |
| ANDALUSIA | GOR – GORAFE (EXTENSION) | GUADALQUIVIR | GRENADE | 2.978 |
| ANDALUSIA | SOLANA DEL PEÑÓN (EXTENSION) | GUADALQUIVIR | GRENADE | 2.177 |
| ANDALUSIA | GUARRISES | GUADALQUIVIR | JAÉN | 4.480 |
| ANDALUSIA | VILCHES | GUADALQUIVIR | JAÉN | 2.250 |
| ANDALUSIA | CORBONES | GUADALQUIVIR | SEVILLE | 3.484 |
| ANDALUSIA | RIVER PALM | GUADALQUIVIR | SEVILLE, CADIZ | 2.763 |
| ANDALUSIA | MOTRIL – SALOBREÑA (2ND EXTENSION) | SOUTHERN SPAIN | GRENADE | 1.708 |
| TottoANDALUSIA | 36.677 |
NEW STUDY AREAS MAPPED (2)
| AUTONOMOUS COMMUNITY | REGULABLE AREA | HYDROGRAPHIC BASIN | PROVINCE | IRRIGABLE SURFACE (ha) |
|---|---|---|---|---|
| ARAGON | CINCA HEADBOARD | EBRO | HUESCA | 1.730 |
| ARAGON | Aragon and Catalonia Canal | EBRO | HUESCA | 1.180 |
| ARAGON | ALMUDEVAR ELEVATION | EBRO | HUESCA | 1.600 |
| ARAGON | ANTILLÓN ELEVATION | EBRO | HUESCA | 6.650 |
| ARAGON | BARBUÑALES ELEVATION – AZARA | EBRO | HUESCA | 2.260 |
| ARAGON | GARDEN ELEVATION | EBRO | HUESCA | 1.160 |
| ARAGON | PERALTA ALC.- LACUADRA ELEVATION | EBRO | HUESCA | 3.700 |
| ARAGON | POZÁN DE VERO ELEVATION | EBRO | HUESCA | 3.500 |
| ARAGON | ROBRES ELEVATION – ALCUBIERRE | EBRO | HUESCA | 6.000 |
| ARAGON | HOYA DE HUESCA | EBRO | HUESCA | 21.755 |
| ARAGON | JACETANIA | EBRO | HUESCA | 11.259 |
| ARAGON | HIGH BUNK | EBRO | HUESCA | 11.754 |
| ARAGON | CALANDA – ALCAÑIZ – PART 2 | EBRO | TERUEL | 7.380 |
| ARAGON | ESCATRON LIFTS | EBRO | TERUEL, ZARAGOZ | 6.152 |
| ARAGON | MONREAL – TORRIJOS | EBRO | TERUEL | 1.729 |
| ARAGON | LECIÑENA IRRIGATION DITCH | EBRO | SARAGOSSA | 21.139 |
| ARAGON | BIOTA | EBRO | SARAGOSSA | 1.200 |
| ARAGON | BORJA | EBRO | SARAGOSSA | 1.690 |
| ARAGON | CIVÁN CANAL – PART 2 | EBRO | SARAGOSSA | 2.580 |
| ARAGON | IMPERIAL CANAL (EXPANSION) | EBRO | SARAGOSSA | 10.285 |
| ARAGON | BARDENAS ELEVATION I | EBRO | SARAGOSSA | 1.940 |
| ARAGON | IMPERIAL CANAL ELEVATION | EBRO | SARAGOSSA | 2.100 |
| ARAGON | CASPE ELEVATION | EBRO | SARAGOSSA | 1.337 |
| ARAGON | LOTETA RESERVOIR ELEVATION | EBRO | SARAGOSSA | 7.785 |
| ARAGON | LOPÍN RESERVOIR ELEVATION | EBRO | ZARAGOZA, TERUEL | 4.600 |
| ARAGON | MEQUINENZA LIFT – FAYÓN | EBRO | SARAGOSSA | 2.289 |
| ARAGON | LA TRANQUERA – MULARROYA | EBRO | SARAGOSSA | 13.954 |
| ARAGON | MOON | EBRO | SARAGOSSA | 1.088 |
| ARAGON | RIGHT BANK OF THE LOWER GÁLLEGO RIVER | EBRO | SARAGOSSA | 11.470 |
| ARAGON | MOLINO DE LAS ROCAS (IN ARAGON) | EBRO | TZAR, TERUEL, TARRA | 522 |
| TottoARAGON | 171.788 |
NEW STUDY AREAS MAPPED (3)
| AUTONOMOUS COMMUNITY | REGULABLE AREA | HYDROGRAPHIC BASIN | PROVINCE | IRRIGABLE SURFACE (ha) |
|---|---|---|---|---|
| CASTILE AND LEON | IRRIGATIONS OF THE PLAINS | DUERO | AVILA | 2.300 |
| CASTILE AND LEON | ARLANZA RISKS | DUERO | BURGOS | 22.400 |
| CASTILE AND LEON | HIGH, MEDIUM AND LOW CEA | DUERO | LEÓN, VALLAD, ZAMO | 10.208 |
| CASTILE AND LEON | CEA HEADER | DUERO | LION | 1.600 |
| CASTILE AND LEON | HEADBOARD OF VALDERADUEY | DUERO | LION | 1.200 |
| CASTILE AND LEON | VALVERDE ENRIQUE CANAL | DUERO | LION | 8.825 |
| CASTILE AND LEON | ERIA – DUERNA | DUERO | LION | 12.600 |
| CASTILE AND LEON | TORIUM – BERNESGA | DUERO | LION | 10.000 |
| CASTILE AND LEON | VEGAS ALTA DEL ESLA | DUERO | LION | 3.753 |
| CASTILE AND LEON | VALDAVIA | DUERO | PALENCIA | 2.400 |
| CASTILE AND LEON | THE ARMUÑA (PHASE 2) | DUERO | SALAMANCA, AVILA | 35.000 |
| CASTILE AND LEON | WATER IRRIGATIONS | DUERO | SALAMANCA | 5.161 |
| CASTILE AND LEON | GUIJASALBAS IRRIGATIONS | DUERO | SEGOVIA | 1.400 |
| CASTILE AND LEON | RISKS OF CEGA | DUERO | SEGOVIA, VALLAD. | 5.700 |
| CASTILE AND LEON | IRESMA RISKS | DUERO | SEGOVIA, VALLAD. | 33.500 |
| CASTILE AND LEON | Pirón River | DUERO | SEGOVIA | 6.400 |
| CASTILE AND LEON | ALMAZÁN CANAL (EXTL.) | DUERO | SORIA | 2.500 |
| CASTILE AND LEON | MATAMALA DE ALMAZÁN | DUERO | SORIA | 2.600 |
| CASTILE AND LEON | RIAZA – DURATÓN | DUERO | VALLAD., SEGOVIA | 4.100 |
| CASTILE AND LEON | IRRIGATIONS OF THE ESGUEVA | DUERO | VALLADOLID | 4.500 |
| CASTILE AND LEON | SOUTHERN IRRIGATIONS | DUERO | VALLADOLID | 33.500 |
| CASTILE AND LEON | VILLALPANDO | DUERO | VALLAD., ZAMORA | 7.056 |
| CASTILE AND LEON | ESLA RIVER ELEVATION IN CAMPOS | DUERO | ZAMORA | 9.500 |
| CASTILE AND LEON | IRRIGATIONS OF TABARA ESLA-TERA | DUERO | ZAMORA | 2.600 |
| CASTILE AND LEON | MIRANDA AND IRCIO | EBRO | BURGOS | 3.650 |
| CASTILE AND LEON | RIVER AYUDA Y ARRIETA | EBRO | BURGOS | 2.700 |
| TottoCastile and León | 235.153 | |||
| CASTILE AND LEON AND THE BASQUE COUNTRY | RIO ROJO–BERANTEVILLA | EBRO | BURGOS AND ÁLAVA | 2.321 |
| TottoCASTILLA Y LEÓN AND PAÍS VASCO | 2.321 | |||
| CASTILLA Y LEÓN AND LA RIOJA | OJA SYSTEM – PULL | EBRO | BURGOS LA RIOJA | 10.000 |
| TottoCASTILLA Y LEÓN AND LA RIOJA | 10.000 | |||
NEW STUDY AREAS MAPPED (4)
| AUTONOMOUS COMMUNITY | REGULABLE AREA | HYDROGRAPHIC BASIN | PROVINCE | IRRIGABLE SURFACE (ha) |
|---|---|---|---|---|
| CASTILLA LA MANCHA | GUADIELA | BLOCK | BASIN | 2.227 |
| CASTILLA LA MANCHA | TARANCÓN | BLOCK | BASIN | 9.002 |
| CASTILLA LA MANCHA | ALMOGUERA – ILLANA | BLOCK | GUADAL., CUENCA | 2.530 |
| CASTILLA LA MANCHA | HENARES CANAL (EXTENDED) | BLOCK | GUADALAJARA | 9.057 |
| CASTILLA LA MANCHA | COGOLLUDO | BLOCK | GUADALAJARA | 1.100 |
| CASTILLA LA MANCHA | Left M. Castrejón Canal | BLOCK | TOLEDO | 2.217 |
| CASTILLA LA MANCHA | MANCHUELA CENTER | JÚCAR | BASIN | 13.278 |
| Tottol CASTILLA-LA MANCHA | 39.411 | |||
| CATALONIA | WATER ELEVATION | EBRO | LLEIDA | 3.230 |
| CATALONIA | ELEVATIONS OF LOWER SEGRE | EBRO | LLEIDA | 1.610 |
| CATALONIA | SOUTHERN GARRIGAS (ZONES A, C and D) | EBRO | LLEIDA | 25.790 |
| CATALONIA | HIGH LAND | EBRO | TARRAGONA | 9.315 |
| CATALONIA | MOLINO DE LAS ROCAS (CATALONIA) | EBRO | TARR., ZAR., TER. | 1.148 |
| TottoCatalonia | 41.093 | |||
| VALENCIAN COMMUNITY | CENTRAL VALLEYS OF CASTELLÓN | JÚCAR | CASTELLÓN | 11.500 |
| Tottol VALENCIAN COMMUNITY | 11.500 | |||
| ESTREMADURA | GARROVILLA – ESPARRAGALEJO | GUADIANA | BADAJOZ | 3.042 |
| ESTREMADURA | GEVORA | GUADIANA | BADAJOZ | 1.590 |
| ESTREMADURA | SERENA – BARROS | GUADIANA | BADAJOZ | 60.000 |
| ESTREMADURA | BIG SHOE | GUADIANA | BADAJOZ | 2.070 |
| ESTREMADURA | MIAJADAS – ALCOLLARÍN | GUADIANA | CÁCERES | 4.275 |
| Tottol EXTREMADURA | 70.977 | |||
| NAVARRE | OTEIZA | EBRO | NAVARRE | 12.800 |
| NAVARRE | GROWTH OF YESA | EBRO | NAVARRE | 7.271 |
| NAVARRE | ARGA IRRIGATIONS | EBRO | NAVARRE | 8.200 |
| NAVARRE | IRATI IRRIGATION | EBRO | NAVARRE | 1.980 |
| NAVARRE | ULZAMA VALLEY | EBRO | NAVARRE | 1.752 |
| Tottol NAVARRE | 32.003 | |||
NEW STUDY AREAS MAPPED (5)
| AUTONOMOUS COMMUNITY | REGULABLE AREA | HYDROGRAPHIC BASIN | PROVINCE | IRRIGABLE SURFACE (ha) |
|---|---|---|---|---|
| THE BASQUE COUNTRY | THE GUARD | EBRO | ÁLAVA | 2.500 |
| THE BASQUE COUNTRY | NORTHWEST | EBRO | ÁLAVA | 5.000 |
| THE BASQUE COUNTRY | RIOJA ALAVESA | EBRO | ÁLAVA | 9.500 |
| THE BASQUE COUNTRY | SAVE EARTH | EBRO | ÁLAVA | 5.300 |
| THE BASQUE COUNTRY | TUMECILLO | EBRO | ÁLAVA | 6.400 |
| TottoThe Basque Country | 28.700 | |||
| RIOJA | Logroño Wastewater Treatment Plant | EBRO | RIOJA | 2.000 |
| RIOJA | SAN LORENZO RESERVOIR | EBRO | RIOJA | 1.634 |
| RIOJA | ENCISO RESERVOIR | EBRO | RIOJA | 2.200 |
| RIOJA | IREGUA | EBRO | RIOJA | 2.000 |
| Tottol RIOJA | 7.834 | |||
| TNATIONAL OTAL | 687.457 |
4.4.3 New unmapped studied areas
NEWS STUDYED AREAS NOT CARTOGRAPHED (1)
| AUTONOMOUS COMMUNITY | REGULABLE AREA | HYDROGRAPHIC BASIN | PROVINCE | IRRIGABLE SURFACE (ha) |
|---|---|---|---|---|
| ANDALUSIA | PRIVATE GUADALETE | GUADALQUIVIR | CADIZ | 6.000 |
| ANDALUSIA | PRIVATE VELILLOS | GUADALQUIVIR | GRENADE | 1.800 |
| ANDALUSIA | PRIVATE OLIVE GROVE | GUADALQUIVIR | Jaén, Córdoba, Granada | 60.000 |
| ANDALUSIA | PRIVATE OFFICES ON THE COAST OF HUELVA | GUADIANA | HUELVA | 5.000 |
| ANDALUSIA | PRIVATE RESIDENCES ON THE MEDITERRANEAN COAST | SOUTHERN SPAIN | GRANADA, ALMERÍA, MÁLA | 5.000 |
| TottoANDALUSIA | 77.800 | |||
| ARAGON | AREN | EBRO | HUESCA | 200 |
| ARAGON | GRAUS | EBRO | HUESCA | 841 |
| ARAGON | GUARA-CALCÓN RESERVOIR | EBRO | HUESCA | 2.000 |
| ARAGON | CALANDA OLIVAR | EBRO | TERUEL | 711 |
| ARAGON | CASTELSERAS (EXTENSION) | EBRO | TERUEL | 265 |
| ARAGON | THE CODOÑERA | EBRO | TERUEL | 200 |
| ARAGON | MORE OF THE KILLS | EBRO | TERUEL | 600 |
| ARAGON | MAELLA CANAL | EBRO | SARAGOSSA | 700 |
| ARAGON | HUERVA | EBRO | SARAGOSSA | 573 |
| ARAGON | RIGHT MARGIN OF GUADALOPE | EBRO | SARAGOSSA | 500 |
| ARAGON | Sástago | EBRO | SARAGOSSA | 400 |
| ARAGON | MORRA DE RUBIELOS | JÚCAR | TERUEL | 155 |
| TottoARAGON | 7.145 | |||
| BALEARICS | IRRIGATION WITH TREATED WATER | ISLANDS | ALL ISLANDS | 750 |
| Tottol BALEARIC ISLANDS | 750 | |||
| CANARY ISLANDS | THE PALMS | 400 | ||
| CANARY ISLANDS | SUPPORT IRRIGATION SYSTEMS FOR MID-ALTITUDE AREAS | ISLANDS | TENERIFE | 3.000 |
| CANARY ISLANDS | PRIVATE IRRIGATION SYSTEMS IN THE CANARY ISLANDS | ISLANDS | TENERIFE, | 0 |
| Tottol CANARY ISLANDS | 3.400 |
NEW AREAS STUDY NOT CARTOGRAPHED (2)
| AUTONOMOUS COMMUNITY | REGULABLE AREA | HYDROGRAPHIC BASIN | PROVINCE | IRRIGABLE SURFACE (ha) |
|---|---|---|---|---|
| CASTILE AND LEON | WASHER AND HOOK | DUERO | BURGOS | 1.300 |
| CASTILE AND LEON | AREAS OF SMALL RESERVOIRS | DUERO | BURGOS | 2.000 |
| CASTILE AND LEON | ESCUREDO (MINOR ADJUSTMENTS) | DUERO | LION | 600 |
| CASTILE AND LEON | TABUYO | DUERO | LION | 400 |
| CASTILE AND LEON | VILLAGATÓN – NEW | DUERO | LION | 500 |
| CASTILE AND LEON | BOEDO REGULATION | DUERO | PALENCIA | 600 |
| CASTILE AND LEON | VALDIVIA AND SURROUNDING AREAS | DUERO | PALENCIA | 800 |
| CASTILE AND LEON | CERRATO VALLEY | DUERO | PALENCIA | 800 |
| CASTILE AND LEON | SMALL RESERVOIRS | DUERO | SALAMANCA | 1.900 |
| CASTILE AND LEON | SMALL AREAS IN THE NORTHWEST | DUERO | SEGOVIA | 600 |
| CASTILE AND LEON | SMALL AREAS IN THE SOUTHWEST | DUERO | SEGOVIA | 700 |
| CASTILE AND LEON | ALISTE VALLEY | DUERO | ZAMORA | 300 |
| CASTILE AND LEON | SEQUILLO MIDDLE VEGAS AND TRIBATTERS | DUERO | ZAMORA | 1.200 |
| CASTILE AND LEON | AÑASTRO – LA PUEBLA DE ARGANZÓN | EBRO | BURGOS | 1.500 |
| CASTILE AND LEON | JEREA RIVER | EBRO | BURGOS | 700 |
| CASTILE AND LEON | NELA AND TRUEBA RIVER | EBRO | BURGOS | 2.600 |
| CASTILE AND LEON | OCA RIVER | EBRO | BURGOS | 2.000 |
| CASTILE AND LEON | ORONCILLO RIVER | EBRO | BURGOS | 200 |
| CASTILE AND LEON | TOBALINA VALLEY | EBRO | BURGOS | 1.500 |
| CASTILE AND LEON | VALDIVIESO VALLEY | EBRO | BURGOS | 500 |
| CASTILE AND LEON | IRRIGATION OF SMALL PONDS IN THE TAJO | BLOCK | ÁVILA | 1.584 |
| TottoCastile and León | 22.284 |
NEW AREAS STUDY NOT CARTOGRAPHED (3)
| AUTONOMOUS COMMUNITY | REGULABLE AREA | HYDROGRAPHIC BASIN | PROVINCE | IRRIGABLE SURFACE (ha) |
|---|---|---|---|---|
| CASTILLA LA MANCHA | SHARP | GUADIANA | REAL CITY | 400 |
| CASTILLA LA MANCHA | CARPET | GUADIANA | REAL CITY | 300 |
| CASTILLA LA MANCHA | MARISANCHEZ – LA CABEZUELA | GUADIANA | REAL CITY | 1.400 |
| CASTILLA LA MANCHA | PICÓN | GUADIANA | REAL CITY | 700 |
| CASTILLA LA MANCHA | PORT OF VALLEHERMOSO | GUADIANA | REAL CITY | 800 |
| CASTILLA LA MANCHA | BULLARQUE RETUERTA | GUADIANA | REAL CITY | 300 |
| CASTILLA LA MANCHA | THE FLINT | GUADIANA | BASIN | 500 |
| CASTILLA LA MANCHA | HOUSES OF JUAN NUÑEZ | JÚCAR | ALBACETE | 250 |
| CASTILLA LA MANCHA | FUENSANTA | JÚCAR | ALBACETE | 500 |
| CASTILLA LA MANCHA | JONQUERA | JÚCAR | ALBACETE | 350 |
| CASTILLA LA MANCHA | THE AGES | JÚCAR | ALBACETE | 400 |
| CASTILLA LA MANCHA | CAÑETE | JÚCAR | BASIN | 400 |
| CASTILLA LA MANCHA | LANDETE | JÚCAR | BASIN | 400 |
| CASTILLA LA MANCHA | SISANTE | JÚCAR | BASIN | 700 |
| CASTILLA LA MANCHA | SOUTHWEST OF CUENCA | JÚCAR | BASIN | 1.000 |
| CASTILLA LA MANCHA | VEGA DEL PICAZO | JÚCAR | BASIN | 400 |
| CASTILLA LA MANCHA | ALCADOZO | SAFE | ALBACETE | 600 |
| CASTILLA LA MANCHA | CANCARIX AND MINATEDA | SAFE | ALBACETE | 600 |
| CASTILLA LA MANCHA | FUENTEÁLAMO | SAFE | ALBACETE | 350 |
| CASTILLA LA MANCHA | HELLÍN (2ND EXTENSION) | SAFE | ALBACETE | 595 |
| CASTILLA LA MANCHA | ALBALATE | BLOCK | BASIN | 500 |
| CASTILLA LA MANCHA | ERVACICA | BLOCK | BASIN | 600 |
| CASTILLA LA MANCHA | UPPER TAJUÑA | BLOCK | GUADALAJARA | 500 |
| CASTILLA LA MANCHA | RIVERS OF ENTREPEÑAS AND BUENDÍA | BLOCK | GUADA, CUENCA | 3.500 |
| CASTILLA LA MANCHA | CAÑAMARES RIVER | BLOCK | GUADALAJARA | 500 |
| CASTILLA LA MANCHA | TAJUÑA MEDIO | BLOCK | GUADALAJARA | 2.460 |
| Tottol CASTILLA-LA MANCHA | 19.005 | |||
| CATALONIA | VARIOUS FROM BAJO SEGRE | EBRO | LLEIDA | 2.000 |
| CATALONIA | PRIVATE LOWER EBRO | EBRO | TARRAGONA | 2.000 |
| TottoCatalonia | 4.000 | |||
| VALENCIAN COMMUNITY | PRIVATE ONES OF THE JÚCAR | JÚCAR | VALENC,CASTEL,A LIC | 15.000 |
| Tottol VALENCIAN COMMUNITY | 15.000 | |||
NEW AREAS STUDY NOT CARTOGRAPHED (4)
| AUTONOMOUS COMMUNITY | REGULABLE AREA | HYDROGRAPHIC BASIN | PROVINCE | IRRIGABLE SURFACE (ha) |
|---|---|---|---|---|
| ESTREMADURA | EXTENDED SECTOR VIII OF ZÚJAR | GUADIANA | BADAJOZ | 1.100 |
| ESTREMADURA | OLIVE GROVE IRRIGATION IN GUADIANA | GUADIANA | BADAJOZ, CÁCERES | 2.500 |
| ESTREMADURA | VEGA DEL RIO LÁCARA | GUADIANA | BADAJOZ | 200 |
| Tottol EXTREMADURA | 3.800 | |||
| THE BASQUE COUNTRY | ANDOLLU | EBRO | ÁLAVA | 70 |
| THE BASQUE COUNTRY | ARRATUS | EBRO | ÁLAVA | 1.000 |
| THE BASQUE COUNTRY | ASPURU | EBRO | ÁLAVA | 120 |
| THE BASQUE COUNTRY | AZACETA | EBRO | ÁLAVA | 100 |
| THE BASQUE COUNTRY | LA BASTIDA, BAÑOS DE EBRO AND YÉCORA | EBRO | ÁLAVA | 1.700 |
| THE BASQUE COUNTRY | THE PLANS – BERNEDO | EBRO | ÁLAVA | 594 |
| THE BASQUE COUNTRY | MAESTU | EBRO | ÁLAVA | 800 |
| THE BASQUE COUNTRY | MENDILUCIA | EBRO | ÁLAVA | 1.000 |
| THE BASQUE COUNTRY | OYÓN | EBRO | ÁLAVA | 500 |
| TottoThe Basque Country | 5.884 | |||
| RIOJA | IRRIGATION SYSTEMS OF POSADAS | EBRO | RIOJA | 1.500 |
| RIOJA | IRRIGATION AREAS ON THE LEFT BANK OF THE EBRO | EBRO | RIOJA | 1.000 |
| RIOJA | PRIVATE ELEVATIONS OF THE EBRO | EBRO | RIOJA | 2.000 |
| Tottol RIOJA | 4.500 | |||
| Tottol NATIONAL | 163.568 |
4.4.4 Summary of surfaces of new areas studied
NEW AREAS STUDYED IRRIGATED AREA (ha) BY HYDROGRAPHIC BASINS
| HYDROGRAPHIC BASIN | CARTOGRAPHED AREAS | OTHER POTENTIAL AREAS | REGULABLE SURFACE |
|---|---|---|---|
| DUERO | 228.803 | 11.700 | 240.503 |
| BLOCK | 26.133 | 9.644 | 35.777 |
| GUADIANA | 80.783 | 13.200 | 93.983 |
| GUADALQUIVIR | 25.163 | 67.800 | 92.963 |
| SOUTHERN SPAIN | 1.708 | 5.000 | 6.708 |
| SAFE | – | 2.145 | 2.145 |
| JÚCAR | 24.778 | 19.555 | 44.333 |
| EBRO | 300.089 | 30.374 | 330.463 |
| INTERNAL MEDIA OF CATALONIA | – | – | – |
| BALEARICS | – | 750 | 750 |
| CANARY ISLANDS | – | 3.400 | 3.400 |
| TEITHERT.A.L NATIONAL | 687.457 | 163.568 | 851.025 |
NEW AREAS STUDYED IRRIGATED AREA (ha) BY AUTONOMOUS COMMUNITIES
| AUTONOMOUS COMMUNITY | CARTOGRAPHED AREAS | OTHER POTENTIAL AREAS | REGULABLE SURFACE |
|---|---|---|---|
| ANDALUSIA | 36.677 | 77.800 | 114.477 |
| ARAGON | 171.788 | 7.145 | 178.933 |
| BALEARICS | – | 750 | 750 |
| CANARY ISLANDS | – | 3.400 | 3.400 |
| CASTILLA LA MANCHA | 39.411 | 19.005 | 58.416 |
| CASTILE AND LEON | 247.474 | 22.284 | 269.758 |
| CATALONIA | 41.093 | 4.000 | 45.093 |
| ESTREMADURA | 70.977 | 3.800 | 74.777 |
| NAVARRE | 32.003 | – | 32.003 |
| THE BASQUE COUNTRY | 28.700 | 5.884 | 34.584 |
| RIOJA | 7.834 | 4.500 | 12.334 |
| VALENCIAN | 11.500 | 15.000 | 26.500 |
| TEITHERT.A.L NATIONAL | 687.457 | 163.568 | 851.025 |
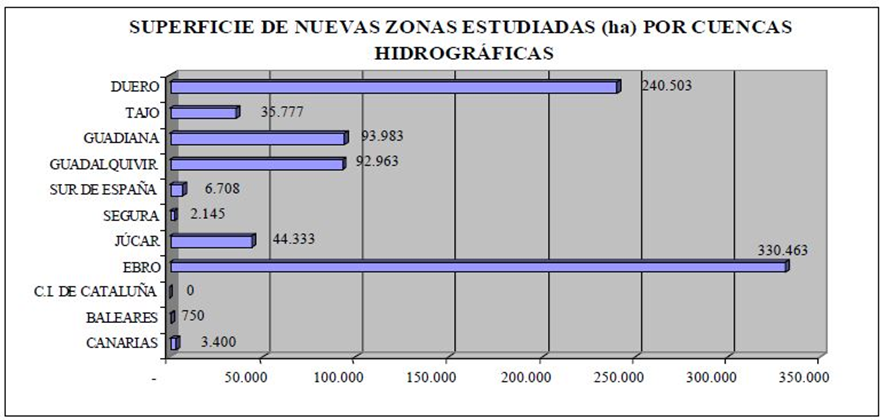
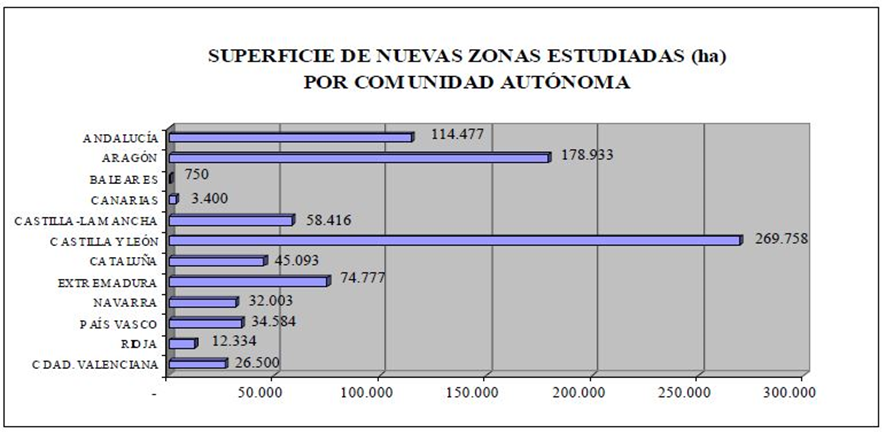
4.4.5 Evaluation of the new areas studied with cartographic representation
For the preparation of the PNR action program regarding new irrigation or future irrigable areas, all areas have been classified according to the technical and economic viability of the transformation, excluding from the income of the farms the CAP aid in those crops whose maximum guaranteed areas or productions have been reached.
The technical and economic feasibility and the social desirability of the possible transformation of an area into irrigated land are determined by analyzing the following factors:
- Natural soil conditions and topography.
- Climatic factors.
- Applied water quality.
- Crop alternatives before and after transformation.
- Environmental impact of the transformation.
- Available human resources.
- Social impact of the transformation.
- Economic impact of the transformation.
For the PNR H-2008 action program, as is logical, the availability of the water needed for irrigation has been analyzed, according to the degree of execution of the regulation works and the forecasts in relation to them in the different horizons of the River Basin Hydrological Plans.
4.4.6 Evaluation of the new areas studied without cartographic representation
For the new areas studied included in this section, the analysis of their technical-economic viability and social convenience has been carried out, applying the same methodology as for the significant new areas studied, also proceeding to the classification in groups, considering the availability of water and the technical-economic viability of the farms without considering the subsidies from the CAP in those crops whose maximum guaranteed areas or productions are reached.
Regarding water availability, it is considered that, due to the characteristics of these areas, which are smaller, usually less than 1,000 ha, and those that, having a considerable surface area, lack individual physical entity due to their geographical dispersion, the latter generally being transformed by private initiative, are considered to have possible access to water, or that the works necessary for its collection and regulation are not important.
The action program for these irrigation systems is included in the heading “Action programs for new irrigation systems”.
4.4.7 Result of the evaluation of potentially irrigable areas
The most significant overall results obtained are shown in the attached graphs.
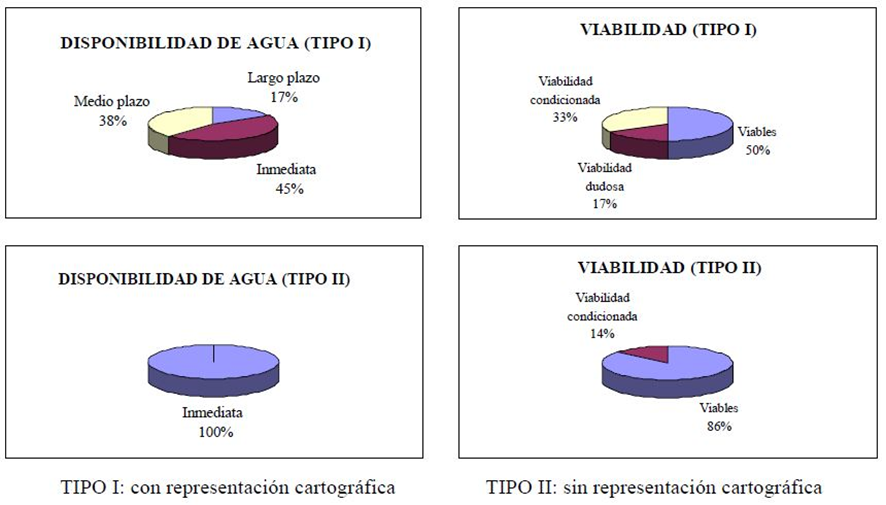
These results have a preliminary and indicative scope, which must be verified and compared in each specific case, since, sometimes, sociological parameters relating to the activity of potential users, which have not been considered in previous studies, are decisive for whether a transformation takes place or not.
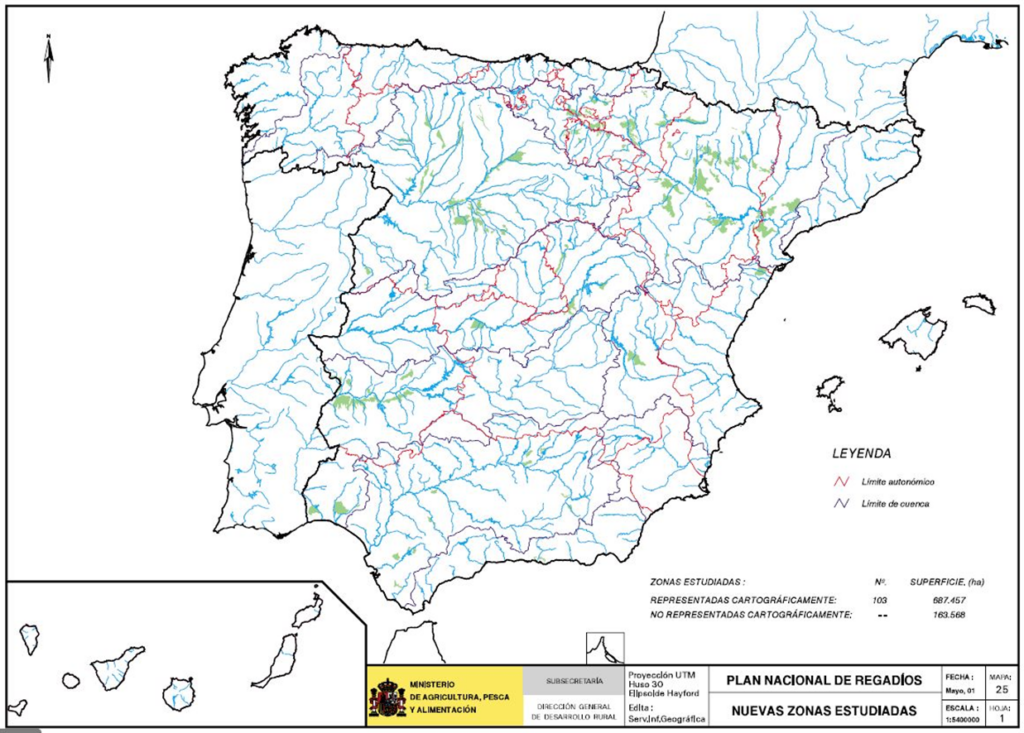
4.5 Economic analysis of irrigated farms
4.5.1 Description
Among the criteria that must be applied in the assessment, selection and prioritization of the interest of a transformation to irrigation, there must be, as is natural, the foreseeable economic results in the affected farms, which requires, for each of the areas considered, an analysis of the current and potential crops (production costs, prices received and paid, gross income, etc.), as well as the determination of appropriate indicators to evaluate the different irrigable areas.
To this end, and using the methodology described below, 449 selected areas have been studied throughout the national territory, comprising a total area of 8.77 million hectares, of which 2.83 million hectares correspond to irrigated land and the remaining 5.94 million hectares are dryland.
For each of these areas, the study considers both irrigated farms and dryland crops in mixed farms, since their economic indicators serve as a reference for nearby areas that may be subject to transformation.
The graph below shows the areas studied broken down by river basins.
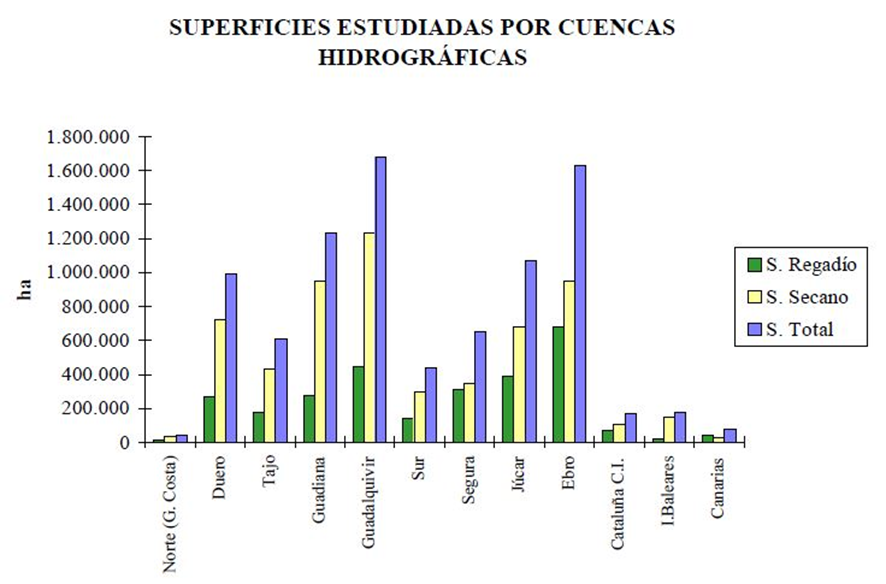
The studies in the 449 zones were conducted following the methodological process outlined in the table below. Data collection regarding techniques used, expenses, income, production costs, etc., for the most significant crops in each zone was based on field surveys, ensuring a high degree of reliability in the indicators obtained, within the required levels of reasonable approximation.
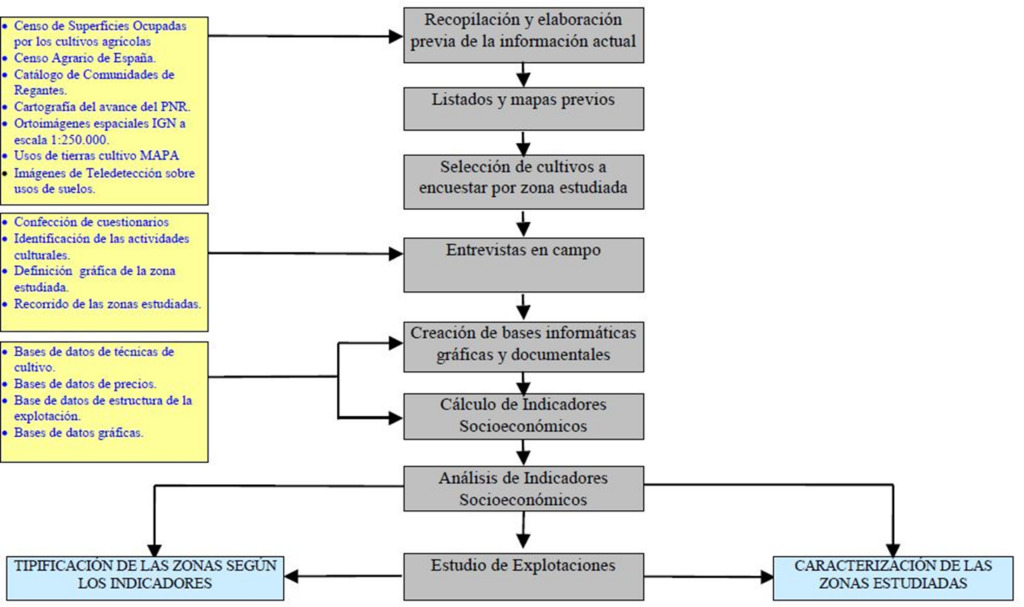
Using this methodology, economic indices for crops, as well as for different cropping alternatives in dryland, irrigated, and mixed farms in each area, have been obtained. The different indices and economic relationships are represented in the following table:
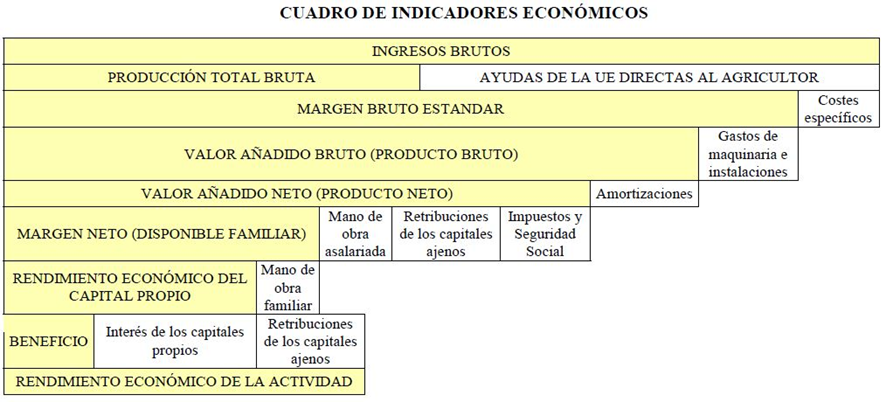
4.5.2 Summary of results
The information and results obtained from the studies carried out in the 449 areas analyzed are so copious that it is not possible to include them all in this section, which therefore only presents a graphic summary of the most significant indices, which allow the evaluation of the transformations in irrigation of new areas or those that are in execution.
The large number of areas studied and the variability of the economic results suggest that they should be grouped by district. The first two maps below allow for a comparison, within each agricultural district, of the average gross income (pesetas/hectare) obtained under dryland and irrigated farming. This reflects, in some cases, the increased production resulting from the transformations and, in others, the changes in production orientation that may occur when shifting from extensive dryland crops (cereals, for example) to higher-value, more intensive crops (fruits, vegetables, tubers, etc.).
In two other maps, the net margin (ptas/ha) is broken down into dryland and irrigated areas, which is the index that expresses the economic resources remaining in families after deducting the actual farm expenses from total income.
Finally, maps are included showing the ratios of "gross income and profits obtained per cubic meter of water used", which indicate how, in general, the results are more favorable in the Mediterranean regions, inland Andalusia and the Ebro Valley, than in the two Mesetas.
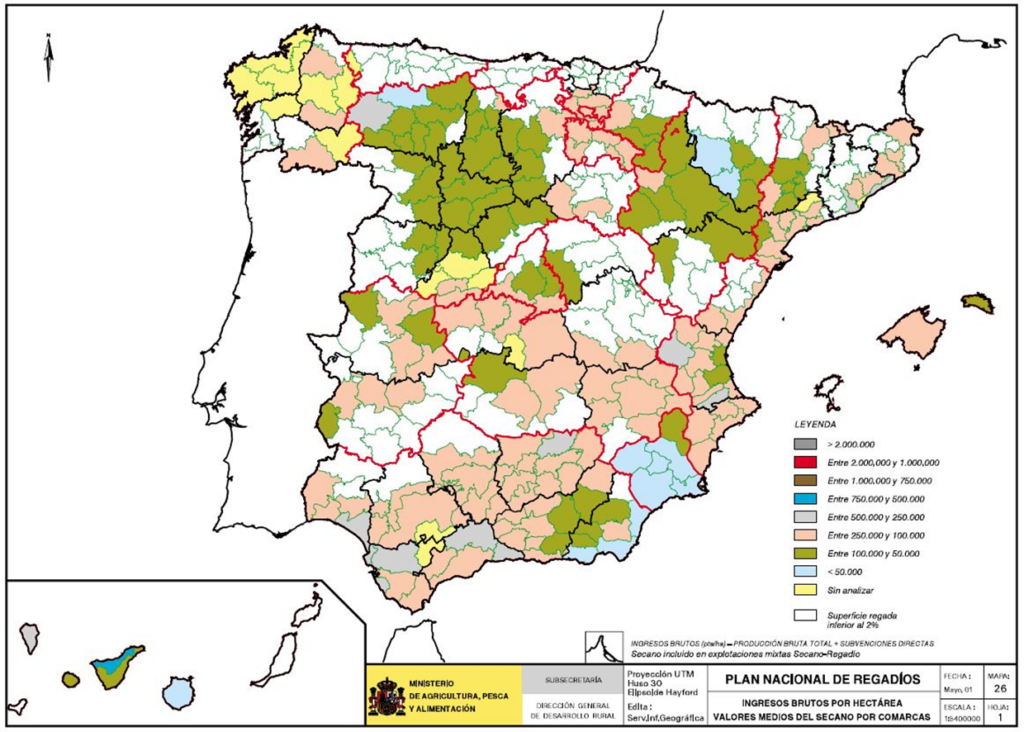
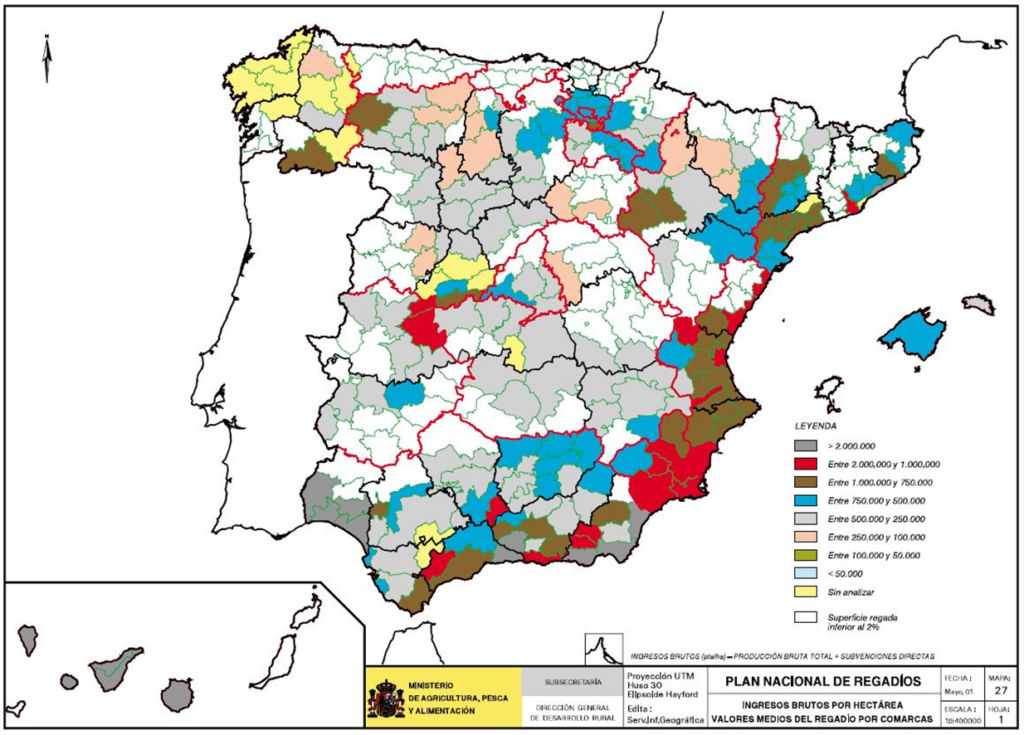
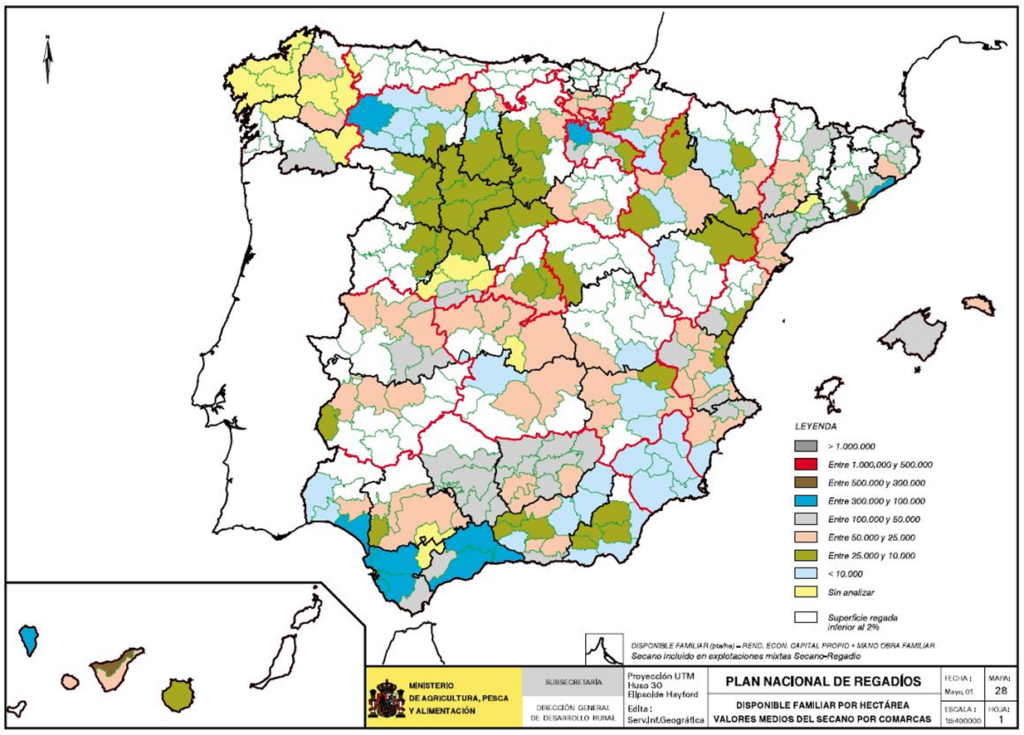
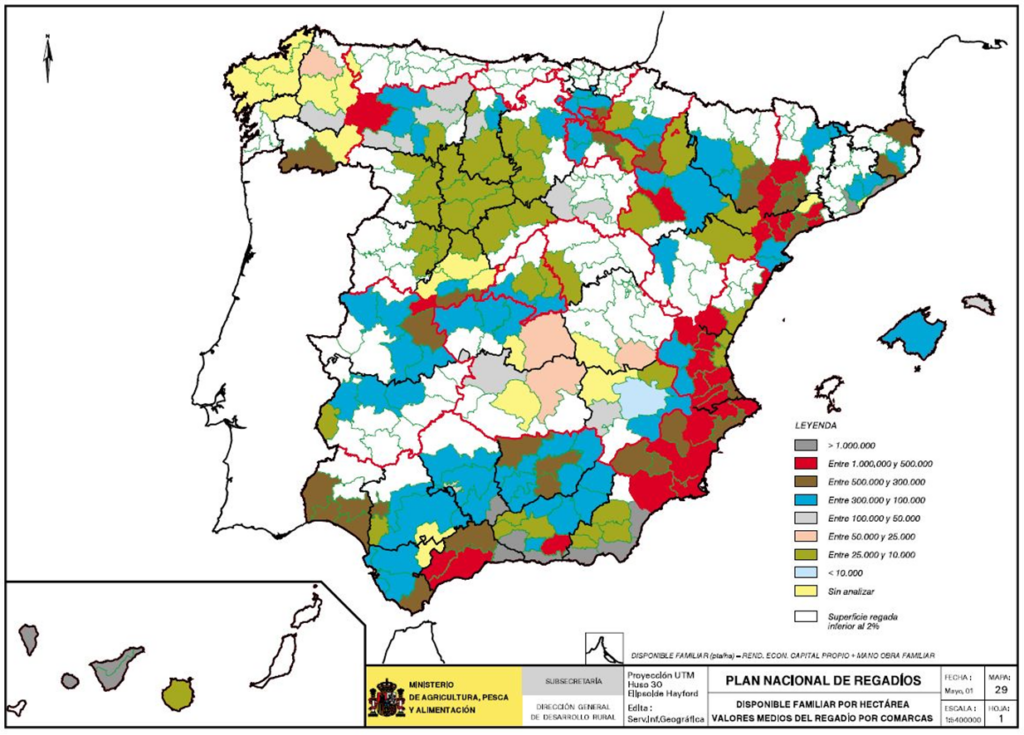
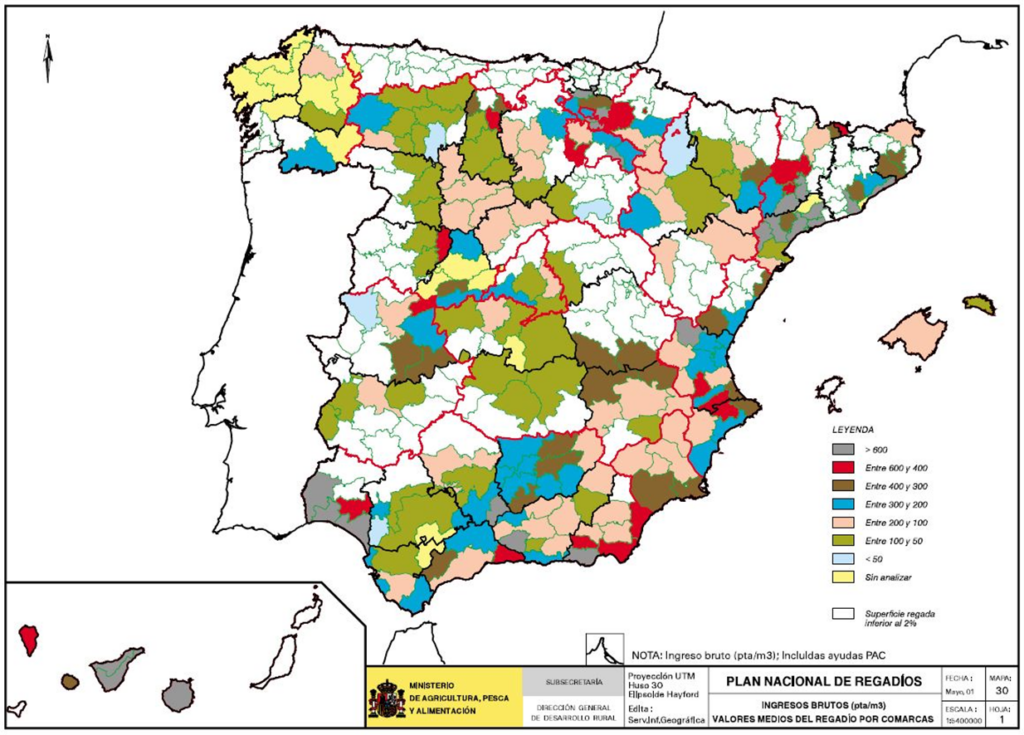
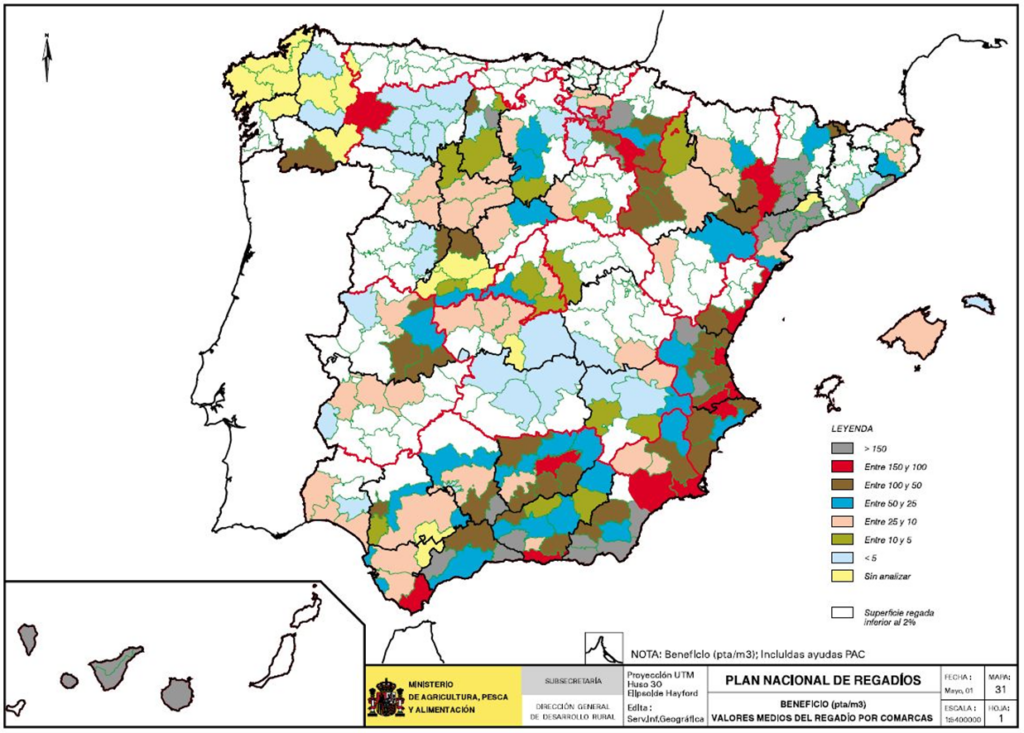
4.6 Groundwater
Numerous studies exist on the definition and characterization of aquifers and hydrogeological units. The results presented below are derived from the analysis of these available sources. It should be noted that since the approval of the River Basin Management Plans, there has been an official definition of these hydrogeological units; however, in this chapter, and in a non-systematic manner, information from various previous sources has been used to provide, without claiming to be exhaustive, a general overview of the status of these resources in relation to irrigation uses.
In the different studies carried out by the ITGE and the DGOH, the River Basin Hydrological Plans and the White Paper on Water, 467 hydrogeological units have been defined with an annual recharge evaluated at 29,908 hm3, located on an area of 174,745 km2 and an average annual exploitation of 5,532 hm³3/year, which represents approximately 18.5% of the natural recharge.
The fact that annual extraction represents only 18% of annual recharge, and the existence at the same time of a series of overexploited hydrogeological units, in which extractions for irrigation represent 85%, demonstrates a complex problem, so the same diagnosis cannot be applied to all these units as well as to irrigable areas with groundwater.
In relation to the exploitation regime and recharge, we can classify the hydrogeological units as:
- Over-exploited.
- At risk of over-exploitation.
- With problems of seawater intrusion.
- Normally exploited.
4.6.1 Overexploited hydrogeological units
The overexploitation of hydrogeological units, regardless of their impact on associated aquatic and surface ecosystems, such as wetlands, and the discontinuity of their flows, has economic and social implications to consider.
According to the Regulation of Public Water Domain, article 171.2, an aquifer is considered over-exploited, or at risk of over-exploitation, when the subsistence of the existing uses in it is in danger or when there is a serious deterioration of the quality of the water as a result of carrying out annual extractions that are higher or very close to the average volume of the annual renewable resources, or that produce a serious deterioration of the quality of the water.
Regardless of this legal concept of overexploitation, which entails the declaration of overexploitation and which currently includes 15 hydrogeological units with provisional or definitive declaration, plus two units declared by the Generalitat of Catalonia and 21 more aquifers with extraction limitations, there are currently 61 hydrogeological units, 44 of them on the peninsula and 17 in the Balearic and Canary archipelagos, in which the volume of extractions exceeds that of natural recharge.
The estimated reserves for the peninsular hydrogeological units are 27,423 hm3 with an estimated operating deficit of 666 hm3/year, affecting 418,890 hectares of irrigated land.
| Watershed | Autonomous Community | No. of hydrogeological units | Deficit (hm)3/year) |
|---|---|---|---|
| Guadiana | Castilla la Mancha | 1 | 240,0 |
| Guadalquivir | Andalusia | 1 | 10,0 |
| South | Andalusia | 8 (5+3 shared with Segura) | 74,5 |
| Valencian | 14 (8+6 shared with Segura) | 88,0 | |
| Safe | Murcia | 16 (7 + 6 shared with the Júcar + 3 shared with the South) | 152,0 |
| Valencian | 3 | 25,7 | |
| Castilla la Mancha | 4 | 12,7 | |
| Andalusia | 3 | 7,0 | |
| CI Catalonia | Catalonia | 3 | 10,4 |
| Balearics | Balearics | 7 | 14,0 |
| Canary Islands | Canary Islands | 10 | 32,0 |
| Total | 61 | 665,9 |
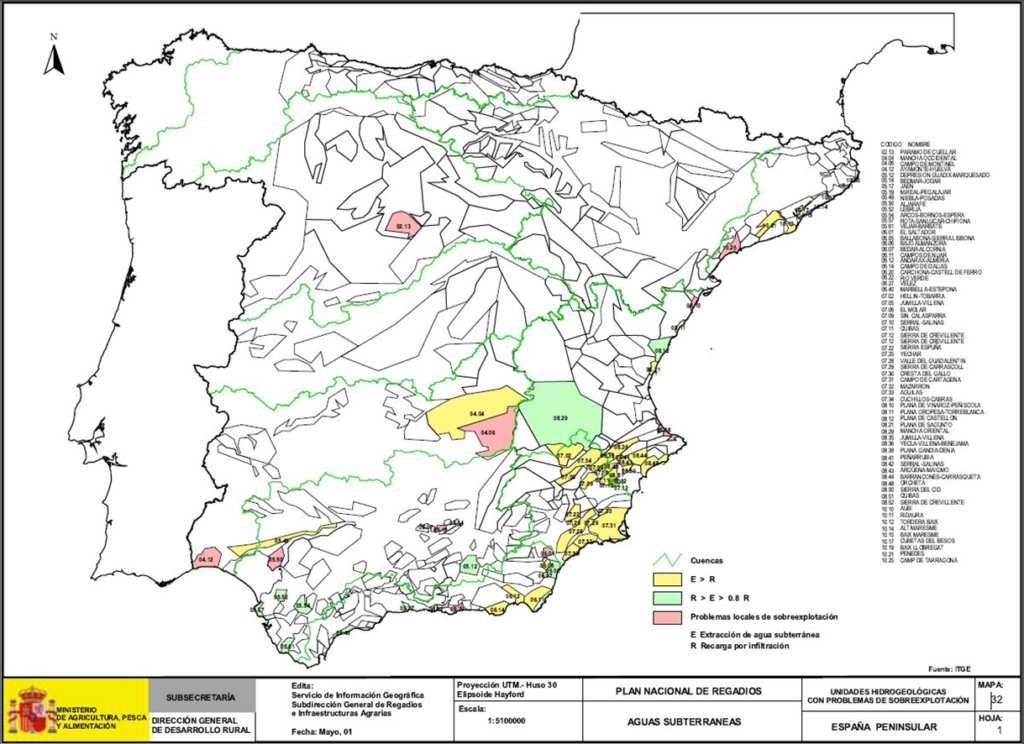
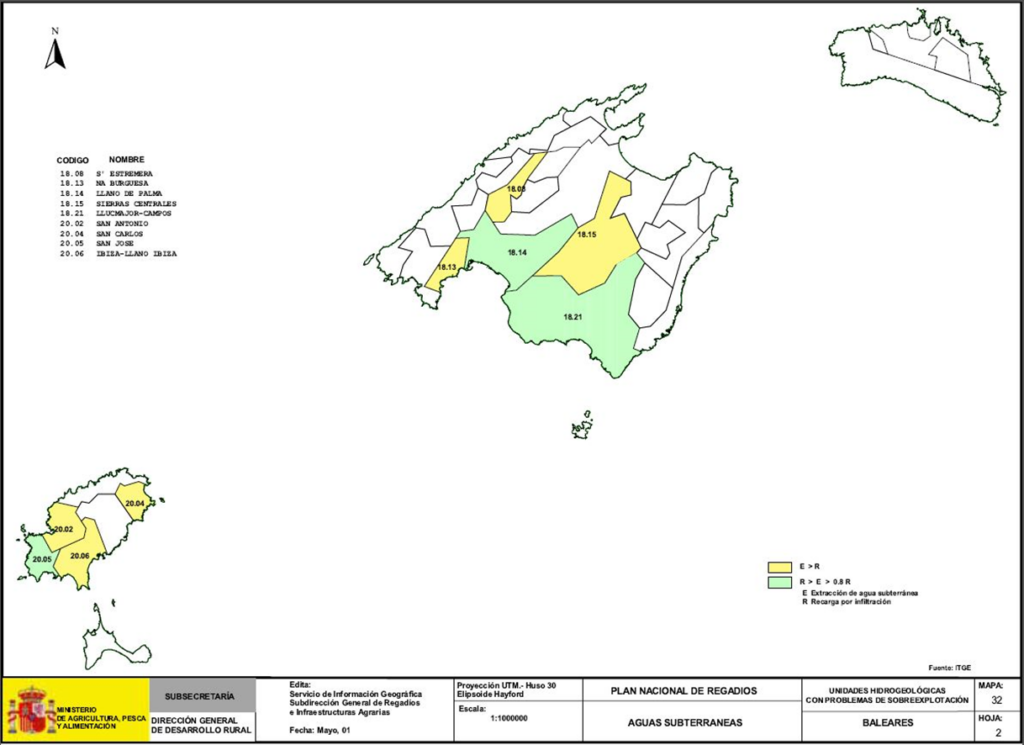
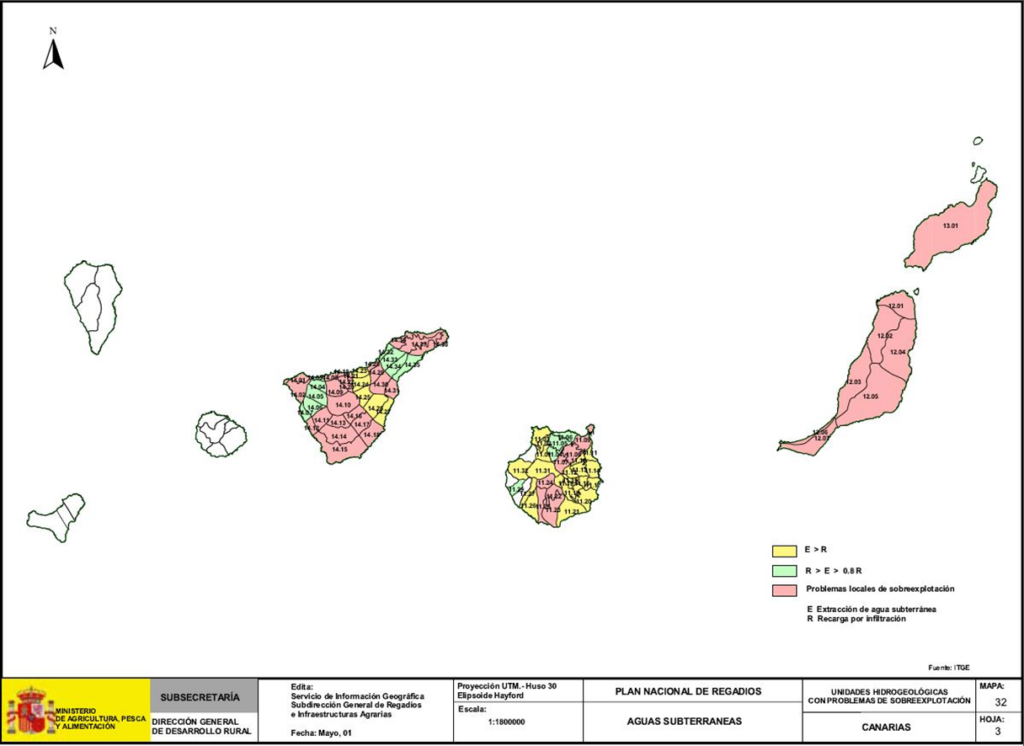
4.6.2 Hydrogeological units at risk of overexploitation
Twenty-three hydrogeological units have been considered in which the pumping/recharge index is between 0.8 and 1, indicating a risk of over-exploitation.
HYDROGEOLOGICAL UNITS WITH RISKS OF OVER-EXPLOITATION PUMPING/RECHARGE INDEX (between 0.8 and 1.0)
| BASIN | HYDROGEOLOGICAL UNIT | INDEX BOMB/RECHARGE |
|---|---|---|
| GUADALQUIVIR | Guadix – Marquesado | 0.88 |
| Bezmar – Jodar | 1.00 | |
| Jaén | 0.96 | |
| Lebrija | 0.86 | |
| Arcos – Bornos – Espera | 1.00 | |
| Rota - Sanlúcar - Chipiona | 0.94 | |
| Béjer – Barbate | 0.85 | |
| SOUTH | Under Almanzora | 1.00 |
| Green River | 0.81 | |
| Vélez River | 0.82 | |
| Marbella – Estepona | 0.88 | |
| JÚCAR | Castellón Plain | 0.89 |
| Eastern Spot | 0.88 | |
| INTERNAL BASINS OF CATALONIA | Ridaura | 1.00 |
| Tordera Baix | 1.00 | |
| Tordera Mig and Alt | 0.92 | |
| BALEARICS | Palm Plain | 0.82 |
| Lluchmayor – Campos | 0.85 | |
| Saint Joseph | 0.95 | |
| CANARY ISLANDS | Tascarte | 0.92 |
| Dorsal – Santa Cruz | 0.80 | |
| Aznaje | 0.88 | |
| Santiago – Teide | 0.87 |
4.6.3 Hydrogeological units with local overexploitation problems
Units where the pumping/recharge index has been found to be below 0.8 but where, nevertheless, significant decreases in levels have been detected or a degradation of water quality has occurred, requiring corrective measures, have been considered as units with occasional problems of over-exploitation.
HYDROGEOLOGICAL UNITS WITH SPECIFIC PROBLEMS OF OVEREXPLOITATION
| BASIN | HYDROGEOLOGICAL UNIT | PUMPING/RECHARGE INDEX |
|---|---|---|
| DUERO | Cuellar Moor | 0.63 |
| GUADIANA | Ayamonte – Huelva | 0.46 |
| GUADIANA – GUADALQUIVIR | Montiel Field | 0.41 |
| GUADALQUIVIR | Aljarafe | 0.50 |
| Mancha Real – Realgar | 0.25 | |
| SOUTH | The Jumper | 0.77 |
| Carchuna – Castel de Ferro | 0.75 | |
| JÚCAR | Vinaroz – Peñíscola | 0.67 |
| Gandia – Denia | 0.50 | |
| INTERNAL BASINS OF CATALONIA | Aubi | 0.76 |
| Maresme | 0.66 | |
| Tarragona Camp | 0.67 | |
| CANARY ISLANDS | Lanzarote | 0.06 |
| Fuerteventura | 0.34 | |
| Guiniguada | 0.77 | |
| Fataga | 0.57 | |
| Taurus | 0.45 | |
| I have | 0.20 | |
| Cañadas | 0.46 | |
| Guía de Isora | 0.74 | |
| Arona – San Miguel | 0.52 | |
| Passion fruit | 0.23 | |
| Tagaic | 0.43 | |
| Dorsal – Candelar | 0.75 | |
| Anagu | 0.66 |
4.6.4 Hydrogeological units with marine intrusion problems
When a hydrogeological unit whose natural drainage flows directly to the sea experiences water extraction that, generally or locally, alters the freshwater-saltwater interface, an increase in salts occurs in the water body. This can severely affect irrigated crops that benefit from water originating in these hydrogeological units, as this increase in salts leads to a loss of water quality, thus limiting its applications.
The exploitation of coastal aquifers where extractions exceed recharge presents serious problems due to the advance of the freshwater and saltwater interfaces and, consequently, to their salinization.
Of the 82 coastal hydrogeological units in the peninsula and the Balearic Islands, 58% of them present some degree of marine intrusion which can be of three types: local, zonal and generalized.
4.6.5 Pollution from agricultural activities
Agricultural activities, depending on the characteristics of the soils, the water regime and the cultural practices, can add undesirable organic or inorganic chemical elements to groundwater, potentially affecting human consumption.
These activities can be a significant factor in altering the natural quality of groundwater, as they add pollutants, the most significant being those derived from:
- Fertilizers, mainly nitrogenous ones.
- Pesticides, due to their characteristics, are retained or adsorbed in the soil and their decomposition can give rise to a series of residues that are sometimes more toxic than the original pesticides.
- Waste from agricultural activities, organic and bacteriological pollutants, that are stored in inappropriate places or are used as fertilizers.
Directive 676/91/EEC, concerning the protection of waters against pollution caused by nitrates used in agriculture, seeks to limit and correct the effects that nitrogen inputs from fertigation and livestock farming have on the quality of groundwater.
In accordance with the directive and the Regulation derived from its transposition into national law RD 261/1996 of February 16 (BOE of March 11).
The Autonomous Communities have declared the areas vulnerable to nitrate pollution, in accordance with the aforementioned Royal Decree, or the non-existence thereof, by drafting the mandatory codes of good agricultural practices.
The irrigated area included within the declared vulnerable zones amounts to 610,939 ha, with a net predominance of surface water and the gravity irrigation application system, as can be seen in the attached tables.
Improving the environmental quality of groundwater involves not only reducing fertilizer doses and implementing better environmental practices, but also improving irrigation water application systems, and in the case of groundwater irrigation, ensuring that irrigators correctly apply the fertilizer volumes supplied with the irrigation water.
IRRIGATED AREA IN VULNERABLE AREAS (ha and %) ACCORDING TO WATER SOURCE
| Origin of water | Area (ha) | % |
|---|---|---|
| Superficial | 345.000 | 56,47 |
| Underground | 260.263 | 42,60 |
| Transfers | – | – |
| Returns | 4.196 | 0,69 |
| Purifiers | 1.433 | 0,23 |
| Desalination plants | 47 | 0,01 |
| Total | 610.939 | 100,00 |
IRRIGATED AREA IN VULNERABLE AREAS (ha and %) ACCORDING TO THE IRRIGATION SYSTEM
| Irrigation system | Area (ha) | % |
|---|---|---|
| Gravity | 322.605 | 52,8 |
| Aspersion | 165.183 | 27,0 |
| Located | 123.151 | 20,2 |
| Total | 610.939 | 100,0 |
IRRIGATED AREA IN VULNERABLE AREAS (ha and %) BY AUTONOMOUS COMMUNITY
| Autonomous Community | Area (ha) | % |
|---|---|---|
| Andalusia | 239.616 | 39,2 |
| Aragon | 9.483 | 1,6 |
| Balearics | 4.525 | 0,7 |
| Canary Islands | 5.712 | 0,9 |
| Castile and León | 8.513 | 1,4 |
| Castilla la Mancha | 111.205 | 18,2 |
| Catalonia | 81.528 | 13,3 |
| Valencian Community | 146.713 | 24,0 |
| the Basque Country | 3.644 | 0,6 |
| Total | 610.939 | 100,0 |
4.6.6 Groundwater and irrigation
The total irrigated area supplied predominantly with groundwater amounts to 942,244 ha, which represents approximately 28% of the total irrigated area.
SUPERFYocYoIRRIGATED WITH GROUNDWATER (ha and %) BY HYDROGRAPHIC BASIN
| Watershed | Area (ha) | % |
|---|---|---|
| Galicia Coast | – | – |
| North | 343 | 0,1 |
| Douro | 108.815 | 11,5 |
| Block | 2.057 | 0,2 |
| Guadiana | 159.853 | 17,0 |
| Guadalquivir | 134.537 | 14,3 |
| South | 72.355 | 7,7 |
| Safe | 115.450 | 12,3 |
| Júcar | 223.685 | 23,7 |
| Ebro | 43.532 | 4,6 |
| Catalonia CI. | 39.736 | 4,2 |
| Balearics | 15.518 | 1,6 |
| Canary Islands | 26.362 | 2,8 |
| Total | 942.243 | 100,0 |
Regarding the developer of the transformation, 111% of the total irrigated area using groundwater is publicly funded, while for surface water, this percentage rises to 631%. This is mainly due to the private nature of groundwater prior to the enactment of the 1985 Water Law.
The predominant application systems are sprinkler and localized, compared to gravity systems, with pressurized systems representing 65.5% of the irrigated surface, while in surface water irrigation this percentage only reaches 36.5%.
To get a rough idea of the importance of groundwater in irrigation, we can point out that this 281 TP3T of surface area contributes approximately 381 TP3T of the final agricultural production corresponding to irrigation, and consumes 201 TP3T of the total water used for irrigation, while electricity consumption reaches 801 TP3T. This is mainly due to the fact that:
In general, a large proportion of groundwater irrigation systems are located in areas of higher productivity. Irrigation efficiency is higher in groundwater irrigation systems than in those using surface water, for two reasons:
- They use more modern and efficient application systems.
- They prevent losses in pipes from the water source to the plot.
The serious problem facing groundwater resources is that, of the 942,244 hectares, 418,890 hectares (441,000,000) are located above aquifers where extractions exceed recharge, and these areas generally obtain their water resources from these aquifers. The attached table shows, for hydrogeological units with recharge deficits and river basins, the irrigated areas (ha) and gross water requirements (hm³).3) and the deficits (hm3).
OVER-EXPLOITED HYDROGEOLOGICAL UNITS IRRIGATION AREAS (ha), GROSS REQUIREMENTS (hm3) AND DEFICITS (hm3) BY HYDROGRAPHIC BASIN
| Basin | Number of Aquifers | Irrigation surface | Gross needs | Deficit |
|---|---|---|---|---|
| Guadiana | 1 | 127.372 | 566,8 | 240,0 |
| Guadalquivir | 1 | 9.716 | 71,4 | 10,0 |
| South | 8 (*) | 30.487 | 220,2 | 74,5 |
| Safe | 26(*) | 100.626 | 566,2 | 197,4 |
| Júcar | 14(*) | 121.666 | 626,3 | 88,0 |
| Catalonia CI | 3 | 6.140 | 21,9 | 9,7 |
| Balearics | 7 | 9.600 | 41,7 | 14,0 |
| Canary Islands | 11 | 13.283 | 90,9 | 32,2 |
| Total | 61 | 418.890 | 2.205,4 | 665,8 |
Not all water shortages are attributable to agriculture; urban water supplies, tourist developments, and industry also play a role. In any case, it is necessary to promote measures for the recovery of overexploited aquifers.
This program must consider possible solutions:
The 418,890 hectares located above and currently supplied by overexploited aquifers have access to the necessary resources, although this supply cannot be guaranteed in the future, given the aquifer's inability to maintain it. The attached map indicates the areas where irrigation water comes from overexploited aquifers.
These overexploited aquifers must be replenished with other complementary resources or managed for the use of those resources available in the long term or renewable.
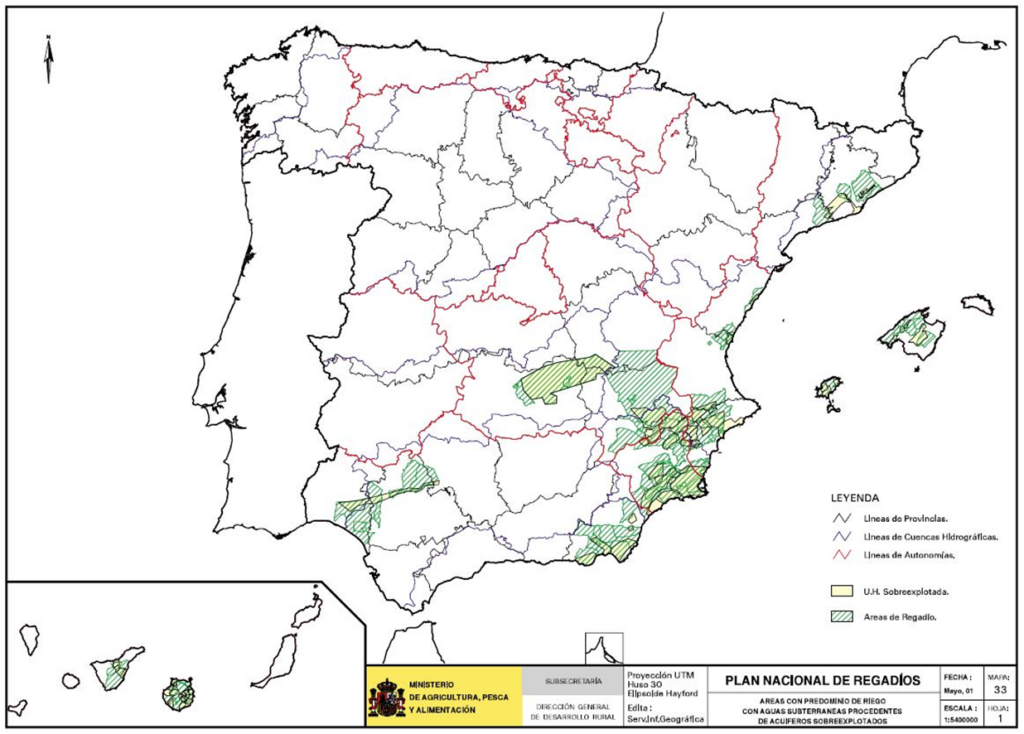
4.7 Irrigation and land management
The implementation or presence of irrigation always constitutes an activity that occupies space within a territory, and is therefore conditioned by the characteristics of that territory while, at the same time, transforming it. The interaction between irrigation planning and land management presents three perspectives:
- Territorial factors that condition irrigation.
- The conditions under which an irrigation policy can reorient the territorial trends of the receiving areas.
- Policies, plans and human actions in general that have a territorial impact, complementing or overlapping at times, even in a conflictive manner.
4.7.1 Territory classification
The study of Spanish irrigation systems and the organization of the territory and rural space has produced a functional classification of Spanish municipalities and regions, establishing the following categories:
| Dryland farming Irrigated agriculture Rancher | Natural Urban Diversified agrarian | Industrial diversified Diversified various Tourist Marginal |
|---|
4.7.2 Rural areas and irrigation
Based on this classification, a list of eight types of rural areas has been compiled according to the two most representative factors of two concepts—physical and socio-economic—used to categorize rural areas. These concepts are the altitude of the territory above sea level and the intensity of human-made land uses in relation to their diversification and evolution.
The relationships between irrigation and the rural areas defined in the study can be summarized as follows:
Depressions of agricultural specializationThe implementation of new irrigation systems and the improvement of traditional ones in these areas can play a significant role in their socioeconomic development, given that they are optimal areas for the development of competitive, extensive agriculture and are at risk of depopulation and fragmentation, as they lie outside the sphere of influence of large centers of economic activity. Irrigation projects, therefore, contribute significantly to both economic and social development.
Highlands and foothills with agricultural specializationThese areas are located at a higher altitude than the previous case, so their agricultural production potential, and therefore their dependence on irrigation, is lower. Their socio-territorial deficiencies themselves jeopardize the development of irrigation, although they may exceed the minimum suitability threshold, thus justifying both improvement and transformation measures, primarily based on social criteria.
Depressions of activity diversificationThese areas have a higher level of socio-territorial development than the previous cases, which means that, on the one hand, the priority of irrigation projects is reduced, although on the other hand, there are greater guarantees of success. They do not experience significant pressure from other uses, so to the extent that there is complementarity with the area's productive structure, they are particularly advisable for carrying out irrigation projects from a primarily economic point of view.
Highlands and foothills of activity diversificationThese areas exhibit a certain degree of socio-territorial development, although this does not interfere with irrigation activities, and their agro-climatic potential is not particularly significant. Therefore, irrigation measures may be advisable, albeit on a small scale.
Mountainous interior and/or with a natural vocationThese areas are unsuitable for competitive agriculture. Consequently, agriculture should be geared towards environmental objectives, and the only advisable approach is to improve existing small-scale traditional irrigation systems, focusing on self-sufficiency or supporting local livestock farming.
Coastline of primary specializationThe pressure exerted on irrigated land by other uses, apart from tourism, is minimal. However, these areas do experience limitations due to soil scarcity or water shortages. In any case, the resulting agriculture is characterized by highly productive crops. Certain specific projects with high profitability, such as greenhouse cultivation, are particularly advisable, as are irrigation projects generally based on economic criteria, with special attention paid to their environmental impact.
Peri-urban coastline and/or evolved activityThese are areas where land and water are in intense competition with other activities, resulting in a continuous conversion of rural land to urban use. Part-time farming with a focus on high-profit production is generally practiced. Irrigation initiatives should concentrate on the conservation and improvement of traditional irrigation systems as an economic, cultural, and agro-environmental asset, and additional actions are not justified in the face of societal demands related to land, water, and employment that are moving away from the agricultural sector.
Peri-urban interior and/or evolved activityThis type of agriculture is generally inland, located in fertile plains, and is highly productive and profitable, although sometimes the infrastructure is outdated. Urban pressure and strong competition from other land uses are very intense, so, as in the previous case, additional interventions are not justified. However, the conservation of traditional irrigation systems is advisable, more for their agro-environmental and socio-cultural value than for their productive value, due to the strong pressure from other uses.
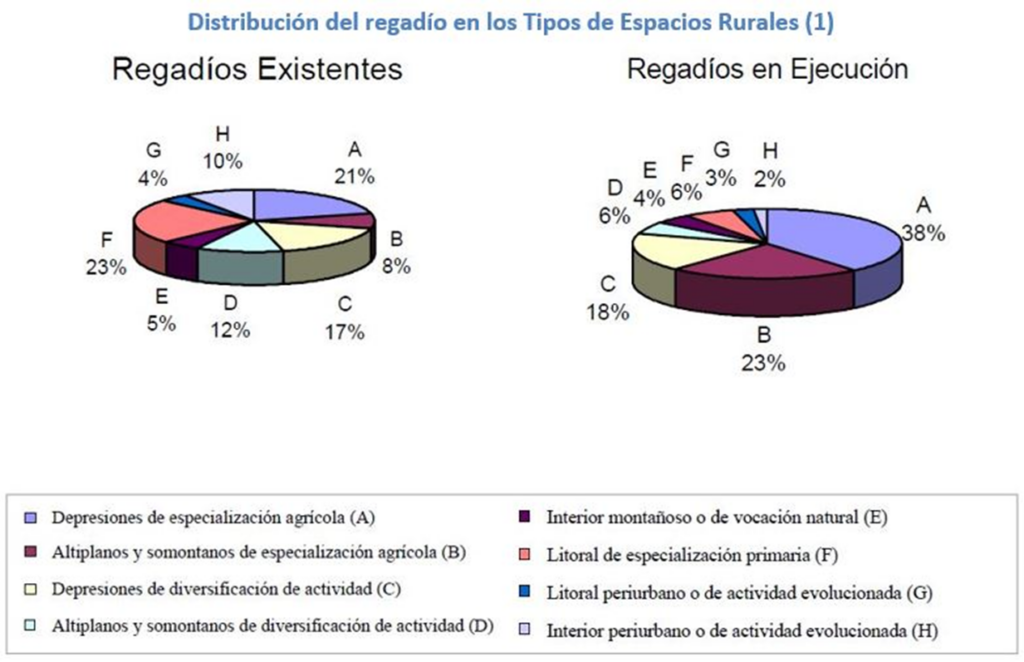
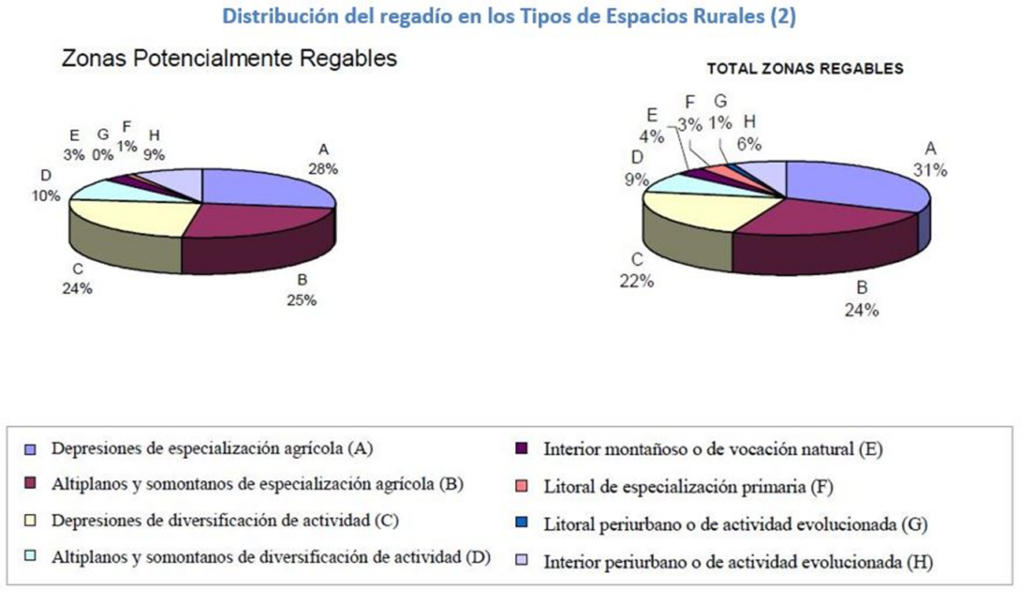
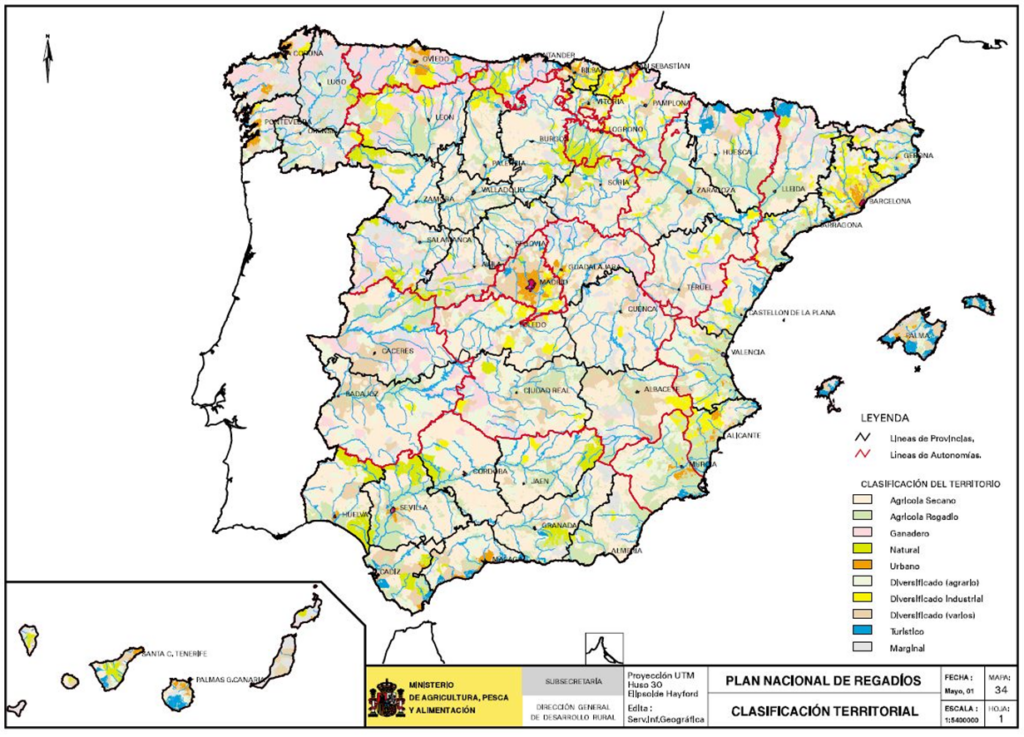
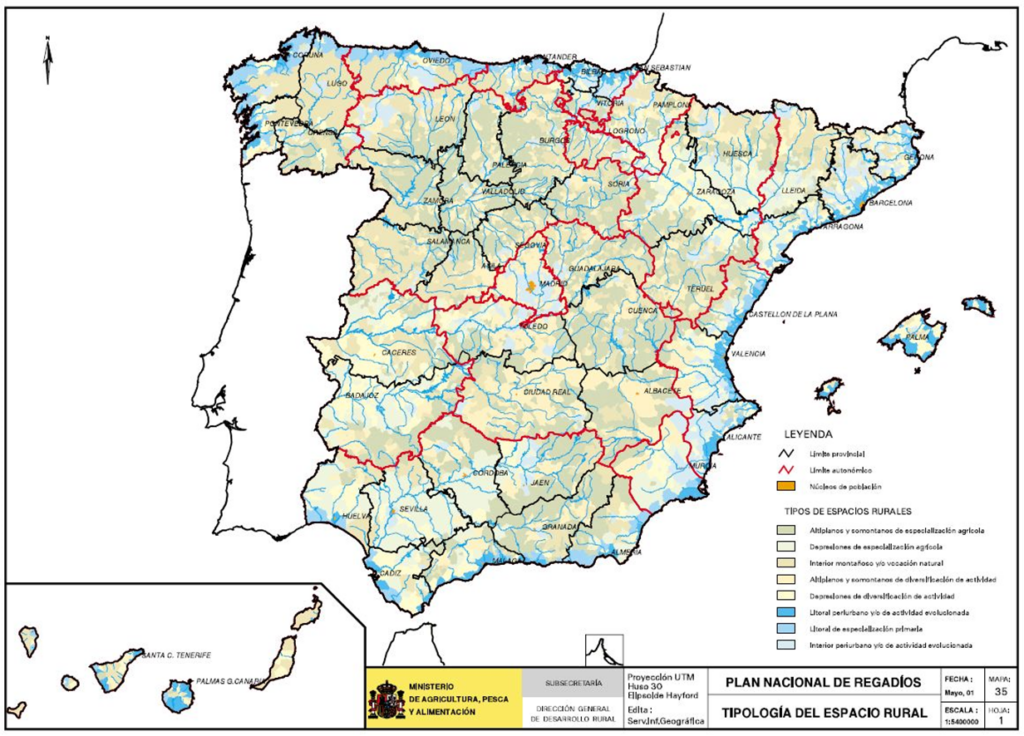
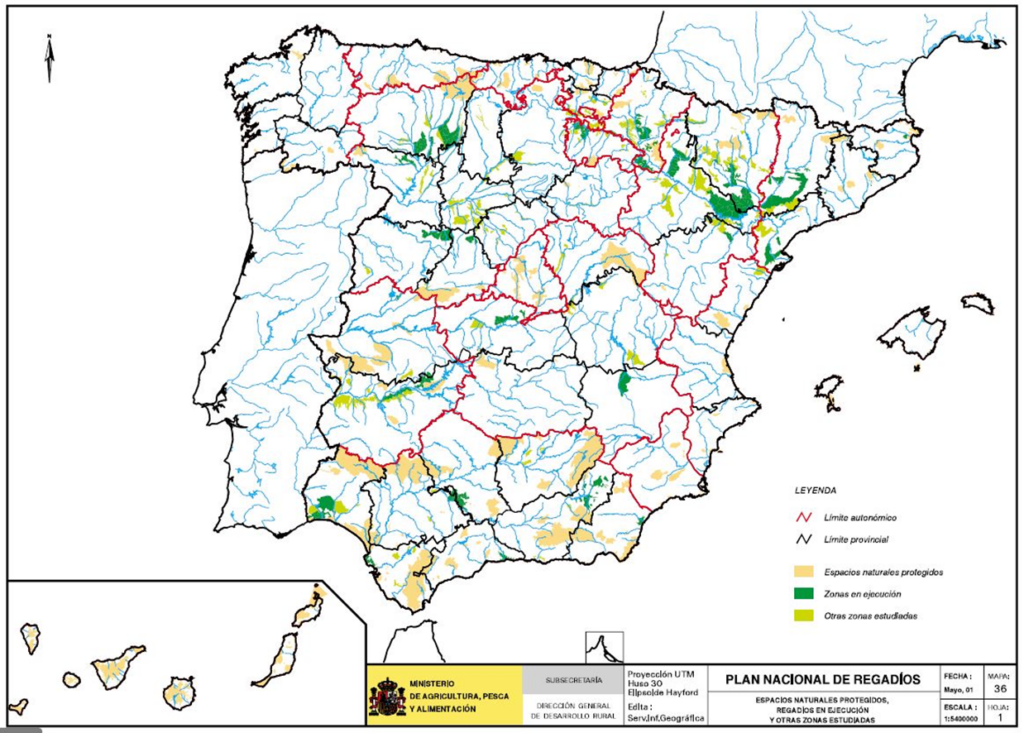
4.8 Irrigation and the environment
4.8.1 Introduction
To achieve sustainable development, it is essential to use natural resources rationally and act with the utmost respect for the environment. This is especially applicable to all actions aimed at rural development, including irrigation transformations. Irrigation planning is a crucial tool for promoting development in many rural areas, but it must incorporate the necessary environmental considerations to ensure that this development is sustainable.
As described in Chapter 2 (methodological synthesis), in the process of preparing the PNR, environmental analyses have been carried out on the irrigation systems in operation and on the potential ones, for their consideration in the planning and development of new areas.
These analyses were carried out on data taken between 1996 and 1998, so it is possible that some of their results have undergone quantitative modifications, mainly due to actions carried out or in progress since the conclusion of the study or to the evaluation, since then, of the degree of protection of the territory, whose latest situation was reflected in section 3.8 on “environmental considerations with an impact on agriculture”.
However, and without prejudice to the fact that the information and environmental analyses of the irrigation systems will be updated throughout the execution of this PNR, the basic contents and the most significant results of the study are incorporated in this section in summary form.
4.8.2 Study Contents
The lines of work followed by the Study were designed based on the following operational objectives:
- Define, quantify and map the current situation of the different irrigated or irrigable areas in relation to the environment.
- Perform the environmental characterization of the affected territory, both at the level of the abiotic and biotic environment.
- Identify, define and assess the most significant current and potential environmental effects or impacts of the actions.
- Determine the protective and corrective measures that, being technically and economically viable, minimize the observed effects.
- Establish the guidelines for an Environmental Monitoring Program.
- Determine the criteria for integration in the various phases of the Environmental Impact Assessment Study (EIA) of the projects that are prepared for the execution of the actions, according to the regulations in force in this respect.
Taking these objectives into account, three main areas were defined in which the study was developed:
- Basic Study (Potential Irrigation)
- Study of Irrigation Systems in Implementation and Operation
- Integration into the EIA procedure.
4.8.3 Basic Study
In this area, the first three Operational Objectives (mapping of potential areas, environmental characterization of the territory and identification and assessment of the most significant environmental impacts) were fulfilled through the following process:
- Global characterization of the irrigated areas and definition of the situation, based on the information collected by the PNR itself
- Inventory of the most significant environmental aspects for irrigation activity; the following environmental variables were defined:
- Soil, as a support and basic element of irrigation;
- Surface hydrology, as a resource for irrigation and, at the same time, as a recipient of irrigation returns;
- Hydrogeology, as a supplier of the water resource, fundamental in many irrigation systems, and, at the same time, as a receiver of returns, more or less directly;
- Vegetation, a natural resource that defines the degree of use and natural quality of the area;
- Fauna, a resource associated with the previous one that defines the quality of nature and the degree of conservation of the areas studied;
- Landscape, the current existence of a catalog of outstanding landscapes is a sufficient condition to take this variable into account when transforming an area into irrigated land;
- For each variable, a series of indicators were defined and, after a comparative analysis of the irrigated areas using the appropriate indicators, through a computer model, the most significant aspects or most problematic points were detected, from an environmental point of view.
4.8.4 Study of Irrigation Systems Under Construction and in Operation
The most important environmental characteristics of several irrigation projects currently under construction, for which an Environmental Impact Assessment has been completed, were analyzed. Likewise, this study characterized the effects or impacts on the physical and socioeconomic environment of certain "historical" irrigation projects, selected based on the type of ecosystem in which they were implemented. This allowed for a comparison of the findings with those of other irrigation projects implemented or planned in similar ecosystems. The selected macro-ecosystems were:
- Steppe ecosystems
- Ecosystems of semi-arid zones
- Wetlands
- Coastal ecosystems
- Dehesas
- Riverbanks
An inventory of the alterations expected from the improvement and modernization of irrigation systems has also been carried out, resulting in a matrix formed in its rows by the actions divided into two types: modernization and improvement, broken down repeatedly until reaching 27 different actions (for example, channeling, power lines, distribution networks, etc.); the columns consider the affected factors, divided according to the environment into abiotic and biotic and perceptual (landscape) and subdivided until reaching 14 categories (for example, erosion, water quality, riparian vegetation, etc.).
4.8.5 Environmental effects in the new areas studied
Studying the environmental characteristics of potential new irrigation transformations is another tool in general planning to detect potential environmental impacts.
An analysis of the environmental situation of the new areas studied was carried out with cartographic representation, studying the variation of the indicators considered according to the most important possible impacts, reflecting in a sheet, for each irrigable area, the components of the indicators with the greatest variations as a consequence of the transformation into irrigation, presenting below in the graph the percentage of the affected areas at the national level.
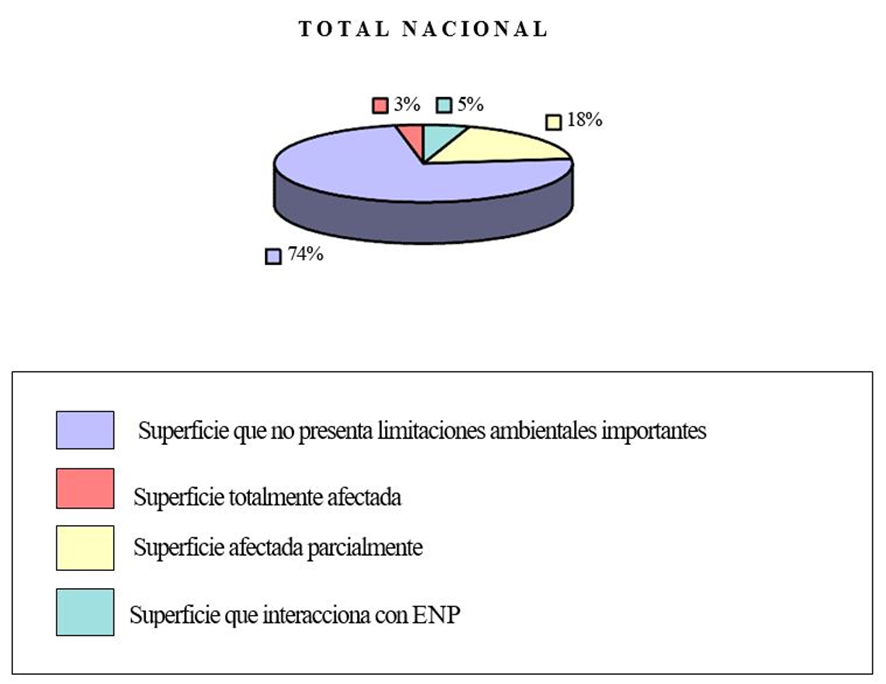
The value of the damage was calculated by weighting the different indicators analyzed, defining four types of affected surfaces:
- Unaffected surface
- Totally affected surface
- Partially affected surface
- Surface that interacts with Protected Natural Spaces (ENP)
As can be seen in the graph, the surface area that interacts with the protected natural spaces at the time of the study represented 5%, however, the processes of environmental protection have continued to act and at present the interactions of new areas studied with the delimitation of environmental protection zones have increased their percentage.
Out of a total of 1,036,088 ha of geographical surface analyzed, 111,125 ha, 10.7% are surfaces with some declaration of environmental protection of Protected Natural Space (ENP), Site of Community Interest (LIC), Special Protection Area for Birds (ZEPA), Overexploited Hydrogeological Unit (UHS), Zone Vulnerable to Pollution with Nitrates of Granial Origin (ZVN).
The distribution of surfaces is as follows:
| Protective figures | Interaction surface (ha) |
|---|---|
| ZVN | 34.685 |
| UHS | 7.284 |
| SPA | 1.643 |
| LIC | 23.620 |
| LIC and ZEPA | 41.191 |
| LIC and UHS | 42 |
| IN P | 31 |
| ENP and LIC | 192 |
| ENP, LIC and ZEPA | 440 |
4.8.6 Integration into the procedure according to EIA regulations.
Based on the problems studied in the operating irrigated areas, the necessary criteria have been determined to facilitate the integration of the programmed actions into the procedure provided for in the EIA regulations according to the following aspects:
- Key environmental aspects to consider
- Most significant impacts
- Development of minimizing measures
- Environmental Surveillance Criteria
- Guidance on the Authorities to consider in the prior consultation phase.
4.8.7 Proposal of corrective measures to be applied
A series of precautionary and corrective measures have been proposed to minimize the impact on the resources represented by the variables studied. A list of the most significant measures, according to the resource analyzed, is presented below:
- Atmosphere: avoid the volatilization of pollutants, avoid burning stubble and waste
- Water: conservation of wetlands, correct application of fertilizers, optimization of irrigation doses and improvement of irrigation application systems, conservation and improvement of elements within the general irrigation network
- Soil: conservation tillage, combating wind and water erosion, conservation and improvement of drainage systems
- Vegetation: conservation of native species varieties (biodiversity at the species and genetic level), conservation of natural vegetation between crops, conservation and restoration of riparian vegetation
- Fauna: preservation of habitats associated with protected species, adaptation of tillage and harvesting tasks for the protection of fauna, preservation of biodiversity of species and genetics
- Landscape: maintenance of unique landscape elements, improvement of the agricultural landscape and prevention of alterations in its texture.
4.8.8 Conclusions
The considerations arising from the environmental analysis of the different areas included in the PNR are summarized below for existing irrigation systems, those under construction, and the new areas studied.
4.8.8.1 Existing Irrigation Systems
The effects that historical or older irrigation systems may have caused have not, in some cases, been assimilated by a natural environment permanently modified by irrigation, unless corrective measures can be adopted; and in other cases, it has been found that irrigation has shaped agricultural ecosystems that hold a series of values in terms of semi-natural habitats, biodiversity of flora and fauna and landscape, which are already part of an aesthetic, cultural and social heritage worthy of being preserved in many of our rural areas.
4.8.8.2 Irrigation projects under construction
Since the transformation to irrigated land is subject to the environmental impact assessment procedure, the negative effects that may occur in the pending transformations in these areas will be identified and qualified in the corresponding studies, which in each project will propose the necessary corrective measures to minimize the negative impacts.
The potential impacts on the sectors awaiting implementation have not yet materialized, as they are still in the project phase. However, according to the study conducted, potential impacts have been identified which the required Environmental Impact Assessments, not yet drafted, will undoubtedly clarify and provide appropriate responses to reduce these impacts to permissible limits.
4.8.8.3 New areas studied
New development projects in the studied areas will be subject to an Environmental Impact Assessment (EIA), and their conversion to irrigation will require a prior individualized EIA study, which will establish the corresponding corrective measures. However, the following conclusions can be drawn from the current study:
- The risk of erosion from agricultural practices is not significant except in areas included in the Southern Basin, where appropriate precautions should be taken.
- Of the areas studied, around 50% of the surface will be located on permeable aquifers, with the consequent risk of contamination by fertilizers and pesticides.
- Vegetation of interest may be affected in 25% of the surface, while fauna of interest, mainly steppe fauna, is present in more than 40% of the surface.
The interaction of the new areas studied with the delimitation of areas of special environmental protection exceeds 10%, highlighting that most of this interaction occurs in the Ebro Basin.
4.9 Demand and consumption of water for irrigation
4.9.1 Introduction
The study of irrigation water demand aims to identify, compare, and analyze the differences between demand, supply, and consumption of irrigation water in each unit of area, in order to evaluate the feasibility of the actions planned for 2008 with the demands defined in the River Basin Management Plans that guarantee supply. The calculation is performed for both existing irrigation systems and the other areas studied. The calculations were carried out using average meteorological data for the periods and seasons available in the original database of the MAPA (Ministry of Agriculture, Fisheries and Food) agroclimatic studies. The result is a database that will be the basic tool for the analysis itself and for monitoring and developing the actions of the National Irrigation Plan (PNR). The main aspects analyzed are:
Existing irrigation systems.
- Calculation of current and future demands needed to meet crop needs.
- Current state of irrigation in relation to supply.
- Definition of current supply.
- Calculation of irrigation returns.
- Estimated consumption.
- Calculation of the additional resources needed in under-irrigated areas.
- Determination of water savings resulting from action programs.
Irrigation projects under construction and new transformations in irrigation.
- Estimation of demands and consumption.
- Variation in demand between the current situation and the future situation.
4.9.2 Methodology
The calculations for the demand study are established by taking as a territorial unit the irrigation area, defined in the existing irrigation characterization and typification studies as the territorial area resulting from subdividing the hydraulic management units, within which the irrigation systems have a degree of uniformity and a sufficiently homogeneous origin of water for their grouped characterization.
To calculate the theoretical water requirements of the crops (theoretical net demand), the meteorological stations of the National Institute of Meteorology necessary for calculating potential evapotranspiration using the Penman-Monteith method were selected and assigned to each of the irrigated areas. Once the potential evapotranspiration was calculated, the net water requirements for the area were obtained by applying the corresponding crop coefficients and according to the area occupied by each crop in the alternative corresponding to the area.
The theoretical gross demand in the current situation is equivalent to the ratio between the theoretical net water needs in the area and the overall irrigation efficiency coefficient. This overall efficiency coefficient is the product of the application efficiency coefficient, which is consistent with the currently used irrigation system, and the conveyance and distribution efficiency coefficients, which are directly related to the condition of the hydraulic infrastructure. This information is provided by studies characterizing and classifying existing irrigation systems and corroborated with data from the PHC (Plan de Hábrigo).
The methodological process consists of the following phases:
- Assignment of weather stations to each of the areas.
- Calculation of potential evapotranspiration. The reference potential evapotranspiration was determined using the Penman-Monteith method. Crop coefficients were taken from various studies conducted by universities, CEDEX, and the Autonomous Communities.
- Crop alternatives. To calculate current demand, crop alternatives in each irrigation area were considered, based on studies characterizing and classifying existing irrigation systems. For calculating future demand, given the limited possibilities for modifying crop alternatives under the same agroclimatic conditions (as the impact of such changes on water consumption is negligible), existing irrigation systems maintain the same alternatives. New irrigation systems consider the crops currently under irrigation in the areas where these systems are located.
- Current efficiencies. The estimation of current efficiencies has been carried out based on the irrigation systems (application efficiency) and the state of the hydraulic infrastructures determined by the PNR based on the material and the state of conservation of these infrastructures.
- Future efficiencies. Future efficiencies are estimated for a situation after the implementation of the planned action program for existing irrigation systems. The action program for existing irrigation systems faces the dual challenge of establishing a conservation status for all irrigation systems, which varies over time, and determining the specific area to be addressed by each action when the decision may have multiple origins (the National Irrigation Plan itself, farmers, and public administrations). Therefore, the following method has been used:
- Application efficiency is related to and quantified by the suitability of changes in irrigation systems estimated in characterization studies.
- Distribution and conveyance efficiencies are established based on the water savings determined in the action plan established in the characterization studies.
- Future demand. It is obtained for each area by the ratio between the water needs of the crops that make up the corresponding alternatives and the overall efficiency (application, distribution and conveyance) estimated for the situation resulting from the application of the PNR programs.
- Returns generated, which are estimated according to the methodology used by MIMAM.
- Current allocation index. To calculate the water allocation index for the existing irrigated area in each of the areas and under the current situation, the theoretical gross demand for each area is compared with the gross supply. For the classification of the irrigated area according to the allocation index, four main groups have been established in relation to the calculated theoretical gross demand and the gross supplies.
- Overstocked surface: when the gross supply exceeds the gross demand calculated by the PNR by 10%.
- Provided area: when the gross supply is included in the interval between 90% and 110% of the calculated gross demands.
- Slightly under-endowed surface: when this ratio is between 75% and 90%.
- Underfunded areas: when the gross supply is less than 75% of the gross demand calculated by the PNR.
- Gross water savings, which can be achieved with the irrigation consolidation and improvement program. This consists of the sum of the reductions in water losses during distribution and application in irrigated or over-irrigated areas, which leads to a decrease in water needs at the head of the area, and the reductions in water losses during distribution and application in under-irrigated areas, which leads to a decrease in the additional resources required.
- Additional resources. The additional resources expressed in the characterization and classification work of the PNR irrigation systems and contemplated in the action programs will be treated from the point of view of supply without indicating their origin, since this corresponds to the Hydrological Planning.
4.9.2.1 Methodological scheme
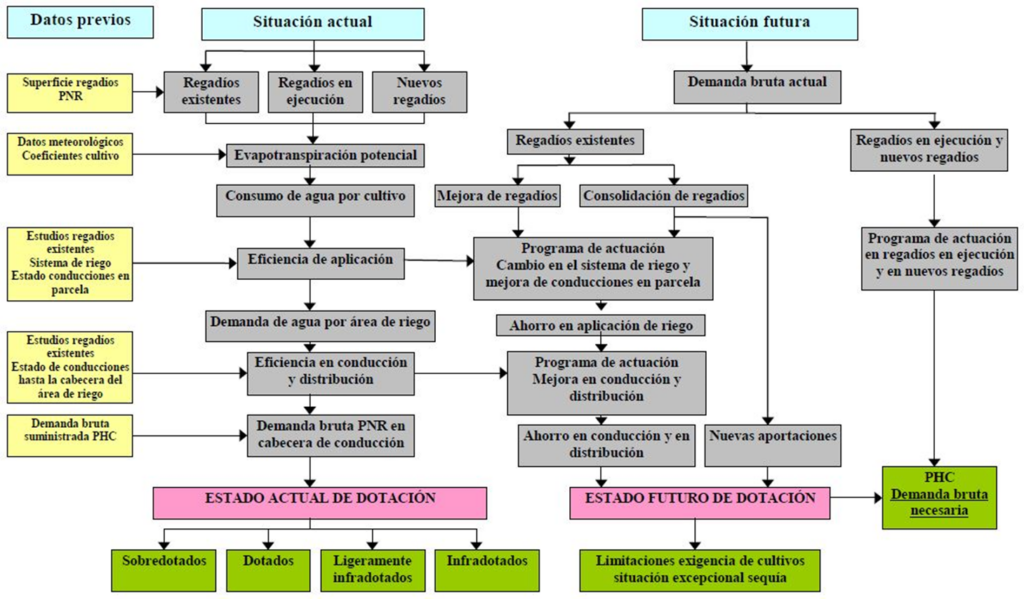
4.9.3 Demand in the current situation
4.9.3.1 Gross demand at the head of the area
The gross crop water demand is equal to the ratio between the net crop water requirements and the irrigation efficiency coefficient. The latter is consistent with the irrigation system currently in use.
To calculate the gross demand at the head of the conveyance or head of the irrigation area, we must divide the gross demand of the alternative by the efficiency coefficient of the distribution networks in the current situation, which is directly related to the state of the hydraulic infrastructures, information provided by the characterization and typification studies of the existing irrigation systems and compared with those of the PHC.
4.9.3.2 Gross demand by area, exploitation system and river basin
Once the gross demand at the headwaters of each area (811 areas nationwide) has been calculated, it is integrated into the water management systems, and these systems are then integrated into their respective river basins. The average gross water allocations at the headwaters of each area are detailed below for each river basin.
THEORETICAL NET AND GROSS WATER DEMAND (hm)3) CURRENT SITUATION BY AUTONOMOUS COMMUNITY
| Autonomous Community | Theoretical net demand (m3/ha) | Theoretical gross demand (m3/ha) | Irrigated area (ha) | Theoretical gross demand (hm)3) |
|---|---|---|---|---|
| Andalusia | 4.151 | 7.128 | 779.880 | 5.559 |
| Aragon | 4.580 | 8.741 | 394.522 | 3.448 |
| Asturias | 1.749 | 3.668 | 4.342 | 16 |
| Balearics | 3.534 | 4.804 | 17.376 | 83 |
| Canary Islands | 6.261 | 8.030 | 29.379 | 236 |
| Cantabria | 3.305 | 5.574 | 2.603 | 15 |
| Castilla la Mancha | 3.587 | 5.908 | 353.801 | 2.090 |
| Castile and León | 4.083 | 7.302 | 486.676 | 3.554 |
| Catalonia | 3.537 | 6.201 | 264.793 | 1.642 |
| Estremadura | 5.118 | 9.602 | 210.488 | 2.021 |
| Galicia | 2.078 | 4.096 | 85.490 | 350 |
| Madrid | 4.806 | 9.333 | 27.973 | 261 |
| Murcia | 3.843 | 5.749 | 192.698 | 1.108 |
| Navarre | 3.804 | 7.353 | 81.673 | 601 |
| the Basque Country | 2.873 | 3.940 | 13.126 | 52 |
| Rioja | 2.978 | 5.818 | 49.335 | 287 |
| Valencian | 3.514 | 6.361 | 350.482 | 2.229 |
| Total | 4.116 | 7.042 | 3.344.637 | 23.552 |
THEORETICAL NET AND GROSS WATER DEMAND (hm)3) CURRENT SITUATION BY HYDROGRAPHIC BASIN
| Basin | Theoretical net demand (m3/ha) | Theoretical gross demand (m3/ha) | Irrigated area (ha) | Theoretical gross demand (hm)3) |
|---|---|---|---|---|
| Galicia Coast | 1.670 | 2.946 | 26.371 | 78 |
| North | 2.401 | 4.618 | 74.032 | 342 |
| Douro | 4.135 | 7.354 | 447.576 | 3.292 |
| Block | 4.905 | 9.131 | 201.336 | 1.838 |
| Guadiana | 4.046 | 6.512 | 335.590 | 2.185 |
| Guadalquivir | 4.392 | 7.160 | 602.966 | 4.317 |
| South | 4.623 | 7.397 | 142.457 | 1.054 |
| Safe | 3.855 | 5.876 | 276.316 | 1.624 |
| Júcar | 3.743 | 6.373 | 384.802 | 2.452 |
| Ebro | 4.192 | 7.793 | 738.662 | 5.756 |
| Catalonia CI | 2.835 | 4.352 | 67.774 | 295 |
| Balearics | 3.599 | 4.804 | 17.376 | 83 |
| Canary Islands | 6.261 | 8.030 | 29.379 | 236 |
| Total | 4.116 | 7.042 | 3.344.637 | 23.552 |
4.9.4 Future demand
Future water demands for irrigation have been generally established in the recently approved River Basin Management Plans. Considering these projections, and with the specific aim of evaluating the results of the measures foreseen in this National Irrigation Plan, which have different time horizons and objectives, the future water demand of existing irrigated areas has been assessed, taking into account the actions foreseen by this Plan and which must be guaranteed by the River Basin Management Plans.
This calculation is included in section 10.1.2, adjusting the current total demand according to the irrigation consolidation and improvement action plans. This will result in, on the one hand, a decrease in demand (savings due to improved irrigation efficiency in application systems and hydraulic infrastructure within the area) and, on the other hand, an increase in demand due to the additional resources needed for the rehabilitation and consolidation of under-supplied irrigation systems. The calculations for water savings and additional resources resulting from these actions are included in section 10.1.
Once the program of actions for existing irrigation systems has been defined, and the area of irrigation systems to be consolidated and improved in section 9.1, the future demand of these irrigation systems is calculated (section 10.1) where we correct the current total demand according to the actions for consolidation and improvement of the irrigation systems defined.
Likewise, once the new areas to be transformed into irrigated land (irrigation projects under construction and new transformations) have been established, sections 9.2 and 9.3, the future demand assigned by these programs is calculated in section 10.1.
4.9.5 Current consumption of irrigation water
Current water consumption in an irrigated area comprises the water supplied at the head of the area (gross supply) minus the return flows generated by irrigation. An irrigated area is defined as the territorial area resulting from subdividing the hydraulic management units of river basins, within which the irrigated lands exhibit a degree of uniformity and a sufficiently homogeneous water source for grouped characterization. The National Irrigation Plan (PNR) subdivides the national territory into a total of 811 irrigated areas.
The water supplied at the head of the area has been estimated from the data collected in the field surveys, carried out on the irrigation communities and individual irrigators and from the analysis of the agricultural demands included in the River Basin Management Plans, since its exact knowledge would require having control and measurement elements, which do not currently exist at the supply points.
Dividing the water supplied at the head of each area by the irrigated area gives us the current supply per unit area (ha). Irrigation water returns in each area have been estimated according to the standard set forth in the Ministerial Order of September 27, 1992, from the Ministry of Public Works and Transport. Adding the above data gives us the average water demand by Autonomous Community and the national total, and subtracting the returns gives us the annual water consumption for irrigation.
The current total consumption of irrigation water amounts to 20,432 hm3, which by Autonomous Community and River Basin is as follows:
GROSS SUPPLY AND CONSUMPTION OF WATER (hm3) IN EXISTING IRRIGATED AREAS BY AUTONOMOUS COMMUNITY
| Autonomous Community | Gross supply (m3/ha) | Irrigated area (ha) | Gross supply (hm3) | Irrigation water returns (hm3) | Water consumption (hm3) |
|---|---|---|---|---|---|
| Andalusia | 6.443 | 779.880 | 5.025 | 600 | 4.425 |
| Aragon | 8.174 | 394.522 | 3.225 | 555 | 2.670 |
| Asturias | 5.758 | 4.342 | 25 | 1 | 24 |
| Balearics | 7.827 | 17.376 | 136 | 25 | 111 |
| Canary Islands | 7.148 | 29.379 | 210 | 27 | 183 |
| Cantabria | 5.763 | 2.603 | 15 | 2 | 13 |
| Castilla la Mancha | 6.408 | 353.801 | 2.267 | 171 | 2.096 |
| Castile and León | 6.888 | 486.676 | 3.352 | 355 | 2.997 |
| Catalonia | 8.380 | 264.793 | 2.219 | 347 | 1.872 |
| Estremadura | 8.052 | 210.488 | 1.695 | 275 | 1.420 |
| Galicia | 7.241 | 85.490 | 619 | 81 | 538 |
| Madrid | 9.580 | 27.973 | 268 | 40 | 228 |
| Murcia | 6.388 | 192.698 | 1.231 | 127 | 1.104 |
| Navarre | 6.293 | 81.673 | 514 | 59 | 455 |
| the Basque Country | 3.047 | 13.126 | 40 | 0 | 40 |
| Rioja | 6.932 | 49.335 | 342 | 41 | 301 |
| Valencian | 6.035 | 350.482 | 2.115 | 160 | 1.955 |
| Total | 6.965 | 3.344.637 | 23.298 | 2.866 | 20.432 |
GROSS SUPPLY AND CONSUMPTION OF WATER (hm3) IN EXISTING IRRIGATED AREAS BY HYDROGRAPHIC BASIN
| Basin | Gross supply (m3/ha) | Irrigated area (ha) | Gross supply (hm3) | Irrigation water returns (hm3) | Water consumption (hm3) |
|---|---|---|---|---|---|
| Galicia Coast | 8.337 | 26.371 | 220 | 44 | 176 |
| North | 7.734 | 74.032 | 573 | 63 | 510 |
| Douro | 6.801 | 447.576 | 3.044 | 322 | 2.722 |
| Block | 8.262 | 201.336 | 1.663 | 230 | 1.433 |
| Guadiana | 6.657 | 335.590 | 2.234 | 236 | 1.998 |
| Guadalquivir | 6.635 | 602.966 | 4.000 | 505 | 3.495 |
| South | 5.620 | 142.457 | 801 | 75 | 725 |
| Safe | 6.240 | 276.316 | 1.724 | 157 | 1.567 |
| Júcar | 6.122 | 384.802 | 2.356 | 184 | 2.172 |
| Ebro | 8.033 | 738.662 | 5.934 | 962 | 4.971 |
| Catalonia CI | 5.962 | 67.774 | 404 | 36 | 368 |
| Balearics | 7.804 | 17.376 | 136 | 25 | 111 |
| Canary Islands | 7.147 | 29.379 | 210 | 27 | 183 |
| Total | 6.965 | 3.344.637 | 23.298 | 2.866 | 20.432 |
4.9.6 Endowment Index
To calculate the allocation index for the existing irrigated area, the gross demand required by the crops was compared with two supply references:
- The one provided by the PNR characterization work.
- The assigned amount, corrected in certain points by the supply guarantees.
The determination of the theoretical gross demand has been carried out considering the current efficiency coefficients of water application on the plot and distribution in the pipelines.
For the classification of irrigated land according to the allocation index, four main groups have been established in relation to the theoretical gross demand calculated by the PNR and the expressed supply:
- Overloaded surface: when the gross supply exceeds the gross demand at the headwaters calculated by the PNR by 10%.
- Area provided: when the gross supply is included in the interval between 90% and 110% of the gross demands at the head.
- Slightly under-endowed surface: when this ratio is between 75% and 90%.
- Underfunded areas: when the gross supply is less than 75%.
By integrating the areas by Autonomous Community calculated according to the endowment index, the total national area is obtained classified according to the degree of endowment.
YesORPANDIRRIGATED AREA (ha) ACCORDING TO ALLOCATION INDEX BY HYDROGRAPHIC BASIN
| Watershed | gifted | Gifted | Slightly underfunded | under-endowed | Total Irrigated Area |
|---|---|---|---|---|---|
| Galicia coast | 26.371 | 0 | 0 | 0 | 26.371 |
| North | 49.943 | 15.474 | 8.615 | 0 | 74.032 |
| Douro | 131.017 | 91.599 | 82.582 | 142.379 | 447.577 |
| Block | 26.137 | 22.691 | 73.128 | 79.380 | 201.336 |
| Guadiana | 163.533 | 27.935 | 113.698 | 30.424 | 335.590 |
| Guadalquivir | 95.431 | 42.051 | 114.520 | 350.963 | 602.965 |
| South | 21.643 | 12.174 | 18.814 | 89.827 | 142.458 |
| Safe | 22.823 | 149.353 | 29.284 | 74.856 | 276.316 |
| Júcar | 41.176 | 128.843 | 105.991 | 108.790 | 384.800 |
| Ebro | 247.060 | 123.118 | 126.828 | 241.657 | 738.663 |
| Catalonia CI | 34.196 | 21.861 | 11.717 | 0 | 67.774 |
| Balearics | 15.097 | 2.279 | 0 | 0 | 17.376 |
| Canary Islands | 3.947 | 5.242 | 9.146 | 11.044 | 29.379 |
| Total | 878.374 | 642.620 | 694.323 | 1.129.320 | 3.344.637 |
IRRIGATED AREA (ha) ACCORDING TO THE ALLOCATION INDEX BY AUTONOMOUS COMMUNITY
| Autonomous Community | gifted | Gifted | Slightly underfunded | under-endowed | Total irrigated area |
|---|---|---|---|---|---|
| Andalusia | 130.355 | 68.904 | 137.846 | 442.775 | 779.880 |
| Aragon | 82.942 | 84.379 | 81.217 | 145.985 | 394.522 |
| Asturias | 3.097 | 14 | 1.232 | 0 | 4.342 |
| Balearics | 15.097 | 2.279 | 0 | 0 | 17.376 |
| Canary Islands | 3.947 | 5.242 | 9.146 | 11.045 | 29.379 |
| Cantabria | 1.349 | 50 | 0 | 1.204 | 2.603 |
| Castilla la Mancha | 160.650 | 22.852 | 106.154 | 64.145 | 353.801 |
| Castile and León | 140.341 | 95.096 | 88.152 | 163.088 | 486.676 |
| Catalonia | 167.709 | 38.712 | 15.502 | 42.870 | 264.793 |
| Estremadura | 5.656 | 19.732 | 143.178 | 41.921 | 210.488 |
| Galicia | 66.164 | 11.942 | 7.383 | 0 | 85.490 |
| Madrid | 10.049 | 147 | 4.211 | 13.566 | 27.973 |
| Murcia | 22.823 | 87.877 | 24.680 | 57.318 | 192.698 |
| Navarre | 8.315 | 12.771 | 24.344 | 36.242 | 81.673 |
| the Basque Country | 1.720 | 2.665 | 0 | 8.741 | 13.126 |
| Rioja | 23.262 | 9.934 | 14.191 | 1.948 | 49.335 |
| Valencian | 34.897 | 180.023 | 37.088 | 98.473 | 350.482 |
| Total | 878.374 | 642.620 | 694.323 | 1.129.320 | 3.344.637 |
4.9.7 Excess water supplied and additional resources required
In the previous section, the water allocation indices for the different irrigation areas were obtained by comparing the theoretical gross demand for each of them, according to the efficiency coefficients in the current situation, with the gross supply.
This classification arises from the existence of irrigated areas that receive a supply exceeding current gross demand, resulting in a surplus of water, or over-allocation, while other areas receive less water than currently required, leading to a shortage and therefore a need for additional resources. These additional resources include those needed to address the overexploitation of aquifers.
In the current situation, the additional resources needed to consolidate all under-irrigated land have been calculated. These additional resources, including those needed to correct the overexploitation of underground aquifers, amount to 4,287 hm³.3/year.
The excess water supplied to the over-allocated irrigation systems amounts to 3,366 hm³3/year. Part of this excess water is lost through evaporation, and the rest returns to the natural water cycle and can be reused for:
- Existing irrigation systems.
- New irrigation systems.
- Aquifer recharge.
- Other uses.
This excess water of 3,366 hm3/year currently represents an increase in the calculated returns of irrigation water of 887 hm3.
These data (additional resources, excess water, returns) refer to the volumes of water received by the irrigation areas (irrigated areas of demarcation equal to or greater than an irrigable zone) and therefore cannot be added together for the purposes of water balances by river basin.
For this reason, aggregated data by river basin is not provided, as such aggregation would lack physical meaning and lead to confusion. Determining the additional resources required by each basin necessitates the construction of hydraulic system models that go beyond the simple arithmetic sum of the zones and that reproduce in detail the system's flows, demands, supplies, return flows, and storage. This allows for the evaluation, at the basin scale, of the overall effects of specific actions on particular demands. This work has been carried out within the framework of the River Basin Management Plans and the National Hydrological Plan, and falls outside the scope of this National Irrigation Plan.
ADDITIONAL RESOURCES NEEDED TO MEET DEMANDS IN UNDER-IRRIGATION AREAS (hm3)
| Autonomous Community | Additional Resources Needed |
|---|---|
| Andalusia | 1.458 |
| Andalusia | 1.458 |
| Aragon | 515 |
| Asturias | 2 |
| Balearics | 14 |
| Canary Islands | 77 |
| Cantabria | 4 |
| Castilla la Mancha | 394 |
| Castile and León | 572 |
| Catalonia | 82 |
| Estremadura | 360 |
| Galicia | 6 |
| Madrid | 41 |
| Murcia | 226 |
| Navarre | 126 |
| the Basque Country | 16 |
| Rioja | 24 |
| Valencian | 370 |
| Total | 4.287 |
4.9.8 Future consumption of irrigation water
The calculation of future water consumption in irrigation is included in the section "The PNR and the river basin hydrological plans".
4.10 Irrigation and energy planning
The various sectoral plans at the national level, carried out by the Public Administrations, must be considered in the National Renewal Plan (NRP). However, the forecasts of the previous National Energy Plan (NEP) for the period of validity (1990-2000) do not include a specific section on irrigation. Therefore, it seems advisable to place them within the context, taking into account the parameters that may be of greatest planning interest:
- Irrigation and energy consumption.
- Irrigation consumption within the framework of energy planning.
- Irrigation consumption by activity: Irrigation and tillage.
- Energy consumption by type: Electricity and diesel.
- Spatial distribution of energy consumption.
- Irrigation and energy production.
- Lost energy (height of the most significant reservoirs).
- Shared use reservoir.
For this, the following aspects have been studied:
- Inventory of electricity consumption for irrigation, based on data provided by electricity companies to local councils, which includes the subscribers entitled to irrigation tariffs. This inventory comprises:
- Number of subscribers
- Contracted powers
- Consumption
- This study examines diesel consumption in irrigated farms, differentiating between consumption during irrigation activities (pressurization of irrigation systems and groundwater extraction) and consumption during other agricultural tasks and activities. Data from the Ministry of Industry and Energy (MINER) and existing studies characterizing and classifying irrigation systems are used.
- Analysis of the increase in energy consumption produced by the application of the different programs of actions for the consolidation and improvement of existing irrigation systems (changes in irrigation systems) and those planned in irrigation systems under construction and new irrigation systems.
- Calculation of electricity production in irrigation infrastructures.
- Inventory of shared-use reservoirs, indicating which of them are attributed to irrigation.
The structure of net electricity production is summarized in the following table:
STRUCTUREA OF NET PRODUCTION
| TYPE OF PRODUCTIVE SOURCE | 1990 | 2000 | ||
|---|---|---|---|---|
| GW⋅h | % | GW⋅h | % | |
| Hydraulics | 24.673 | 17,5 | 32.781 | 16,4 |
| Nuclear | 51.664 | 36,7 | 46.383 | 23,2 |
| National coal | 48.960 | 34,8 | 57.608 | 28,9 |
| Imported coal | 6.507 | 4,6 | 11.501 | 5,8 |
| Fuel | 2.034 | 1,5 | 0 | 0,0 |
| Gas | 619 | 0,4 | 22.612 | 11,3 |
| Foreign Import | 0 | 0,0 | 8.760 | 4,4 |
| Self-production | 6.267 | 4,5 | 19.964 | 10,0 |
| Total | 140.724 | 100,0 | 199.609 | 100,0 |
In the Balearic Islands, Ceuta, and Melilla, all electricity is generated from thermal sources. In the Canary Islands, of the 1,736 MW⋅h projected for the year 2000, only 0.8 MW⋅h are hydroelectric.
4.10.1 Primary energy demand in agriculture
The primary energy demand for agriculture and fishing as a whole has been calculated, distinguishing between that corresponding to irrigation. Within irrigation, a distinction has been made between the energy consumption related to the irrigation activity itself—the energy required for water collection and to provide the necessary pressure to the various irrigation application systems—and the energy consumption of the agricultural work itself on the irrigated land.
4.10.1.1 Distribution by Autonomous Communities
The 2,867 GW⋅h consumed by irrigation during 1995 represent 1.8% of the national consumption (158,841 GW⋅h in 1995).
The distribution of energy demands by Autonomous Community shows a significant consumption of electricity for irrigation in four Autonomous Communities: Castilla La Mancha, Castilla Valenciana, Andalucía and Murcia, well exceeding 500,000 MW ⋅h. Andalucía, followed at a distance by Castilla y León, appear as the main consumers of diesel for irrigation.
CONSUMPTIONOR ENERGY IN IRRIGATION, AGRICULTURE AND FISHERIES BY REGION
| Autonomous Community | Irrigated land | Agriculture and fishing | |||||
|---|---|---|---|---|---|---|---|
| Pumps | Work | Total | Consumption | Consumption | Consumption | ||
| Electricity (MWh) | Diesel (t) | Diesel (t) | Diesel (t) | Energy (Ktop) | Diesel (t) | Energy (Ktop) | |
| Andalusia | 530.863 | 48.047 | 108.505 | 156.552 | 270 | 467.191 | 581 |
| Aragon | 103.254 | 7.058 | 55.568 | 62.626 | 85 | 177.389 | 199 |
| Asturias | 0 | 104 | 377 | 481 | 0 | 52.492 | 52 |
| Balearics | 21.961 | 1.901 | 2.360 | 4.281 | 9 | 36.800 | 41 |
| Canary Islands | 139.294 | 9.419 | 4.061 | 13.480 | 43 | 49.210 | 79 |
| Cantabria | 39 | 99 | 356 | 455 | 0 | 36.842 | 37 |
| Castilla la Mancha | 595.817 | 22.044 | 49.047 | 71.091 | 198 | 301.970 | 429 |
| Castile and León | 190.330 | 27.627 | 67.866 | 95.493 | 136 | 436.927 | 476 |
| Catalonia | 46.221 | 14.334 | 36.663 | 50.998 | 61 | 286.221 | 296 |
| Estremadura | 58.686 | 13.813 | 29.309 | 43.122 | 56 | 95.567 | 108 |
| Galicia | 525 | 3.260 | 11.793 | 15.054 | 15 | 413.306 | 413 |
| Madrid | 10.111 | 1.710 | 3.804 | 5.514 | 8 | 81.953 | 84 |
| Murcia | 543.662 | 15.226 | 27.238 | 42.484 | 159 | 85.507 | 202 |
| Navarre | 26.281 | 1.450 | 11.416 | 12.866 | 18 | 44.053 | 50 |
| the Basque Country | 2.963 | 519 | 1.878 | 2.398 | 3 | 137.211 | 138 |
| Rioja | 7.353 | 864 | 6.803 | 7.667 | 9 | 32.557 | 34 |
| Valencian | 589.868 | 14.903 | 48.556 | 63.459 | 190 | 214.691 | 341 |
| Total | 2.867.228 | 182.399 | 465.601 | 648.000 | 1.261 | 2.949.884 | 3.563 |
4.10.1.2 Primary energy demand in agriculture
For the calculation of energy in Spanish agriculture, the figures corresponding to the year 1995 have been taken, which are broken down by activity, including irrigation, as follows:
DEMANDA OF PRIMARY ENERGY IN AGRICULTURE IN 1995
| | Ktep Agricultural Diesel | Electrical energy for irrigation (Ktep) | Total Energy Ktep | % about Spain |
|---|---|---|---|---|
| Dry land | 1.349 | 0 | 1.349 | 1,.33 |
| Irrigation Pumping | 224 | 613 | 837 | 0,83 |
| Irrigation Work | 424 | 424 | 0,41 | |
| Fishing | 853 | 0 | 853 | 0,83 |
| Others | 100 | 0 | 100 | 0,10 |
| Total | 2.950 | 613 | 3.563 | 3,5 |
4.10.1.3 Primary energy consumption for irrigation
The following conclusions can be drawn from the analysis of the table above:
- The primary energy demand in Agriculture and Fishing with 3,563 Ktops represents 3.5% of the national total (101,833 Ktops).
- Irrigation consumes 1,261 Ktops of which 648 Ktops correspond to diesel and 613 Ktops to electrical energy consumed in irrigation pumping (groundwater station, irrigation pressurization).
- Diesel fuel represents slightly more than 25% of the total primary energy consumed in irrigation pumping.
- Electricity consumption for irrigation is 2,867 GW⋅h., representing 1.8% of national consumption (158,841 GW⋅h in 1995).
4.10.2 Hydroelectric power production
Reservoirs built within the country vary according to their intended use, which generally does not correspond to a single activity, but rather involves a combination of uses including energy production, irrigation, urban water supply, industrial use, and recreational activities. However, they are usually assigned a primary use.
The installed power for the total of the reservoirs amounts to a total of 16,429,273 kW distributed in the following main uses:
POWERYoINSTALLED BY RESERVOIR ACCORDING TO THE PRIMARY ATTRIBUTED USE
| PRIMARY ATTRIBUTED USE | kW |
|---|---|
| Catering | 1.258.970 |
| Supply-Recreation | 4.320 |
| Supply-Energy | 70.519 |
| Derivation | 2.700 |
| Energy | 12.290.820 |
| Risks | 575.102 |
| Irrigation-Supply | 403.907 |
| Irrigation-Supply-Energy | 201.074 |
| Risks-Defense | 40.720 |
| Irrigation-Energy | 1.525.312 |
| Irrigation-Fishing-Energy | 240 |
| Industrial Uses | 55.590 |
| TOTTOl | 16.429.273 |
National annual hydroelectric production, as expected, depends largely on rainfall and its distribution throughout the year. The National Energy Plan estimated production of 24,673 GWh for 1990 and 32,781 GWh for 2000, a figure that represents approximately 17.1% of total electricity production.
4.10.3 Influence on the PEN of the PNR action programs
The various action programs of the National Irrigation Program (PNR) have a diverse influence on the production and consumption of electricity. On the one hand, the program for consolidating and improving existing irrigation systems leads to increased consumption due to the change in water application methods, with a larger area irrigated using artificial pressure. On the other hand, ongoing irrigation programs and new irrigation projects not only generate higher consumption but can also affect energy production due to the consumptive use of water upstream from the hydroelectric power plant.
The analysis of the influence of the PNR on the production and consumption of electrical energy is carried out in section 10.2, once the action programs have been defined.
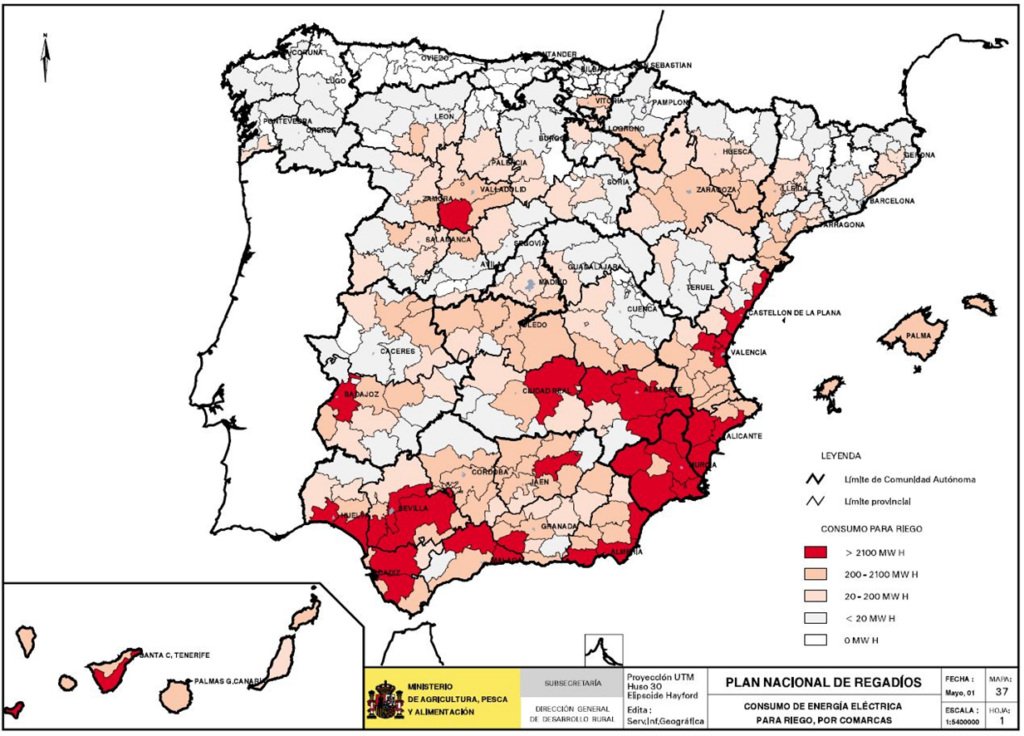
5 Performance Programs
5.1 Introduction
It has been pointed out that irrigation is an unavoidable necessity to overcome the difficult natural conditions in which agricultural activity takes place in many Spanish regions and districts.
Chapter 3 addressed the importance of irrigation in agriculture from a general perspective, focusing on its contribution to rural population settlement, the maintenance of an active socioeconomic fabric, land use, increased farm size, and the creation and maintenance of employment in the agricultural sector. It also analyzed the relationship between irrigated agriculture and the food industry, given that a significant portion of the latter is directly linked to irrigated products (canned vegetables, juices, sugar, animal feed, etc.). Furthermore, it examined how typical irrigated products, such as fruits and vegetables, decisively influence the positive balance of agricultural trade in the food sector. Finally, Chapter 3 concluded with a detailed analysis of market prospects for the immediate future of irrigation and environmental considerations to be taken into account when planning future actions.
Chapter 4 has classified and characterized the currently irrigated areas according to irrigation systems, water allocations, state of infrastructure, predominant crops, etc., has examined the irrigation projects that are being carried out with respect to their legal-administrative status, investments made, state of the works, etc. and has studied other areas susceptible to transformation.
All this systematic information leads to a diagnosis of the situation from social, economic, environmental, territorial, etc. perspectives.
In this chapter, as a logical consequence of the previous ones, the priorities for actions and the specific objectives to be achieved are established, considering the time horizon of 2008. Such actions are compatible with the approved River Basin Management Plans, thus materializing the general principles and guidelines on which the new orientations of the irrigation policy are based.
The proposed actions are grouped into three basic programs referring, respectively, to the improvement of existing irrigation systems, to the transformations that are already being carried out, to new transformations of a social nature, and to a support program that includes various measures of environmental monitoring, evaluation of irrigation systems, training and technology, etc.
For each of the three basic programs, the areas of intervention, the investments to be made, and their financing, duly allocated to specific territories, are established. It should be noted that the development of the National Irrigation Plan was conceived as an institutional collaboration between the Ministry of Agriculture, Fisheries and Food and the Autonomous Communities, and is the final result of a reasonable consensus reached. These programs are perfectly compatible with the National Hydrological Plan and are included in the River Basin Management Plans.
5.2 Priorities and action objectives for the 2008 horizon
1. The situation analysis and diagnosis of the irrigation systems currently in operation have made it possible to identify and quantify several types of problems that need to be corrected both to optimize the management of the water used, and to improve the economic results of the farms and the quality of life of the users.
The nearly 3.5 million hectares currently irrigated in Spain present, in relative terms, a landscape of deficiencies and obsolescence in water distribution infrastructure and irrigation systems. This situation is determined by the fact that a third of the irrigated area is served by earthen or masonry ditches in poor condition, resulting in significant water losses in the pipelines, and by the predominance of gravity irrigation, which still accounts for three-fifths of the total area, compared to a mere sixth where localized irrigation is used.
On the other hand, it has been detected that approximately one third of the irrigated surface has a gross water supply that does not reach 75% of its needs.
The combination of these two situations implies, in the short or long term, problems of irrigation sustainability in some areas, with the negative consequences of all kinds that this would entail.
Therefore, actions aimed at resolving these problems are considered a priority in two aspects: improving irrigation systems, from the headworks infrastructure to the application of water to the plots, by reducing losses and saving water through pipeline renewal and adapting irrigation systems to lower water consumption; and consolidating and improving existing systems whose allocations can be supplemented within the framework of the hydrological planning or those derived from this Irrigation Plan. The total area requiring improvement and consolidation measures is 2,269,781 hectares, 501% of which is intended to be addressed by 2008.
2. The new guidelines for irrigation policy do not consider it appropriate to undertake new transformations of large irrigable areas, among other reasons, because the prospects for production and markets allow in the medium term a margin for moderate growth of irrigation, which is advisable to apply preferably in the areas where transformation plans are being implemented.
Currently, there are 36 irrigated areas undergoing transformation. Their legal status, investment implementation, transformed and pending areas, etc., vary considerably, as already detailed in the corresponding chapter. The total area affected by these plans—some of which were designed several decades ago under very different circumstances—is 652,277 hectares. Of this, 150,960 hectares have already been transformed and are being irrigated, while the remaining 501,317 hectares, which have water reserves in the current hydrological planning, are either under development or pending transformation.
For financial reasons, environmental limitations, the possibility of the crops to be planted, budget availability, etc., it is neither possible nor desirable, within a limited time horizon, in principle, to the year 2008, to undertake the transformation into irrigated land of an area of just over half a million hectares, so the Ministry of Agriculture, Fisheries and Food and the affected Autonomous Communities have jointly assessed the situation and have established the implementation priorities in these areas, with selective criteria of optimization of the investments already made and of productive, social and environmental interest.
By 2008, the objective is to transform 138,365 hectares, the distribution of which by irrigated areas and Autonomous Communities is specified below.
3. The policy of not planning large-scale transformations in new irrigated areas cannot preclude the possibility of converting small areas in disadvantaged, declining, or depopulated rural zones into irrigated land. In general, these small-scale irrigation projects align with the multifunctional concept inherent in the European agricultural model and, therefore, serve not only a productive function but also the need to retain population, reduce income and living standards disparities between vulnerable and more developed rural areas, balance the land use, and create or sustain agricultural employment.
The social importance of these irrigation systems, insofar as they are crucial for the socio-economic progress of rural areas with the greatest development difficulties, suggests that they should be considered as a priority in the program of new transformations.
The total area that has been studied and cataloged as potentially irrigable and susceptible to transformation is 851,025 hectares, among which 86,426 hectares have been selected as the objective of transformation, proposed in the 2008 horizon.
The relationship and surface area of the zones in which these 86,426 hectares of priority action are specified has been established jointly by the MAPA and the Autonomous Communities, in accordance with the social interest, the productive options of each specific case and the need to realistically balance the legitimate aspirations to establish new irrigation systems that the various territorial spaces have.
***
5.3 Action programs in current irrigated areas
In the process of analyzing and diagnosing the situation, the problems present in the currently irrigated areas have been identified and quantified. Addressing these problems is considered a priority within sector planning in order to:
- Optimize the irrigation of available water, reducing its consumption in areas with over-supplied or sufficient supplies and decreasing demand or, where appropriate, providing additional resources in under-supplied irrigation areas.
- Promote the incorporation of new technologies in irrigation systems that, in addition to reducing production costs and strengthening competitiveness, favor more suitable working conditions in irrigated farms.
- Contribute to the recovery of overexploited aquifers or those at risk of overexploitation.
To achieve these objectives, the actions in the aforementioned irrigated areas are grouped into an improvement program for those that, in principle, do not have water supply problems and a consolidation program for those that are under-supplied, either due to insufficient allocations or excessive water losses in their infrastructure.
These two programs will normally result in similar actions (all consolidation implies improvement), but a certain distinction between them is advisable so that there is no apparent increase in the areas of action and because the effect on production levels may be different in each of them.
The table below details, by Autonomous Community, the areas where, according to the classification and characterization results, irrigation systems need improvement or consolidation. In the first phase, which extends to 2008, the plan is to address 1,134,891 hectares, representing 50.1% of the total area.
PPROGRAM FOR THE CONSOLIDATION AND IMPROVEMENT OF IRRIGATION AREAS OF ACTION (ha) BY PROGRAMS AND BY AUTONOMOUS COMMUNITY
| Autonomous Community | Surfaces | |||
|---|---|---|---|---|
| Consolidation | Improvement | Total Program | Total to H-2008 (50%) | |
| Andalusia | 442.775 | 134.691 | 577.466 | 288.733 |
| Aragon | 145.985 | 138.679 | 284.664 | 142.332 |
| Asturias | 0 | 413 | 413 | 207 |
| Balearics | 0 | 9.062 | 9.062 | 4.531 |
| Canary Islands | 11.045 | 11.500 | 22.545 | 11.273 |
| Cantabria | 1.204 | 1.348 | 2.552 | 1.276 |
| Castilla la Mancha | 64.145 | 119.705 | 183.850 | 91.925 |
| Castile and León | 163.088 | 221.916 | 385.004 | 192.502 |
| Catalonia | 42.870 | 112.890 | 155.760 | 77.880 |
| Estremadura | 41.921 | 85.928 | 127.849 | 63.925 |
| Galicia | 0 | 12.911 | 12.911 | 6.455 |
| Madrid | 13.566 | 13.534 | 27.100 | 13.550 |
| Murcia | 57.318 | 82.425 | 139.743 | 69.872 |
| Navarre | 36.242 | 28.767 | 65.009 | 32.504 |
| the Basque Country | 8.741 | 0 | 8.741 | 4.370 |
| Rioja | 1.948 | 34.126 | 36.074 | 18.037 |
| Valencian | 98.472 | 132.566 | 231.038 | 115.519 |
| Total | 1.129.320 | 1.140.461 | 2.269.781 | 1.134.891 |
The following types of actions will be developed to improve and consolidate irrigation systems:
- Repair of existing hydraulic structures.
- Modification of the transport and distribution system.
- Change of irrigation application system.
- Complementary actions.
- Improvement of the drainage network.
- Improvement of the road network.
- Improved water regulation and control capacity.
- Reorganization of agricultural property.
- Water consumption control (installation of meters).
- Improved water management.
- Addition of additional water.
The following table details, by Autonomous Community, the areas affected by the types of action that will be carried out:
IRRIGATION CONSOLIDATION AND IMPROVEMENT PROGRAM AREAS OF ACTION OF THE PNR (ha) BY TYPE OF ACTION AND AUTONOMOUS COMMUNITY
| Autonomous Community | Repair of hydraulic structures | Modification of the transport and distribution system | Change in the irrigation application system | Complementary actions |
|---|---|---|---|---|
| Andalusia | 129.606 | 213.599 | 105.840 | 482.150 |
| Aragon | 115.693 | 70.512 | 67.029 | 368.444 |
| Asturias | 464 | 0 | 0 | 1.406 |
| Balearics | 375 | 7.671 | 4.438 | 20.334 |
| Canary Islands | 4.350 | 10.050 | 8.670 | 9.415 |
| Cantabria | 0 | 0 | 0 | 3.501 |
| Castilla la Mancha | 25.375 | 29.727 | 97.272 | 189.627 |
| Castile and León | 155.568 | 127.123 | 115.972 | 832.591 |
| Catalonia | 69.610 | 41.810 | 67.670 | 260.360 |
| Estremadura | 13.173 | 57.310 | 11.201 | 107.147 |
| Galicia | 6.703 | 1.548 | 1.548 | 24.599 |
| Madrid | 13.842 | 0 | 3.989 | 21.223 |
| Murcia | 0 | 60.960 | 62.155 | 178.153 |
| Navarre | 20.617 | 29.295 | 15.602 | 85.996 |
| the Basque Country | 0 | 6.855 | 0 | 38.407 |
| Rioja | 6.054 | 34.006 | 23.237 | 39.451 |
| Valencian | 47.178 | 5.889 | 146.278 | 409.848 |
| Total | 608.608 | 696.355 | 730.901 |
In addition to these general measures, particular attention must be paid to the 418,890 hectares of irrigated land located above overexploited aquifers. In these areas, the water savings expected from improving or changing irrigation systems have a limited effect on total extraction volumes because, due to high extraction costs, farmers typically use efficient application methods. Therefore, aquifer replenishment requires additional measures, the implementation of which should be promoted through collaboration and coordination between the relevant public authorities and the users themselves, such as:
- Recharge with surface water
- Contribution of desalinated, desalinated or purified waters
- Change in the productive orientation of farms towards crops with lower water requirements than the current ones
- Voluntary commitments to abandon irrigated areas or to reduce the volumes extracted
Within the agri-environmental measures of the rural development programs for the period 2000-2006, actions have been planned to incentivize, through compensatory premiums, commitments to reduce water consumption by at least 50% of the concession.
5.4 Irrigation in progress
In accordance with the established priorities and the current situation of each irrigable area under development, the following areas are proposed to be transformed by zone and Autonomous Community by the 2008 horizon and in subsequent horizons.
IRRIGATION PROJECTS UNDER CONSTRUCTION AREA (ha) TO BE TRANSFORMED INTO 2008 HORIZON (1)
| REGULABLE AREA | AUTONOMOUS COMMUNITY | DOMINATED SURFACE | REGULABLE SURFACE | SURFACE WATERED IN 1997 | SURFACE TO TRANSFORM H-2008 | SLOPE SURFACE H>2008 |
|---|---|---|---|---|---|---|
| Baza-Huéscar | ANDALUSIA | 28.339 | 23.012 | 13.691 | – | 9.321 |
| Northwest Coast of Cadiz | ANDALUSIA | 9.100 | 9.096 | 5.858 | 3.238 | – |
| Almanzora Caves | ANDALUSIA | 7.642 | 4.945 | – | 3.945 | 1.000 |
| Joke | ANDALUSIA | 21.677 | 16.990 | 5.698 | 11.292 | – |
| Genil-Goat | ANDALUSIA | 44.580 | 40.600 | 16.099 | 2.296 | 22.205 |
| Guaro | ANDALUSIA | 10.885 | 8.933 | 4.901 | 3.032 | 1.000 |
| South Andévalo (center) | ANDALUSIA | 44.000 | 12.000 | 8.600 | – | 3.400 |
| TotaANDALUSIA | 166.223 | 115.576 | 54.847 | 23.803 | 36.926 | |
| Bardenas II | ARAGON | 48.456 | 27.355 | 11.392 | 6.045 | 9.918 |
| Calanda-Alcañiz Canal | ARAGON | 5.000 | 4.726 | 2.300 | 2.426 | – |
| Cinca Canal (Part 3) and El Tormillo | ARAGON | 26.618 | 23.087 | 18.250 | 4.837 | – |
| Civan Canal | ARAGON | 2.295 | 744 | – | 744 | – |
| Monegros I (4th section) | ARAGON | 4.617 | 1.699 | 1.358 | 341 | – |
| Monegros II | ARAGON | 164.843 | 64.745 | 14.541 | 12.000 | 38.204 |
| TotaARAGON | 251.829 | 122.356 | 47.841 | 26.393 | 48.122 | |
| Albacete Canal | CASTILLA LA MANCHA | 42.078 | 31.425 | – | 6.744 | 24.681 |
| La Sagra – Torrijos | CASTILLA LA MANCHA | 31.136 | 24.235 | 1.015 | 5.166 | 18.054 |
| Total CASTILLA-LA MANCHA | 73.214 | 55.660 | 1.015 | 11.910 | 42.735 |
IRRIGATION PROJECTS UNDER CONSTRUCTION AREA (ha) TO BE TRANSFORMED INTO 2008 HORIZON (2)
| REGULABLE AREA | AUTONOMOUS COMMUNITY | DOMINATED SURFACE | REGULABLE SURFACE | SURFACE WATERED IN 1997 | SURFACE TO TRANSFORM H-2008 | SLOPE SURFACE H>2008 |
|---|---|---|---|---|---|---|
| La Armuña | CASTILE AND LEON | 48.100 | 26.500 | – | 6.577 | 19.923 |
| Las Cogotas (Adaja River) | CASTILE AND LEON | 9.000 | 7.500 | 3.000 | 3.000 | 1.500 |
| Left Bank of the Tera | CASTILE AND LEON | 17.000 | 10.403 | 1.461 | 2.479 | 6.463 |
| Lower Moor | CASTILE AND LEON | 43.200 | 30.249 | 9.500 | – | 20.749 |
| Riaño (Porma) | CASTILE AND LEON | 12.011 | 9.032 | 1.533 | 7.499 | – |
| Riaño (Payuelos) | CASTILE AND LEON | 66.575 | 45.173 | – | 24.000 | 21.173 |
| TotaCastile and León | 195.886 | 128.857 | 15.494 | 43.555 | 69.808 | |
| Village – Camarles | CATALONIA | 7.500 | 6.000 | – | 100 | 5.900 |
| Alguerri-Balaguer | CATALONIA | 8.503 | 8.000 | 1.246 | 2.169 | 4.585 |
| Vallfornés expansion | CATALONIA | 800 | 500 | 350 | 50 | 100 |
| Margalef | CATALONIA | 4.500 | 1.500 | 900 | 600 | – |
| Muga – Right bank | CATALONIA | 3.967 | 2.700 | – | 200 | 2.500 |
| Perelló-Rasquera | CATALONIA | 1.200 | 880 | – | 200 | 680 |
| Pla del Sas | CATALONIA | 4.500 | 3.500 | – | 100 | 3.400 |
| Saint Martin of Tous | CATALONIA | 650 | 400 | – | 100 | 300 |
| Segarra-Garrigas | CATALONIA | 90.000 | 72.000 | – | 1.000 | 71.000 |
| Xerta-Senia | CATALONIA | 25.000 | 16.500 | – | 133 | 16.367 |
| TotaCatalonia | 146.620 | 111.980 | 2.496 | 4.652 | 104.832 | |
| Ambroz | ESTREMADURA | 11.800 | 3.200 | 1.000 | 2.200 | – |
| Center of Extremadura | ESTREMADURA | 27.000 | 13.831 | – | 9.008 | 4.823 |
| Zújar (Sectors V and VIII) | ESTREMADURA | 29.075 | 21.268 | 16.026 | 5.242 | – |
| Total EXTREMADURA | 67.875 | 38.299 | 17.026 | 16.450 | 4.823 | |
| Navarre Canal | NAVARRE | 78.826 | 57.713 | – | 5.707 | 52.006 |
| Mendavia | NAVARRE | 3.653 | 3.048 | 1.861 | 1.187 | – |
| Total NAVARRE | 82.479 | 60.761 | 1.861 | 6.894 | 52.006 | |
| Najerilla | RIOJA | 29.800 | 18.788 | 10.380 | 4.708 | 3.700 |
| Total RIOJA | 29.800 | 18.788 | 10.380 | 4.708 | 3.700 | |
| TEITHERTTO THE | 1.013.926 | 652.277 | 150.960 | 138365 | 362.952 |
5.5 Social interest irrigation program
PROGRAM OF ACTIONS TOWARDS 2008 FOR SOCIAL IRRIGATION (1)
| REGULABLE AREA | AUTONOMOUS COMMUNITY | BASIN | PROVINCE | SURFACE TO TRANSFORM (ha) |
|---|---|---|---|---|
| COASTLINE PLAN (VARIOUS AREAS) | ANDALUSIA | SEVERAL | SEVERAL | 4.000 |
| TottoANDALUSIA | 4.000 | |||
| ALCALA DE GURREA | ARAGON | EBRO | HUESCA | 1.320 |
| ALCUBIERRE | ARAGON | EBRO | HUESCA | 409 |
| AREN | ARAGON | EBRO | HUESCA | 200 |
| CINCA HEADBOARD / LA FUEVA | ARAGON | EBRO | HUESCA | 1.885 |
| BERDUN CANAL | ARAGON | EBRO | HUESCA | 2.500 |
| CASTEJON DE MONEGROS | ARAGON | EBRO | HUESCA | 428 |
| GUARA RESERVOIR | ARAGON | EBRO | HUESCA | 1.250 |
| SOURCES OF EBRO | ARAGON | EBRO | SARAGOSSA | 2.500 |
| GRAUS | ARAGON | EBRO | HUESCA | 841 |
| GURREA DE GÁLLEGO | ARAGON | EBRO | SARAGOSSA | 1.400 |
| THE HOYA OF HUESCA (spots) | ARAGON | EBRO | HUESCA | 8.000 |
| THE SARDINIA | ARAGON | EBRO | HUESCA | 870 |
| HIGH BUNK BUNK * (stains) | ARAGON | EBRO | HUESCA | 8.000 |
| MAELLA | ARAGON | EBRO | SARAGOSSA | 700 |
| MORE OF THE KILLS | ARAGON | EBRO | TERUEL | 300 |
| MORRA DE RUBIELOS | ARAGON | JÚCAR | TERUEL | 155 |
| FIFTH OF EBRO | ARAGON | EBRO | SARAGOSSA | 1.234 |
| SOMONTANO | ARAGON | EBRO | HUESCA | 2.000 |
| TottoARAGON ** | 20.967 | |||
| IRRIGATION WITH TREATED WATER | BALEARICS | BALEARICS | BALEARICS | 2.250 |
| Tottol BALEARIC ISLANDS | 2.250 | |||
| IRRIGATION WITH TREATED WATER | CANARY ISLANDS | CANARY ISLANDS | SEVERAL | 3.500 |
| MID-ALTITUDE IRRIGATION | CANARY ISLANDS | CANARY ISLANDS | SEVERAL | 1.000 |
| Tottol CANARY ISLANDS | 4.500 |
(**) Of the total areas proposed in Aragon, only 20,967 ha will be executed according to H-2008
PROGRAM OF ACTIONS FOR SOCIAL IRRIGATION TOWARDS 2008 (2)
| REGULABLE AREA | AUTONOMOUS COMMUNITY | BASIN | PROVINCE | SURFACE TO TRANSFORM (ha) |
|---|---|---|---|---|
| VALDERREDIBLE | CANTABRIA | EBRO | CANTABRIA | 1.000 |
| LIEBANA | CANTABRIA | NORTH | CANTABRIA | 500 |
| REINOSA AREA | CANTABRIA | EBRO | CANTABRIA | 900 |
| SOBA | CANTABRIA | NORTH | CANTABRIA | 100 |
| Tottol CANTABRIA | 2.500 | |||
| THE DRAW | CASTILLA LA MANCHA | JÚCAR | BASIN | 2.450 |
| ALTO CABRIEL | CASTILLA LA MANCHA | JÚCAR | BASIN | 700 |
| UPPER JÚCAR | CASTILLA LA MANCHA | JÚCAR | BASIN | 700 |
| MANCHUELA CENTER | CASTILLA LA MANCHA | JÚCAR | BASIN | 4.000 |
| VEGA DEL PICAZO | CASTILLA LA MANCHA | JÚCAR | BASIN | 400 |
| RIVERSAL | CASTILLA LA MANCHA | JÚCAR | BASIN | 500 |
| CALVACHE RIVER | CASTILLA LA MANCHA | BLOCK | BASIN | 250 |
| TRADITIONAL TAJO (A.) | CASTILLA LA MANCHA | BLOCK | BASIN | 700 |
| ALMOGUERA MI TAJO | CASTILLA LA MANCHA | BLOCK | CUENCA-GUADALAJARA | 1.000 |
| GUADIELA | CASTILLA LA MANCHA | BLOCK | BASIN | 500 |
| CAÑAMARES RIVER | CASTILLA LA MANCHA | BLOCK | GUADALAJARA | 200 |
| ATANCE | CASTILLA LA MANCHA | BLOCK | GUADALAJARA | 300 |
| COGOLLUDO | CASTILLA LA MANCHA | BLOCK | GUADALAJARA | 600 |
| UPPER AND MIDDLE TAJUÑA | CASTILLA LA MANCHA | BLOCK | GUADALAJARA | 250 |
| TOWN OF VALLES | CASTILLA LA MANCHA | BLOCK | GUADALAJARA | 100 |
| CASTREJÓN MY. | CASTILLA LA MANCHA | BLOCK | TOLEDO | 500 |
| ABRAHAM'S TOWER | CASTILLA LA MANCHA | GUADIANA | REAL CITY | 1.000 |
| AURILES CHANNEL | CASTILLA LA MANCHA | GUADIANA | REAL CITY | 400 |
| CANCARIX | CASTILLA LA MANCHA | SAFE | ALBACETE | 300 |
| Fuente Álamo | CASTILLA LA MANCHA | SAFE | ALBACETE | 650 |
| TOBARRA (EXTENSION) | CASTILLA LA MANCHA | SAFE | ALBACETE | 700 |
| ONTUR – ALBATANA | CASTILLA LA MANCHA | SAFE | ALBACETE | 500 |
| HELLÍN | CASTILLA LA MANCHA | SAFE | ALBACETE | 300 |
| Tottol CASTILLA-LA MANCHA | 17.000 |
PROGRAM OF ACTIONS FOR SOCIAL IRRIGATION TOWARDS 2008 (3)
| REGULABLE AREA | AUTONOMOUS COMMUNITY | BASIN | PROVINCE | SURFACE TO TRANSFORM (ha) |
|---|---|---|---|---|
| SMALL RAFTS (OLMILLOS AND OTHERS) | CASTILE AND LEON | DUERO | SORIA | 1.500 |
| VALDAVIA | CASTILE AND LEON | DUERO | PALENCIA | 2.400 |
| TABARA | CASTILE AND LEON | DUERO | ZAMORA | 2.500 |
| TottoCastile and León | 6.400 | |||
| CALBA SPLUGA | CATALONIA | EBRO | LLEIDA | 120 |
| FREGINALS | CATALONIA | EBRO | TARRAGONA | 472 |
| GARRIGUES SUD STAGE III | CATALONIA | EBRO | LLEIDA | 844 |
| GARRIGUES SUD STAGE IV FI | CATALONIA | EBRO | LLEIDA | 850 |
| GARRIGUES SUD STAGE IV F2 | CATALONIA | EBRO | LLEIDA | 455 |
| ELS GUIAMETS | CATALONIA | EBRO | TARRAGONA | 2.024 |
| L'OLVERA AL VILOSELL | CATALONIA | EBRO | LLEIDA | 100 |
| L´OLVERA AL´ALBIL, POBLA DE CERVOLES I LES BORJES BLANQUES | CATALONIA | EBRO | LLEIDA | 385 |
| LA SENIA (WASTEWATER) | CATALONIA | EBRO | TARRAGONA | 200 |
| MORE FROM BARBERANS | CATALONIA | EBRO | TARRAGONA | 400 |
| VALLS (WASTEWATER) | CATALONIA | EBRO | TARRAGONA | 350 |
| TottoCatalonia | 6.200 | |||
| ALCOLLARIN-MIAJADAS | ESTREMADURA | GUADIANA | CÁCERES | 2.500 |
| ZÚJAR EXTENSION | ESTREMADURA | GUADIANA | BADAJOZ | 1.100 |
| THE SERENA | ESTREMADURA | GUADIANA | BADAJOZ | 2.500 |
| OTHER AREAS | ESTREMADURA | GUADIANA | CAC/BAD | 850 |
| Tottol EXTREMADURA | 6.950 | |||
| VARIOUS AREAS | GALICIA | SEVERAL | SEVERAL | 2.500 |
| Tottol GALICIA | 2.500 | |||
| BARGOTA II | NAVARRE | EBRO | NAVARRE | 100 |
| FUNES “THE PLASTER AND THE LUCK” | NAVARRE | EBRO | NAVARRE | 800 |
| URRAUL BAJO-LUMBIER | NAVARRE | EBRO | NAVARRE | 217 |
| SESMA III | NAVARRE | EBRO | NAVARRE | 100 |
| SANTACARA II | NAVARRE | EBRO | NAVARRE | 420 |
| ANDOSILLA II | NAVARRE | EBRO | NAVARRE | 750 |
| AIBAR “EL SASO” | NAVARRE | EBRO | NAVARRE | 500 |
| Tottol NAVARRE | 2.887 | |||
| RIOJA ALAVESA (VARIOUS AREAS) | THE BASQUE COUNTRY | EBRO | ÁLAVA | 5.000 |
| TottoThe Basque Country | 5.000 | |||
| CIDACOS | RIOJA | EBRO | RIOJA | 1.000 |
| IREGUA | RIOJA | EBRO | RIOJA | 2.000 |
| PULL-EYE | RIOJA | EBRO | RIOJA | 1.200 |
| YALDE | RIOJA | EBRO | RIOJA | 1.072 |
| Tottol RIOJA | 5.272 | |||
| TNATIONAL OTAL | 86.426 |
PROGRAM OF ACTIONS FOR SOCIAL IRRIGATION TOWARDS 2008: SUMMARY BY AUTONOMOUS COMMUNITY
| Autonomous Community | Number of zones | Area (ha) |
|---|---|---|
| Andalusia | Several | 4.000 |
| Aragon | Several | 20.967 |
| Balearics | 1 | 2.250 |
| Canary Islands | 2 | 4.500 |
| Cantabria | 4 | 2.500 |
| Castilla la Mancha | 23 | 17.000 |
| Castile and León | 3 | 6.400 |
| Catalonia | 11 | 6.200 |
| Estremadura | Several | 6.950 |
| Galicia | Several | 2.500 |
| Navarre | 7 | 2.887 |
| the Basque Country | 1 | 5.000 |
| Rioja | 4 | 5.272 |
| Total | 86.426 |
5.6 Private irrigation program
In the planning of new irrigation systems, private initiatives must also be taken into account, in accordance with current legislation on concessions, authorizations, public aid, etc.
In Horizon 2008 it is estimated that transformations promoted by individuals may reach 18,000 hectares.
5.7 Summary of actions in new irrigation systems
The 2008 Horizon Plan proposes the irrigation of 242,791 hectares of new land, giving priority to the completion of 138,365 hectares of projects already underway and the transformation of 86,426 hectares for reasons of social interest, with the following territorial distribution:
SUMMARY TABLE OF NEW IRRIGATED AREAS PNR H-2008 (ha)
| AUTONOMOUS COMMUNITY | IRRIGATION PROJECTS UNDER CONSTRUCTION | SOCIAL IRRIGATION | SUBSIDIZED PRIVATE IRRIGATION | TOTAL |
|---|---|---|---|---|
| Andalusia | 23.803 | 4.000 | – | 27.803 |
| Aragon | 26.393 | 20.967 | – | 47.360 |
| Asturias | – | – | – | – |
| Balearics | – | 2.250 | – | 2.250 |
| Canary Islands | – | 4.500 | – | 4.500 |
| Cantabria | – | 2.500 | – | 2.500 |
| Castilla la Mancha | 11.910 | 17.000 | – | 28.910 |
| Castile and León | 43.555 | 6.400 | – | 49.955 |
| Catalonia | 4.652 | 6.200 | – | 10.852 |
| Estremadura | 16.450 | 6.950 | – | 23.400 |
| Galicia | – | 2.500 | – | 2.500 |
| Madrid | – | – | – | – |
| Region of Murcia | – | – | – | – |
| Navarre | 6.894 | 2.887 | – | 9.781 |
| the Basque Country | – | 5.000 | – | 5.000 |
| The Rioja | 4.708 | 5.272 | – | 9.980 |
| Valencian Community | – | – | – | – |
| Without regionalizing | – | – | 18.000 | 18.000 |
| Total | 138.365 | 86.426 | 18.000 | 242.791 |
5.8 Support programs
Complementary to the actions for the improvement and consolidation of irrigation systems and the new transformations, it is necessary to plan support actions that allow, on the one hand, monitoring and evaluation of the results obtained and, on the other hand, improving irrigation techniques, the quality of materials and the training of technicians and irrigators.
5.8.1 Support for modernization and transformation actions
1. In each area of action, the evolution of both the degree of efficiency of the irrigation and drainage systems, as well as the soils based on the quality of the irrigation water, and the condition of the infrastructures, will be monitored.
To this end, the standardization, testing and homologation work of materials and equipment will be promoted at the CENTER and in collaboration with the manufacturers, and the necessary collaboration will be established with the Autonomous Communities in matters of soil and water quality.
2. To evaluate the results derived from the programmed actions, different socio-economic variables will be studied in each area, including the impacts on the structure of farms, on agricultural production and income, on employment and on the rural population.
3. Both during the execution phase of the projects and during the operation of the irrigation systems, monitoring will be carried out on the formal conditions derived from the environmental impact statements and on the effects on the soil, vegetation, flora and fauna, landscapes, etc.
5.8.2 Technology Transfer
A decisive factor in achieving effective management of consumed water resources is the level of professional training of technicians and farmers who, in cases of changes in irrigation systems resulting from modernization actions, must adapt to the use of new materials, fertigation methods, automation, etc., and who in new transformations must be initiated in the handling of irrigation equipment and techniques.
Therefore, it is necessary to facilitate the training and professional development of technicians and irrigators, through courses, seminars, conferences, etc. of a technical-practical nature and at a level appropriate to the different groups of recipients.
5.9 Investments
In accordance with the various proposed actions included in sections 5.3, 5.4, 5.5, 5.6, and 5.8, the necessary investments have been established and broken down into the different programs. These actions, which fall under the responsibility of the Agricultural Administrations, are consistent with those proposed in the National Hydrological Plan.
5.9.1 Existing Irrigation Systems
A table is included with the total investments of the action program for the consolidation and improvement of irrigation and with the investments planned for Horizon-2008, where 50% of the total program will be executed.
IRRIGATION CONSOLIDATION AND IMPROVEMENT PROGRAM TOTAL INVESTMENTS (millions of pesetas) BY TYPE OF ACTION AND AUTONOMOUS COMMUNITY
| Autonomous Community | Repair of hydraulic structures | Modification of transport and distribution systems | Change in the irrigation application system | Complementary actions | Total Program | Total H-2008 50% |
|---|---|---|---|---|---|---|
| Andalusia | 24.522 | 56.761 | 44.067 | 42.456 | 167.805 | 83.903 |
| Aragon | 36.561 | 33.069 | 25.938 | 15.427 | 110.995 | 55.497 |
| Asturias | 152 | 0 | 0 | 76 | 228 | 114 |
| Balearics | 116 | 4.833 | 1.612 | 1.225 | 7.786 | 3.893 |
| Canary Islands | 1.542 | 6.214 | 4.292 | 2.466 | 14.512 | 7.256 |
| Cantabria | 0 | 0 | 0 | 275 | 275 | 138 |
| Castilla la Mancha | 7.857 | 15.599 | 35.425 | 6.496 | 65.376 | 32.688 |
| Castile and León | 55.152 | 76.170 | 42.330 | 45.318 | 218.969 | 109.484 |
| Catalonia | 16.502 | 25.116 | 28.394 | 13.789 | 83.801 | 41.901 |
| Estremadura | 4.084 | 25.405 | 4.716 | 8.597 | 42.801 | 21.400 |
| Galicia | 2.815 | 975 | 565 | 1.224 | 5.580 | 2.790 |
| Madrid | 4.291 | 0 | 1.456 | 1.693 | 7.440 | 3.720 |
| Murcia | 0 | 38.898 | 30.767 | 18.127 | 87.792 | 43.896 |
| Navarre | 8.057 | 20.216 | 6.310 | 5.190 | 39.773 | 19.887 |
| the Basque Country | 0 | 3.702 | 0 | 1.894 | 5.595 | 2.798 |
| Rioja | 2.285 | 20.798 | 9.946 | 2.982 | 36.011 | 18.006 |
| Valencian | 20.266 | 4.299 | 72.356 | 25.461 | 122.382 | 61.191 |
| Total | 184.201 | 332.053 | 308.172 | 192.696 | 1.017.123 | 508.562 |
5.9.2 Irrigation projects under construction
The total investment needed to convert the surface area of the irrigated lands under construction into irrigated land by Horizon 2008 amounts to 189,108 million pesetas, a figure obtained in accordance with the planned costs of carrying out the transformation works.
IRRIGATION PROJECTS UNDER CONSTRUCTION: TOTAL INVESTMENTS (Millions of Pesetas) BY IRRIGATED AREA AND AUTONOMOUS COMMUNITY
| REGULABLE AREA | TOTAL |
|---|---|
| Northwest Coast of Cadiz | 785 |
| Almanzora Caves | 9.930 |
| Joke | 17.320 |
| Genil-Goat | 4.310 |
| Guaro | 9.245 |
| TotaAndalusia | 41.590 |
| Bardenas II | 9.100 |
| Calanda-Alcañiz Canal | 4.680 |
| Cinca Canal (Part 3) and El Tormillo | 4.680 |
| Monegros I (4th section) | 520 |
| Monegros II | 24.050 |
| TotaAragon | 43.030 |
| Albacete Canal | 9.100 |
| La Sagra – Torrijos | 6.500 |
| TotaCastile-La Mancha | 15.600 |
| La Armuña | 7.800 |
| Las Cogotas (Adaja River) | 4.550 |
| Left Bank of the Tera | 3.250 |
| Riaño Porma | 7.800 |
| Riaño Payuelos | 33.800 |
| TotaCastile and León | 57.200 |
| Village – Camarles | 130 |
| Alguerri-Balaguer | 2.340 |
| Vallfornés expansion | 68 |
| Margalef | 520 |
| Muga – Right bank | 325 |
| Perelló-Rasquera | 195 |
| Pla del Sas | 130 |
| Saint Martin of Tous | 130 |
| Segarra-Garrigas | 1.430 |
| Xerta-Senia | 160 |
| TotaCatalonia | 5.428 |
| Ambroz | 1.300 |
| Center of Extremadura | 13.650 |
| Zújar | 1.560 |
| Total Extremadura | 16.510 |
| Mendavia | 1.950 |
| Navarre Canal | 7.800 |
| Total Navarra | 9.750 |
| Najerilla | – |
| Total Rioja | – |
| TEITHERTTO THE | 189.108 |
5.9.3 Irrigation of social interest
In accordance with the action program to Horizon 2008, the total investments necessary for the transformation into irrigated land of the proposed area, including the part corresponding to the works defined by the Law of Agrarian Reform and Development as works of common interest and works of private agricultural interest by Autonomous Community, are the following:
IRRIGATION PROJECTS OF SOCIAL INTEREST: TOTAL INVESTMENTS (Millions of Pesetas) BY AUTONOMOUS COMMUNITY
| AUTONOMOUS COMMUNITY | TOTAL |
|---|---|
| Andalusia | 8.580 |
| Aragon | 22.100 |
| Balearics | 5.200 |
| Canary Islands | 8.450 |
| Cantabria | 2.600 |
| Castilla la Mancha | 19.600 |
| Castile and León | 9.100 |
| Catalonia | 8.320 |
| Estremadura | 8.450 |
| Galicia | 2.600 |
| Navarre | 3.900 |
| the Basque Country | 5.460 |
| Rioja | 9.100 |
| Total | 113.460 |
ACTIONS OF THE NATIONAL IRRIGATION PLAN HORIZON 2008 TOTAL INVESTMENTS (Millions of Ptas.)
| AUTONOMOUS COMMUNITY | CONSOLIDATION AND IMPROVEMENT | IRRIGATION PROJECTS UNDER CONSTRUCTION | SOCIAL IRRIGATION | SUBSIDIZED PRIVATE IRRIGATION | OTHER PROGRAMS | TOTAL |
|---|---|---|---|---|---|---|
| Andalusia | 83.903 | 41.590 | 8.580 | – | – | 134.074 |
| Aragon | 55.497 | 43.030 | 22.100 | – | – | 120.626 |
| Asturias | 114 | – | – | – | – | 114 |
| Balearics | 3.893 | – | 5.200 | – | – | 9.094 |
| Canary Islands | 7.256 | – | 8.450 | – | – | 15.706 |
| Cantabria | 138 | – | 2.600 | – | – | 2.738 |
| Castilla la Mancha | 32.688 | 15.600 | 19.600 | – | – | 67.888 |
| Castile and León | 109.484 | 57.200 | 9.100 | – | – | 175.784 |
| Catalonia | 41.901 | 5.428 | 8.320 | – | – | 55.648 |
| Estremadura | 21.400 | 16.510 | 8.450 | – | – | 46.360 |
| Galicia | 2.790 | – | 2.600 | – | – | 5.390 |
| Madrid | 3.720 | – | – | – | – | 3.720 |
| Region of Murcia | 43.896 | – | – | – | – | 43.896 |
| Navarre | 19.887 | 9.750 | 3.900 | – | – | 33.538 |
| the Basque Country | 2.798 | – | 5.460 | – | – | 8.258 |
| The Rioja | 18.006 | – | 9.100 | – | – | 27.106 |
| Valencian Community | 61.191 | – | – | – | – | 61.190 |
| Without regionalizing | – | – | – | 20.600 | 4.275 | 24.875 |
| Total | 508.562 | 189.108 | 113.460 | 20.600 | 4.275 | 836.005 |
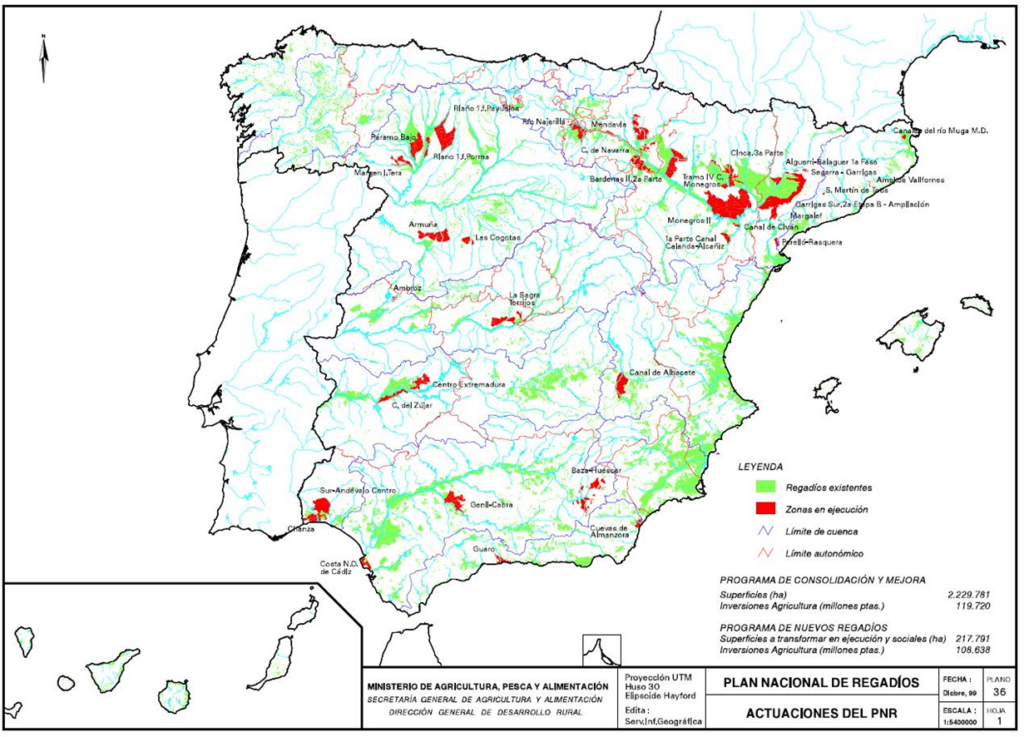
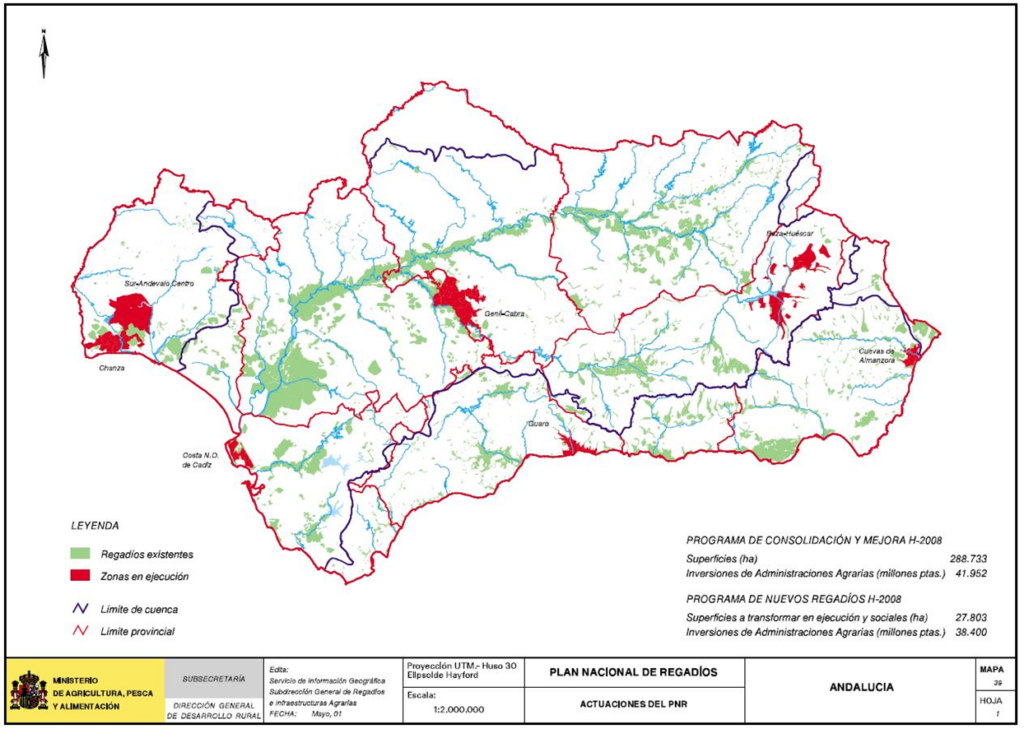
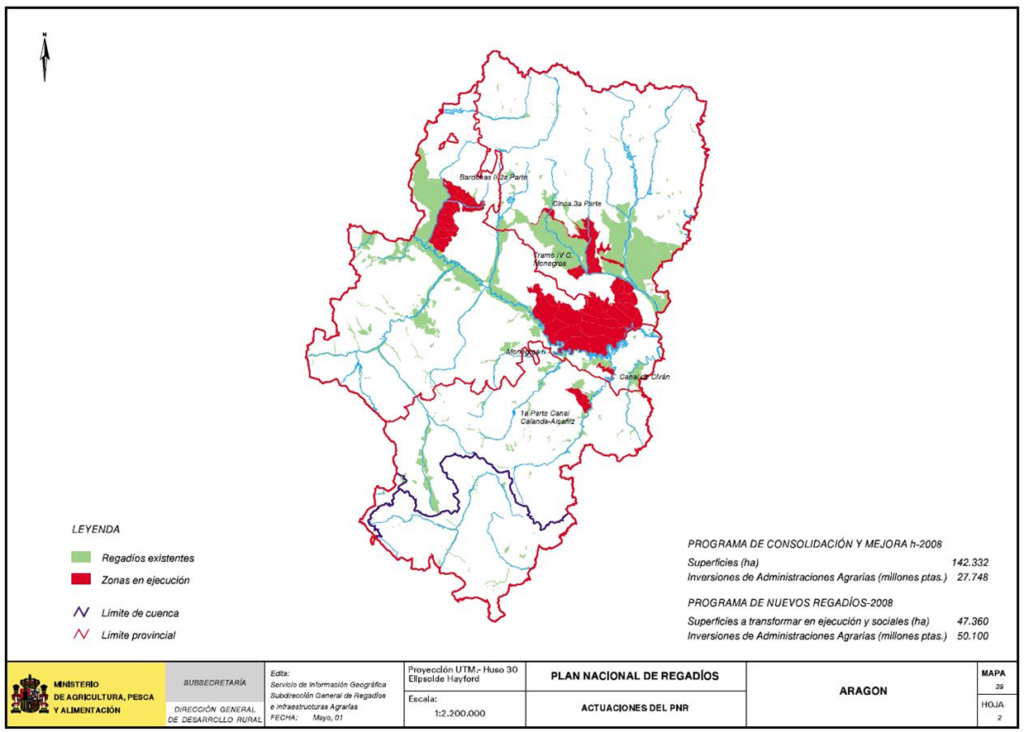
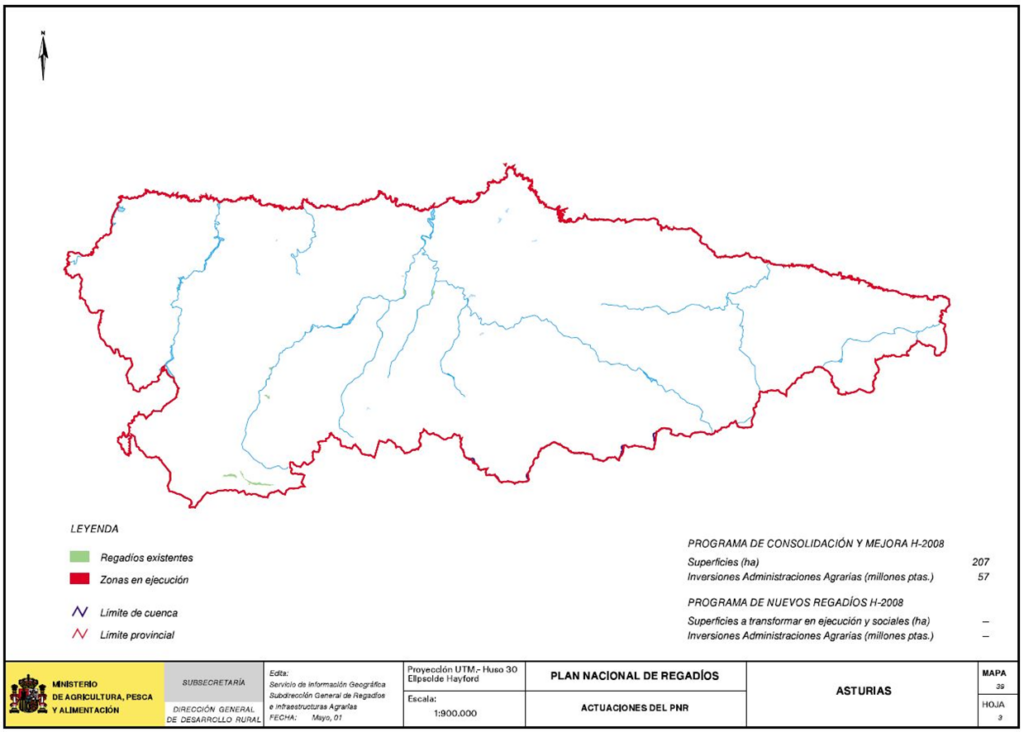
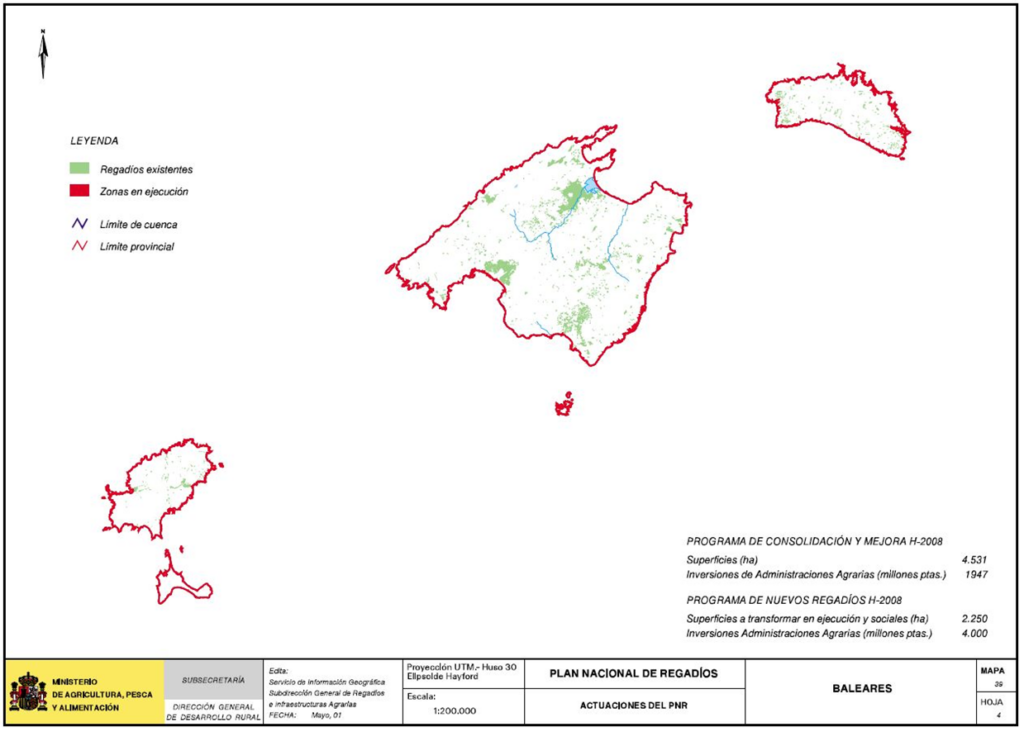
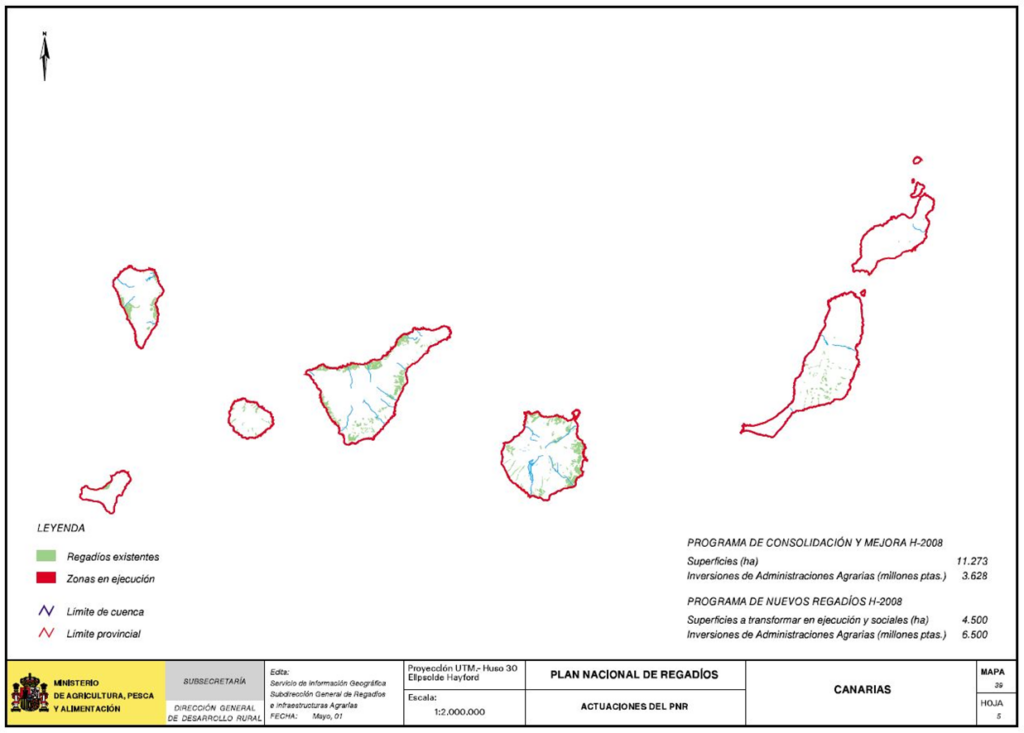
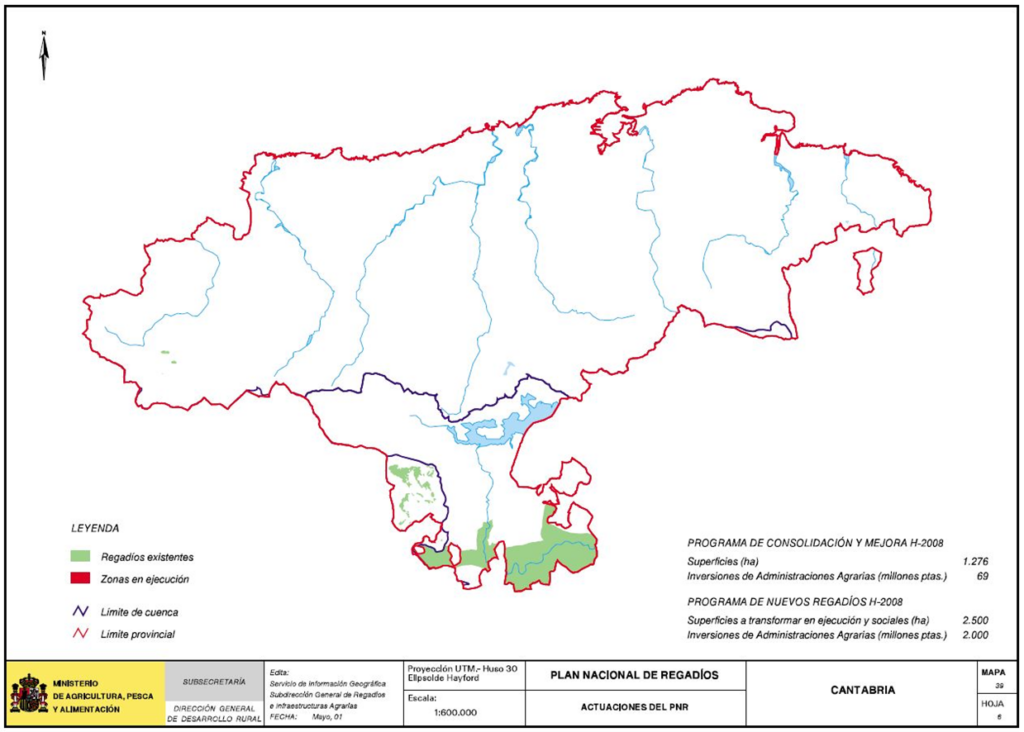
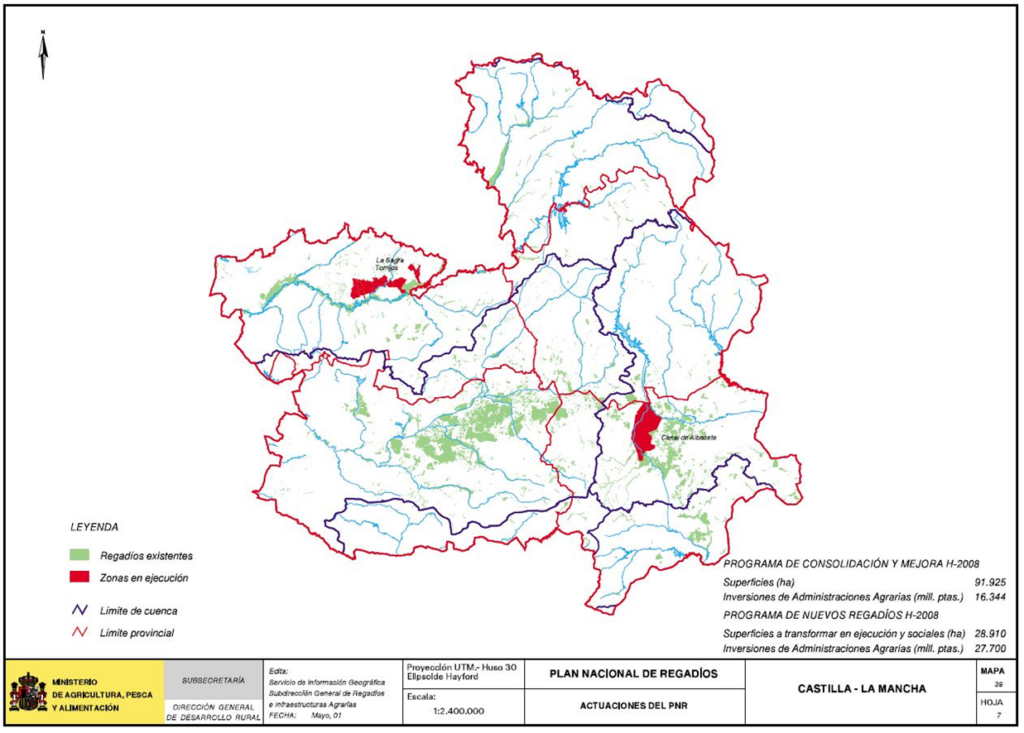
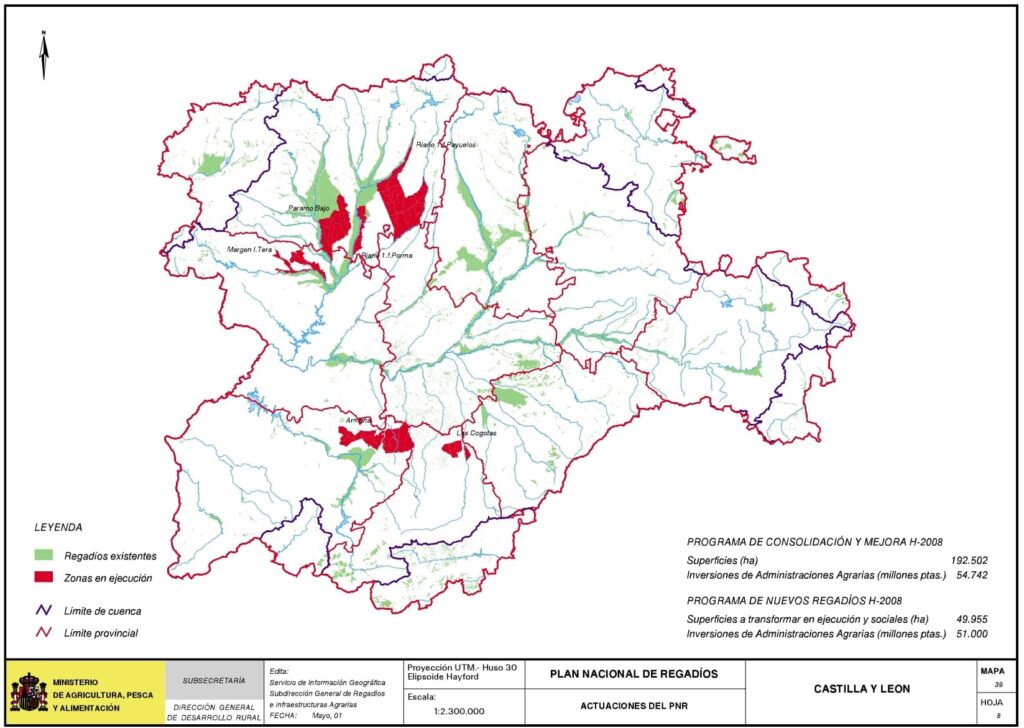
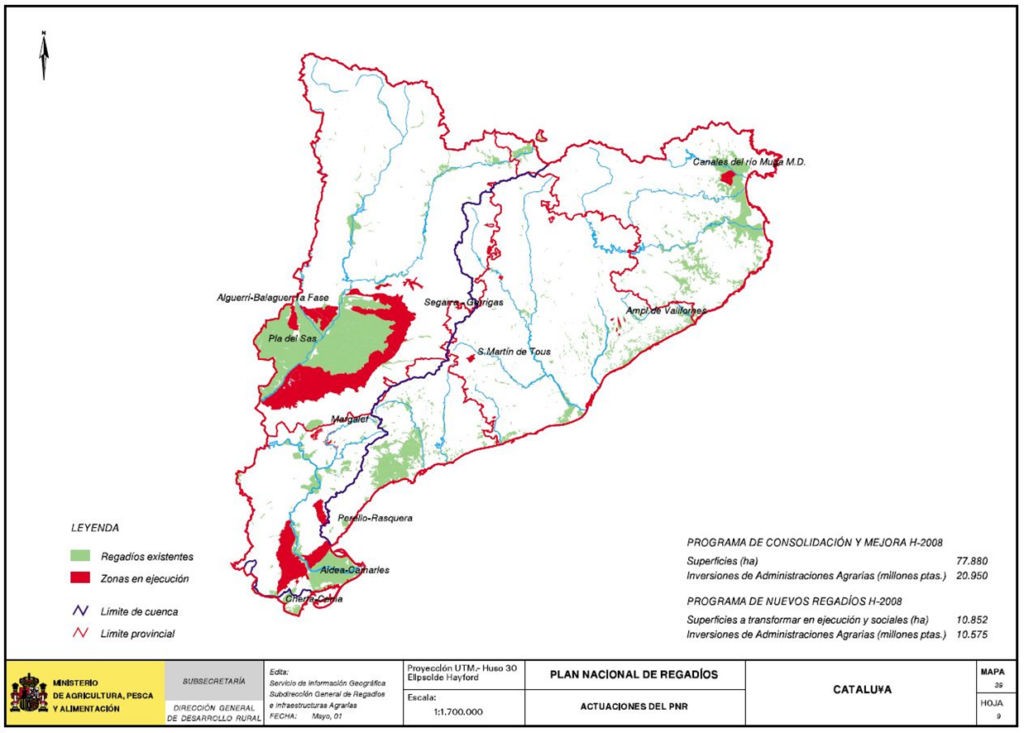
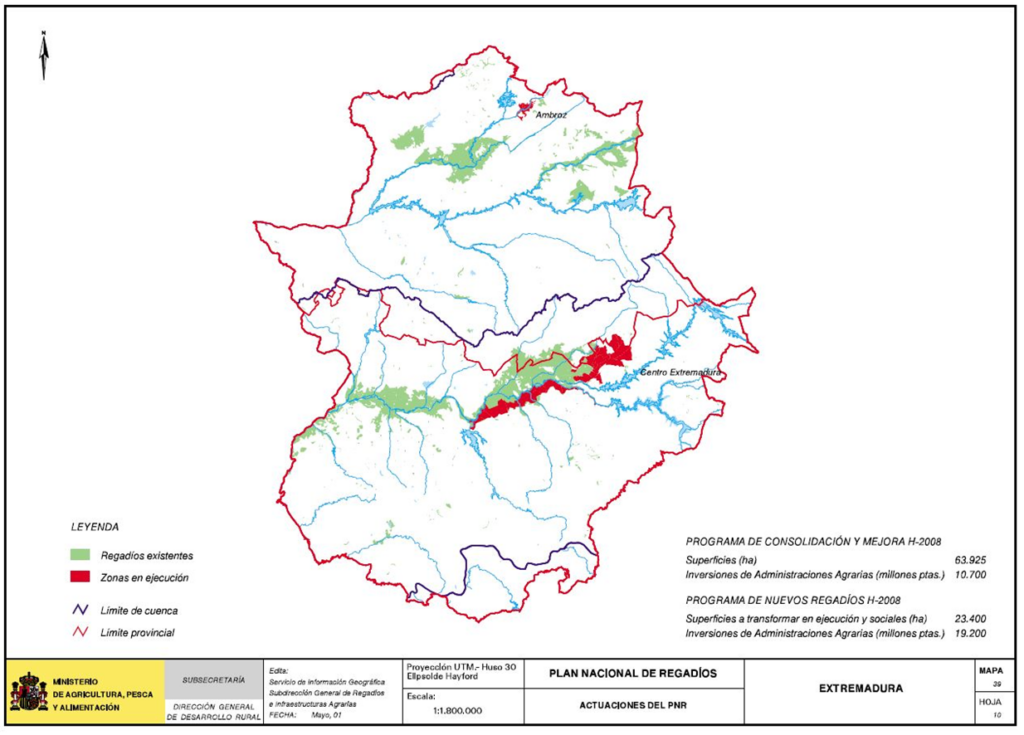
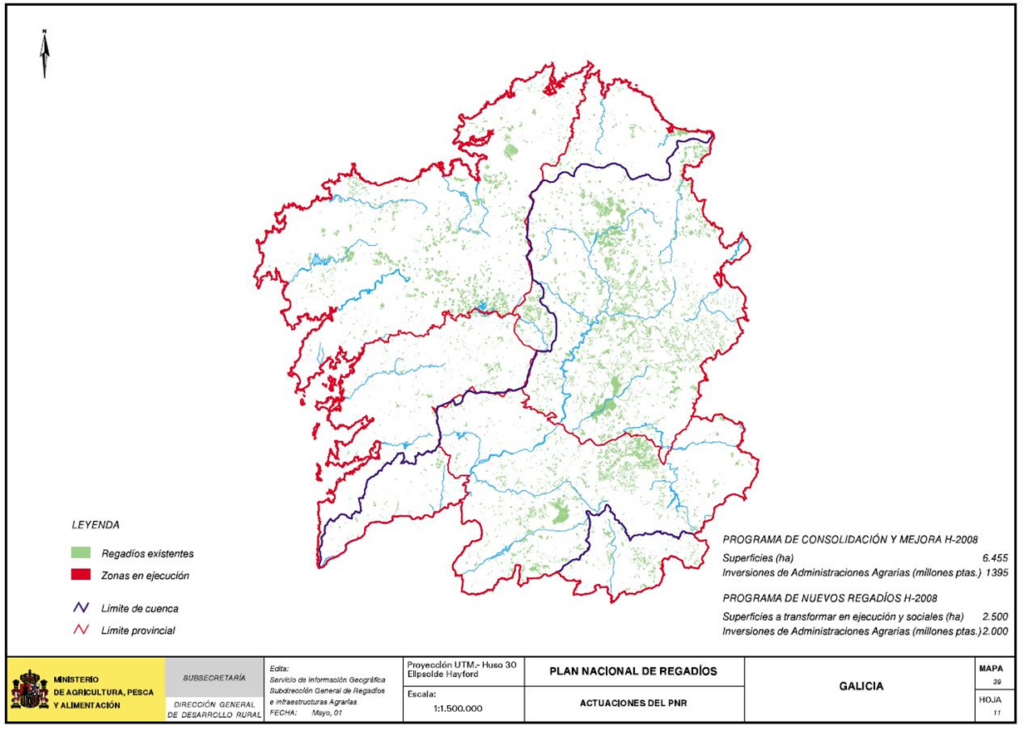
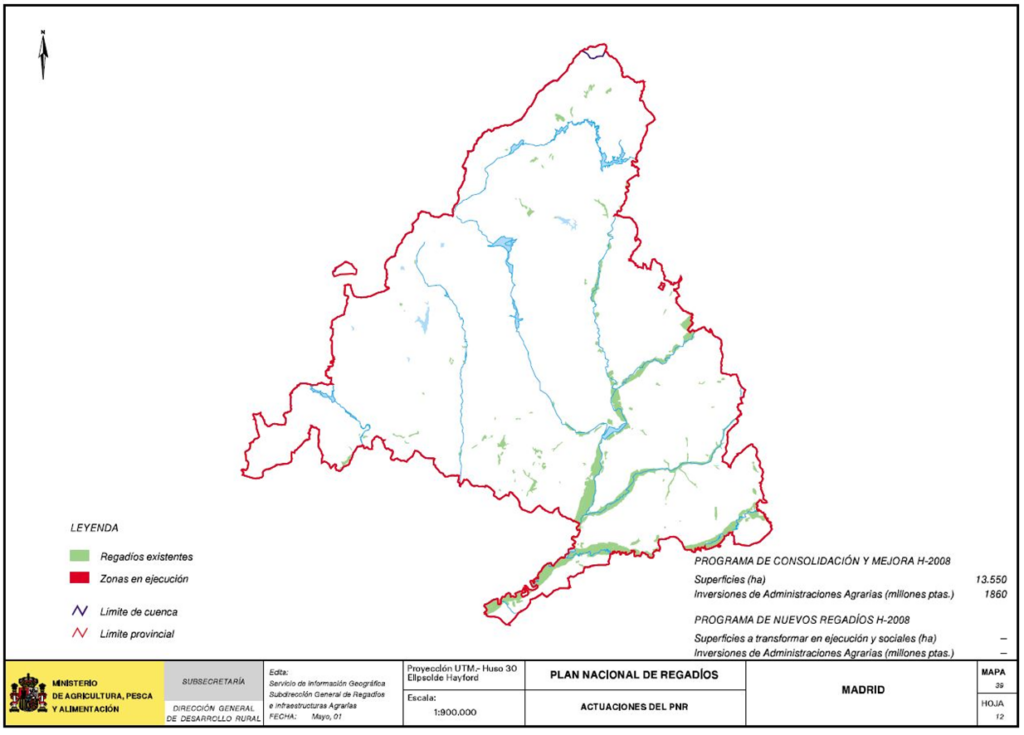
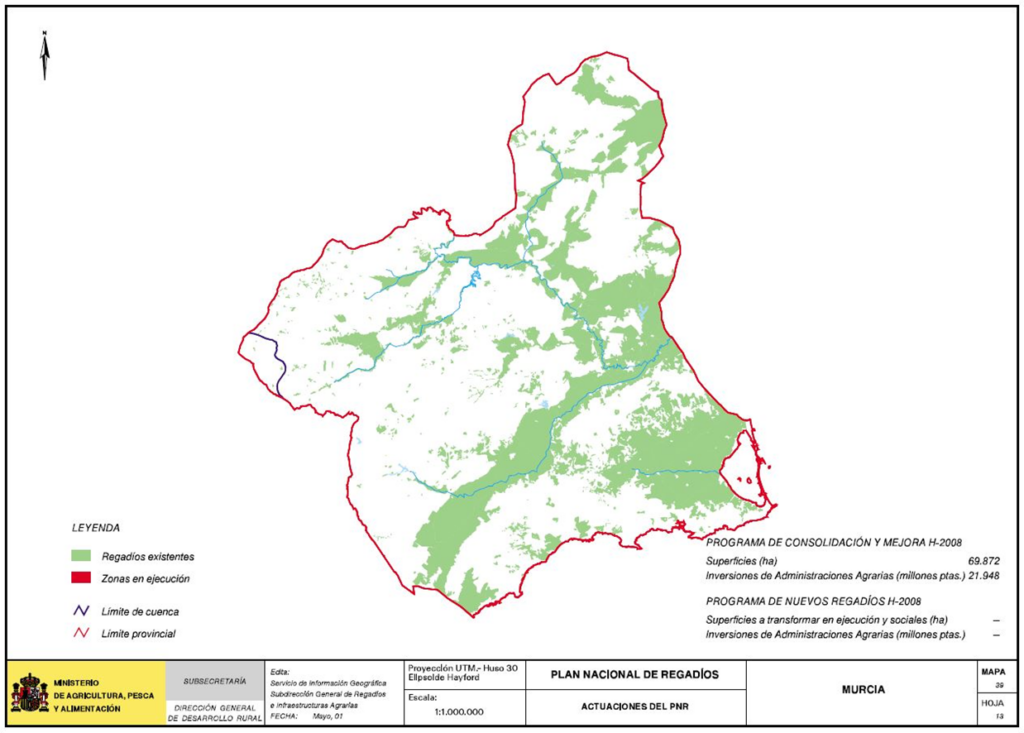
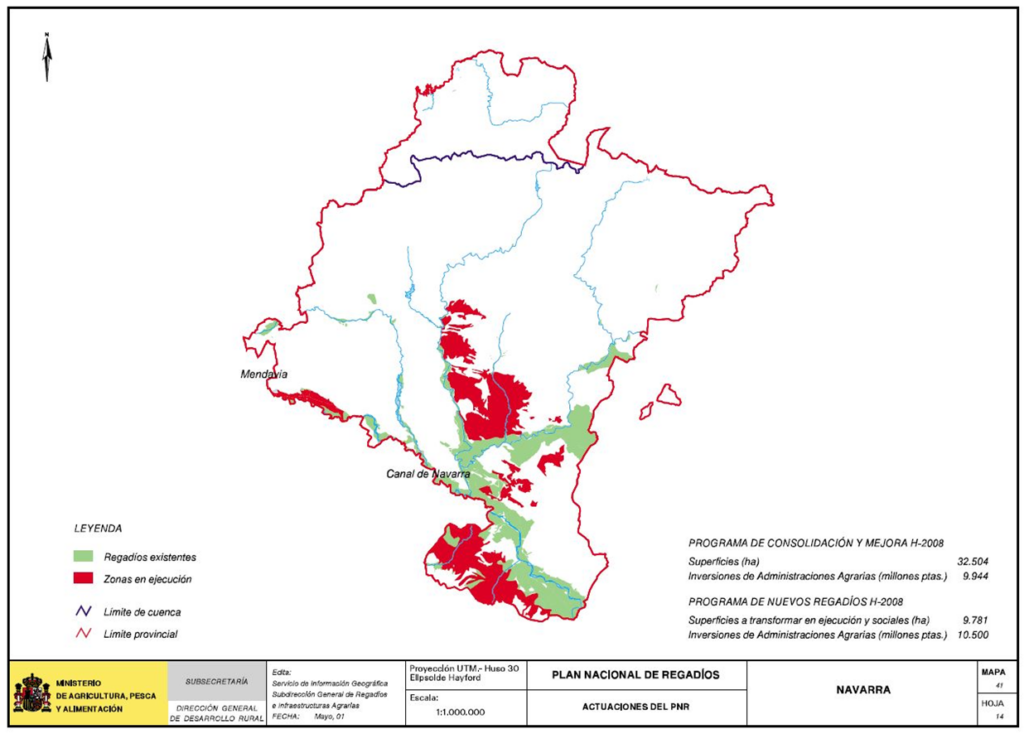
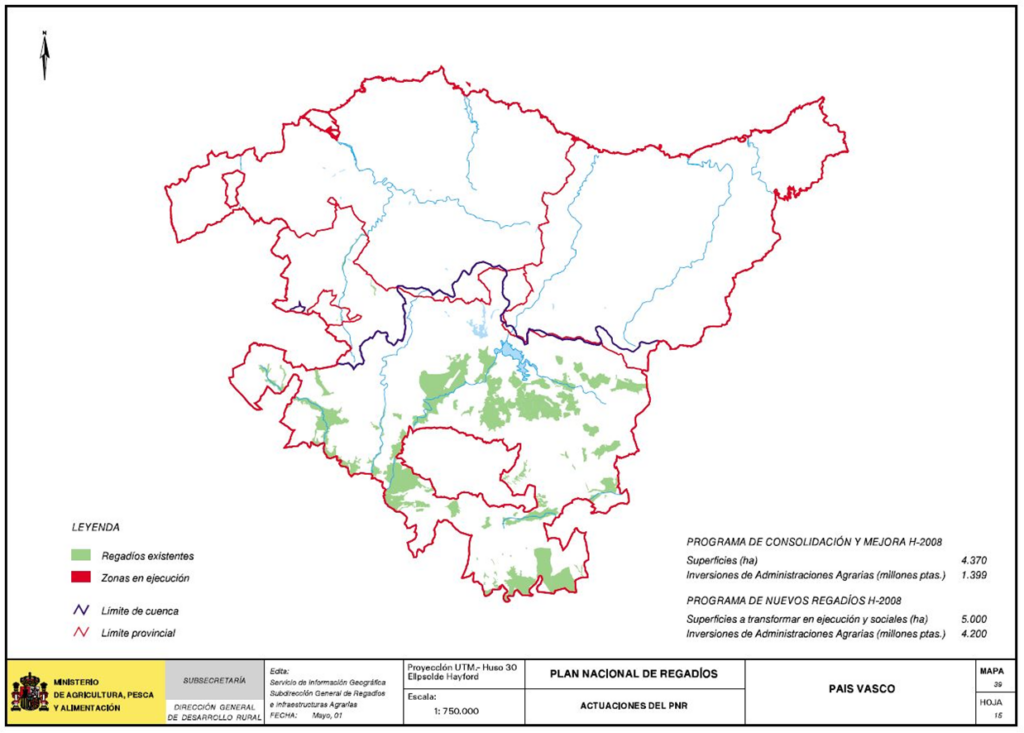
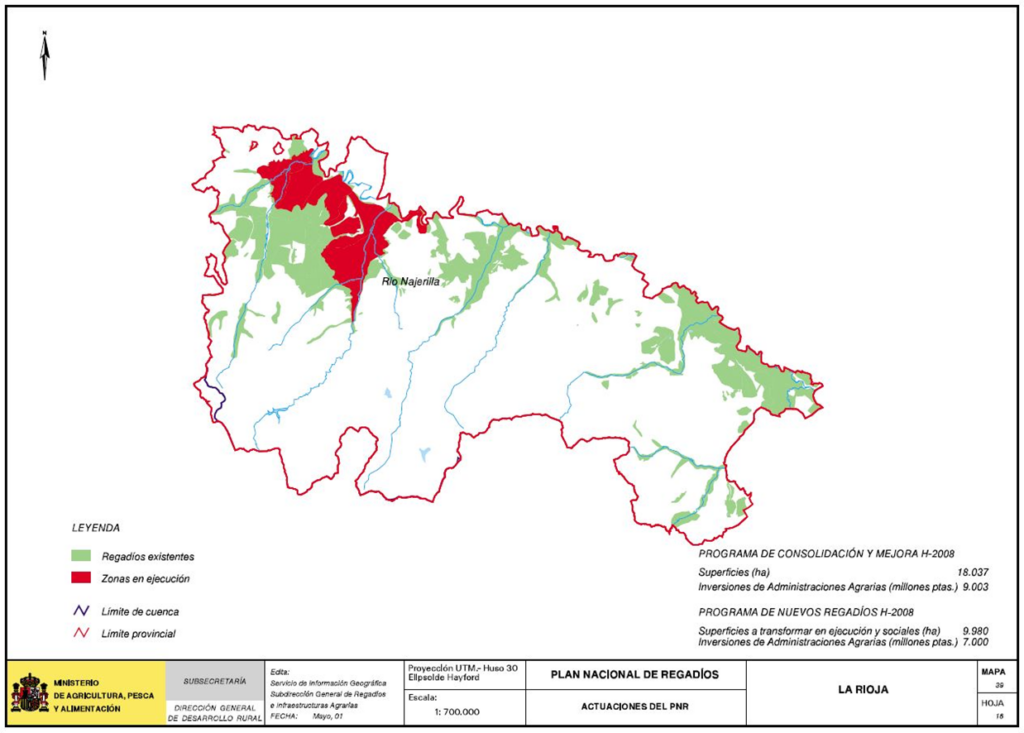
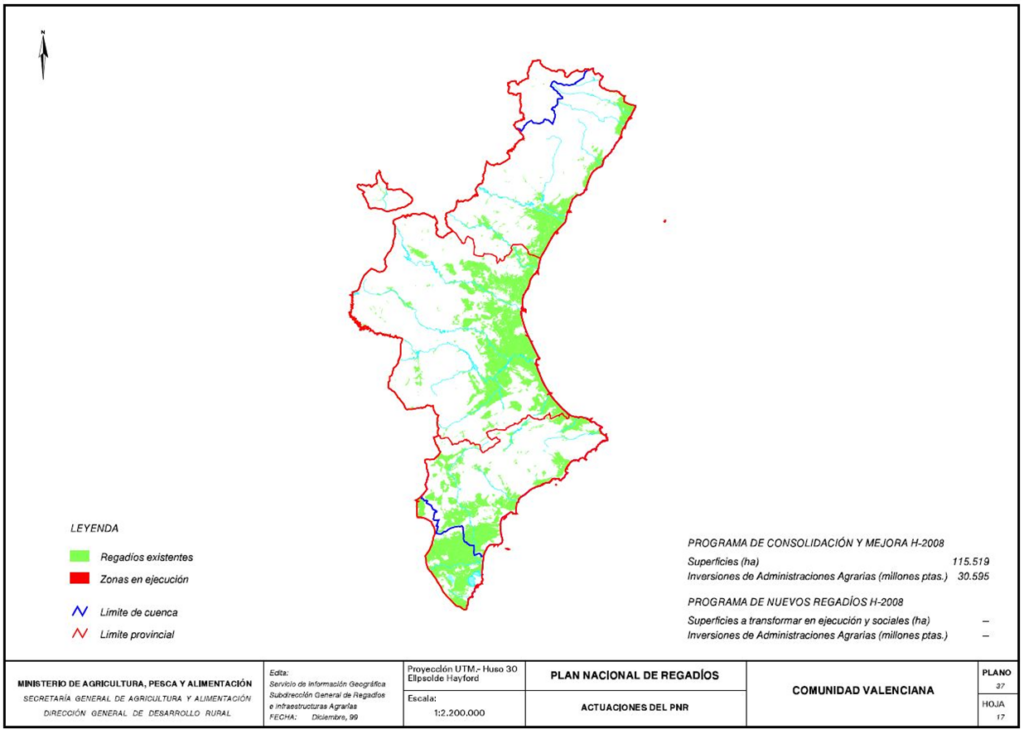
5.10 Financing
5.10.1 General conditions
Investments corresponding to Public Agricultural Administrations and economic support to farmers will be financed at 50% by the Central Administration (MAPA) and at 50% by the Autonomous Communities, except for Navarre and the Basque Country, to which measures consistent with their collection and quota system will apply.
The Ministry of Agriculture, Fisheries and Food and the Autonomous Communities will establish the necessary collaboration agreements for the execution, control, monitoring, evaluation and review of the action programs, specifying the projects and aid to be financed by each Administration, so that the public financing of investments for the set of all programs is 50%, which does not prevent one of them from exceeding this percentage in a certain action and not reaching it in another.
5.10.2 Consolidation and Improvement Program
The financing of the investments necessary for the irrigation consolidation and improvement programs will correspond to 50% to the farmers and 50% to the Agricultural Administrations.
As indicated in section 2 “Background”, Law 50/1998, of December 30, on Fiscal, Administrative and Social Measures, in its article 99, establishes the possibility of creating state-owned commercial companies for the execution of specific works and infrastructures for the modernization and consolidation of irrigation systems, in accordance with the provisions of the National Irrigation Plan in force at any given time.
Currently, four state-owned companies have been created by agreement of the Council of Ministers, covering the entire Spanish territory. These companies will execute and finance the corresponding works in accordance with collaboration agreements between irrigation communities or users. These actions will be carried out at the proposal of the Autonomous Communities and with the approval of the Ministry of Agriculture, Fisheries and Food (MAPA).
5.10.3 Irrigation program in progress
The total investment required for the transformation into irrigation of the irrigation systems under construction by Horizon 2008 of 189,108 million pesetas will be financed in accordance with the provisions of the legal provisions under which the different irrigable areas are being executed and in which the Law of Agrarian Reform and Development applies, including in the financing of the Agricultural Administrations the part corresponding to the works defined as works of common interest and works of private agricultural interest.
Regarding investments by Agricultural Administrations, the provisions of the legal regulations governing the implementation of the various irrigated areas will apply.
5.10.4 Social Interest Irrigation Program
Irrigation projects intended for social purposes will be declared to be of National or Regional Interest, and will therefore be subject to the provisions of the Law on Agrarian Reform and Development and will have priority in the development of the corresponding Local Action Plans (PHCs). The processing of the relevant concessions will be expressly linked to the reserves established for this purpose in the PHCs for said social irrigation projects.
5.10.5 Private Initiative Irrigation Program
The financing of the investments necessary for the private initiative irrigation program will correspond to 50% to the farmers and 50% to the Agricultural Administrations.
The system for approving and defining the aid to be granted to these projects will be established in the corresponding collaboration agreements between the Ministry of Agriculture, Fisheries and Food and the Autonomous Communities.
5.10.6 Support program
The financing of all PNR programs will be carried out, as indicated above, to 50% by the General Administration and to 50% by the Autonomous Communities.
5.10.7 EU Co-financing
Within the program of rural development measures approved for the period 2000-2006, actions related to irrigation have been included, which, therefore, have co-financing from the EAGGF assigned to the measure "Water resources management for agriculture" which amounts to the following sums:
COFYoNANCYoA.C.YoÓEAGGF N
| Program | Millions of euros | Millions of pesetas | Co-financing |
|---|---|---|---|
| Objective 1 | 780,047 | 129.793 | EAGGF-Guidance |
| Off Target 1 | 226,364 | 37.664 | FEOGA-Guarantee |
| the Basque Country | 3,358 | 559 | FEOGA-Guarantee |
| Cantabria | 0,135 | 22 | EAGGF-Guidance |
| TOTAL | 1009,931 | 168.038 |
The annual allocations to be assigned in the annual investment budgets of the various Administrations will be adjusted to the development of the operational programs and the EU funding.
5.10.8 Financing of the PNR to the 2008 horizon
To fulfill the proposals of the various action programs of the PNR to Horizon 2008, the following investments are necessary from all the Agricultural Administrations and irrigators.
The financial analysis of the investments is presented in the following tables.
TOTAL INVESTMENTS BY PROGRAM AND AUTONOMOUS COMMUNITY TOWARDS 2008 (Millions of pesetas)
| Autonomous Community | Consolidation and improvement | Irrigation projects under construction | Social irrigation | Private irrigation systems | Support programs | Total | ||||||||||||
|---|---|---|---|---|---|---|---|---|---|---|---|---|---|---|---|---|---|---|
| Agricultural AA Investment | Private investment | Agricultural AA Investment | Private investment | Agricultural AA Investment | Private investment | Agricultural AA Investment | Private investment | Agricultural AA Investment | Private investment | Agricultural AA Investment | Private investment | Total | ||||||
| Andalusia | 41.952 | 41.952 | 31.800 | 9.790 | 6.600 | 1.980 | – | – | – | – | 80.352 | 53.722 | 134.074 | |||||
| Aragon | 27.748 | 27.749 | 33.100 | 9.930 | 17.000 | 5.100 | – | – | – | – | 77.848 | 42.778 | 120.626 | |||||
| Asturias | 57 | 57 | – | – | – | – | – | – | – | – | 57 | 57 | 114 | |||||
| Balearics | 1.947 | 1.947 | – | – | 4.000 | 1.200 | – | – | – | – | 5.947 | 3.147 | 9.094 | |||||
| Canary Islands | 3.628 | 3.628 | – | – | 6.500 | 1.950 | – | – | – | – | 10.128 | 5.578 | 15.706 | |||||
| Cantabria | 69 | 69 | – | – | 2.000 | 600 | – | – | – | – | 2.069 | 669 | 2.738 | |||||
| Castile-Mancha | 16.344 | 16.344 | 12.000 | 3.600 | 15.700 | 3.900 | – | – | – | – | 44.044 | 23.844 | 67.888 | |||||
| Castile and León | 54.742 | 54.742 | 44.000 | 13.200 | 7.000 | 2.100 | – | – | – | – | 105.742 | 70.042 | 175.784 | |||||
| Catalonia | 20.950 | 20.951 | 4.175 | 1.253 | 6.400 | 1.920 | – | – | – | – | 31.525 | 24.123 | 55.648 | |||||
| Estremadura | 10.700 | 10.700 | 12.700 | 3.810 | 6.500 | 1.950 | – | – | – | – | 29.900 | 16.460 | 46.360 | |||||
| Galicia | 1.395 | 1.395 | – | – | 2.000 | 600 | – | – | – | – | 3.395 | 1.995 | 5.390 | |||||
| Madrid | 1.860 | 1.860 | – | – | – | – | – | – | – | – | 1.860 | 1.860 | 3.720 | |||||
| Region of Murcia | 21.948 | 21.948 | – | – | – | – | – | – | – | – | 21.948 | 21.948 | 43.896 | |||||
| Navarre | 9.944 | 9.944 | 7.500 | 2.250 | 3.000 | 900 | – | – | – | – | 20.444 | 13.094 | 33.538 | |||||
| the Basque Country | 1.399 | 1.399 | – | – | 4.200 | 1.260 | – | – | – | – | 5.599 | 2.659 | 8.258 | |||||
| The Rioja | 9.003 | 9.003 | – | – | 7.000 | 2.100 | – | – | – | – | 16.003 | 11.103 | 27.106 | |||||
| Qty. Valencian | 30.596 | 30.596 | – | – | – | – | – | – | – | – | 30.595 | 30.595 | 61.190 | |||||
| Without regionalizing | – | – | – | – | – | – | 10.300 | 10.300 | 4.275 | – | 14.575 | 10.300 | 24.875 | |||||
| Total | 254.284 | 254.284 | 145.275 | 43.833 | 87.900 | 25.560 | 10.300 | 10.300 | 4.275 | – | 502.031 | 333.974 | 836.005 | |||||
INVESTMENTS BY PROGRAM AND AUTONOMOUS COMMUNITY TOWARDS 2008 OF AGRICULTURAL ADMINISTRATIONS (Millions of Ptas.)
| Autonomous Community | Existing irrigation systems | Irrigation implementation | Social irrigation | Private irrigation systems | Support programs | Total |
|---|---|---|---|---|---|---|
| Andalusia | 41.952 | 31.800 | 6.600 | – | – | 80.352 |
| Aragon | 27.748 | 33.100 | 17.000 | – | – | 77.848 |
| Asturias | 57 | – | – | – | – | 57 |
| Balearics | 1.947 | – | 4.000 | – | – | 5.947 |
| Canary Islands | 3.628 | – | 6.500 | – | – | 10.128 |
| Cantabria | 69 | – | 2.000 | – | – | 2.069 |
| Castilla la Mancha | 16.344 | 12.000 | 15.700 | – | – | 44.044 |
| Castile and León | 54.742 | 44.000 | 7.000 | – | – | 105.742 |
| Catalonia | 20.950 | 4.175 | 6.400 | – | – | 31.525 |
| Estremadura | 10.700 | 12.700 | 6.500 | – | – | 29.900 |
| Galicia | 1.395 | – | 2.000 | – | – | 3.395 |
| Madrid | 1.860 | – | – | – | – | 1.860 |
| Region of Murcia | 21.948 | – | – | – | – | 21.948 |
| Navarre | 9.944 | 7.500 | 3.000 | – | – | 20.444 |
| the Basque Country | 1.399 | – | 4.200 | – | – | 5.599 |
| The Rioja | 9.003 | – | 7.000 | – | – | 16.003 |
| Qty. Valencian | 30.595 | – | – | – | – | 30.595 |
| Without regionalizing | – | – | – | 10.300 | 4.275 | 14.575 |
| Total | 254.281 | 145.275 | 87.900 | 10.300 | 4.275 | 502.031 |
INVESTMENTS BY PROGRAM AND AUTONOMOUS COMMUNITY TOWARDS 2008 FROM THE MAP AND AUTONOMOUS COMMUNITIES (Millions of Ptas.)
| Autonomous Community | Consolidation and improvement | Irrigation projects under construction | Social irrigation | Private irrigation systems | Support programs | Total | ||||||||||||
|---|---|---|---|---|---|---|---|---|---|---|---|---|---|---|---|---|---|---|
| MAP | CCAA | MAP | CCAA | MAP | CCAA | MAP | CCAA | MAP | CCAA | MAP | CCAA | |||||||
| Andalusia | 20.976 | 20.976 | 15.900 | 15.900 | 3.300 | 3.300 | – | – | – | – | 40.176 | 40.176 | ||||||
| Aragon | 13.874 | 13.874 | 16.550 | 16.550 | 8.500 | 8.500 | – | – | – | – | 38.924 | 38.924 | ||||||
| Asturias | 29 | 29 | – | – | – | – | – | – | – | – | 29 | 28 | ||||||
| Balearics | 974 | 974 | – | – | 2.000 | 2.000 | – | – | – | – | 2.974 | 2.973 | ||||||
| Canary Islands | 1.814 | 1.814 | – | – | 3.250 | 3.250 | – | – | – | – | 5.064 | 5.064 | ||||||
| Cantabria | 35 | 35 | – | – | 1.000 | 1.000 | – | – | – | – | 1.034 | 1.035 | ||||||
| Castilla la Mancha | 8.172 | 8.172 | 6.000 | 6.000 | 7.850 | 7.850 | – | – | – | – | 22.022 | 22.022 | ||||||
| Castile and León | 27.371 | 27.371 | 22.000 | 22.000 | 3.500 | 3.500 | – | – | – | – | 52.871 | 52.871 | ||||||
| Catalonia | 10.475 | 10.475 | 2.088 | 2.088 | 3.200 | 3.200 | – | – | – | – | 15.763 | 15.762 | ||||||
| Estremadura | 5.350 | 5.350 | 6.350 | 6.350 | 3.250 | 3.250 | – | – | – | – | 14.950 | 14.950 | ||||||
| Galicia | 698 | 698 | – | – | 1.000 | 1.000 | – | – | – | – | 1.698 | 1.697 | ||||||
| Madrid | 930 | 930 | – | – | – | – | – | – | – | – | 930 | 930 | ||||||
| Region of Murcia | 10.974 | 10.974 | – | – | – | – | – | – | – | – | 10.974 | 10.974 | ||||||
| Navarre | – | 9.944 | – | 7.500 | – | 3.000 | – | – | – | – | – | 20.444 | ||||||
| the Basque Country | – | 1.399 | – | – | – | 4.200 | – | – | – | – | – | 5.599 | ||||||
| The Rioja | 4.502 | 4.502 | – | – | 3.500 | 3.500 | – | – | – | – | 8.002 | 8.001 | ||||||
| Qty. Valencian | 15.298 | 15.298 | – | – | – | – | – | – | – | – | 15.297 | 15.298 | ||||||
| Without regionalizing | – | – | – | – | – | 5.150 | 5.150 | 2.138 | 2.137 | 7.288 | 7.287 | |||||||
| Total | 121.469 | 132.812 | 68.888 | 76.388 | 40.350 | 47.550 | 5.150 | 5.150 | 2.138 | 2.137 | 237.996 | 264.035 | ||||||
INVESTMENTS BY PROGRAM AND AUTONOMOUS COMMUNITY TOWARDS 2008 FROM THE MINISTRY OF AGRICULTURE, FISHERIES AND FOOD (Millions of Ptas.)
| Autonomous Community | Existing irrigation systems | Irrigation implementation | Social irrigation | Private irrigation systems | Support programs | Total |
|---|---|---|---|---|---|---|
| Andalusia | 20.976 | 15.900 | 3.300 | – | – | 40.176 |
| Aragon | 13.874 | 16.550 | 8.500 | – | – | 38.924 |
| Asturias | 29 | – | – | – | – | 29 |
| Balearics | 974 | – | 2.000 | – | – | 2.974 |
| Canary Islands | 1.814 | – | 3.250 | – | – | 5.064 |
| Cantabria | 35 | – | 1.000 | – | – | 1.035 |
| Castilla la Mancha | 8.172 | 6.000 | 7.850 | – | – | 22.022 |
| Castile and León | 27.371 | 22.000 | 3.500 | – | – | 52.871 |
| Catalonia | 10.475 | 2.088 | 3.200 | – | – | 15.763 |
| Estremadura | 5.350 | 6.350 | 3.250 | – | – | 14.950 |
| Galicia | 698 | – | 1.000 | – | – | 1.698 |
| Madrid | 930 | – | – | – | – | 930 |
| Region of Murcia | 10.974 | – | – | – | – | 10.974 |
| Navarre | – | – | – | – | – | – |
| the Basque Country | – | – | – | – | – | – |
| The Rioja | 4.502 | – | 3.500 | – | – | 8.002 |
| Qty. Valencian | 15.298 | – | – | – | – | 15.298 |
| Without regionalizing | – | – | – | 5.150 | 2.138 | 7.288 |
| Total | 121.469 | 68.888 | 40.350 | 5.150 | 2.138 | 237.996 |
5.11 Expected effects of PNR
5.11.1 The PNR and the Basin Hydrological Plans
In section 4.9 “The demand and consumption of irrigation water”, the current situation of the different basins has been analyzed according to the data included in the PHC and those obtained in the PNR.
This section will study the impact of the implementation of the programs proposed by the PNR to H-2008 on irrigation demands.
5.11.1.1 Water savings and reduction in demand resulting from the consolidation and improvement of irrigation systems
The decrease in gross demand due to the lower losses resulting from the implementation of the PNR consolidation and improvement program, as a consequence of the improvement of irrigation efficiencies in the application systems and the improvement of hydraulic infrastructures, allows us to obtain water savings in irrigated and over-equipped areas, which causes a decrease in water needs at the head of the area.
Reductions in water losses during distribution and application in under-irrigated areas lead to a decrease in water needs and, therefore, a decrease in additional resources.
The decrease in irrigation returns due to the improvement in the efficiency of the pipelines and the optimization of water application on the plot.
The maximum water savings, the reduction in gross demand plus the actual water savings, for the entire program of consolidation and improvement of existing irrigation systems, is estimated at 2,751 hm3/year, broken down into 1,691 hm3 of a decrease in additional resources needed in under-irrigated areas plus 1,876 hm3 obtained by the reduction of water losses in currently supplied or over-supplied irrigation areas and less the reduction of returns quantified at 816 hm3.
As with additional resources, and for the same reasons explained there, aggregation by basins lacks physical meaning and has therefore not been included in the tables.
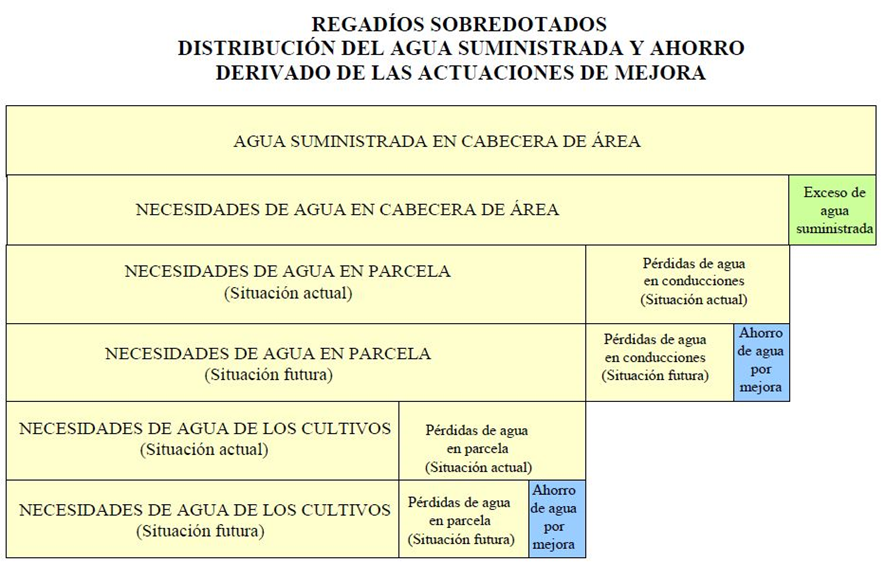
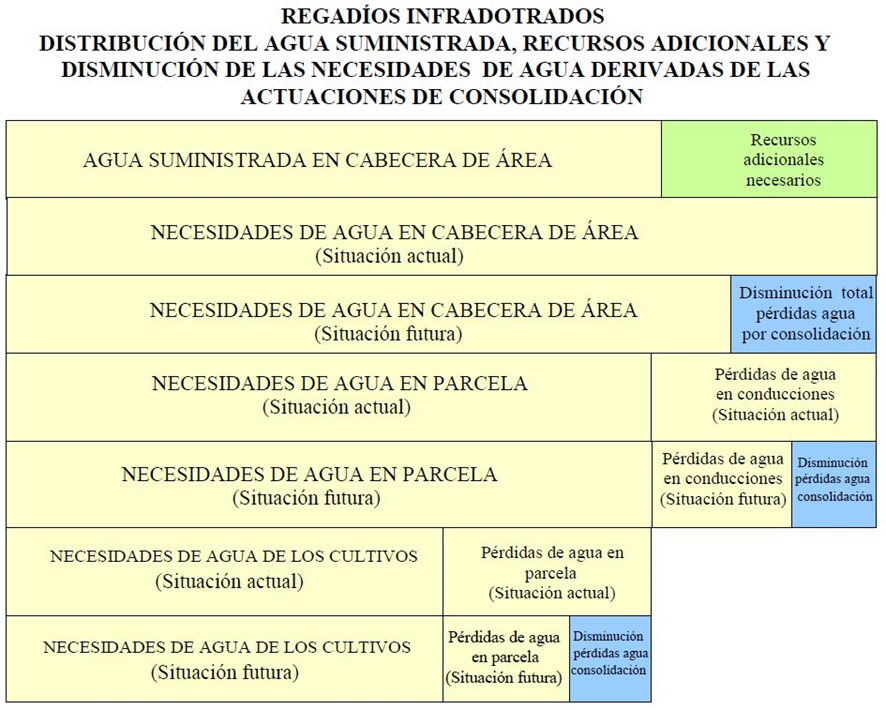
MAXIMUM WATER SAVINGS (hm)3) IN AREAS PROVIDED BY THE AUTONOMOUS COMMUNITY
| Autonomous Community | Reduction of water losses (hm)3) | Decreased returns (hm3) |
|---|---|---|
| Andalusia | 92 | 29 |
| Aragon | 262 | 108 |
| Asturias | 0 | 0 |
| Balearics | 5 | 4 |
| Canary Islands | 18 | 5 |
| Cantabria | 1 | 1 |
| Castilla la Mancha | 253 | 93 |
| Castile and León | 354 | 212 |
| Catalonia | 193 | 103 |
| Estremadura | 170 | 73 |
| Galicia | 29 | 6 |
| Madrid | 23 | 3 |
| Murcia | 97 | 40 |
| Navarre | 52 | 21 |
| the Basque Country | 0 | 0 |
| Rioja | 49 | 25 |
| Valencian | 278 | 93 |
| Total | 1.876 | 816 |
REDUCTION IN DEMAND IN UNDERSERVED AREAS (hm3) BY AUTONOMOUS COMMUNITY
| Autonomous Community | Decreased additional resources needed (hm3) |
|---|---|
| Andalusia | 570 |
| Aragon | 265 |
| Asturias | 0 |
| Balearics | 0 |
| Canary Islands | 18 |
| Cantabria | 2 |
| Castilla la Mancha | 128 |
| Castile and León | 290 |
| Catalonia | 42 |
| Estremadura | 37 |
| Galicia | 0 |
| Madrid | 22 |
| Murcia | 83 |
| Navarre | 42 |
| the Basque Country | 3 |
| Rioja | 2 |
| Valencian | 187 |
| Total | 1.691 |
5.11.1.2 Future demand for the PNR Horizon 2008 and additional resources
As previously stated, the National Irrigation Plan (PNR) only analyzes irrigation demand. This section includes demands arising from PNR actions. These actions are compatible with the provisions of the River Basin Management Plans.
To calculate the future demand of the PNR, we must take into account not only the increase in demand produced by the new irrigation transformations, but also the decrease in current demand produced by the irrigation consolidation program and the savings generated by the improvement program.
Future demand for existing irrigation systems will depend on the degree of compliance with the consolidation and improvement programs for these systems. Assuming that 50% of the programs are implemented, this demand would consist of the current demand minus the reduction achieved through the consolidation program and the savings resulting from the improvement program.
To the future demand for existing irrigation systems, we must add the demands required for new irrigation systems (irrigation systems under construction, social and private irrigation systems).
DEMAND FOR NEW IRRIGATION SYSTEMS PNR – HORIZON 2008
| Autonomous Community | Irrigated area under construction (ha) | Area of social irrigation (ha) | Area of privately irrigated land (ha) | Total area (ha) | Demand for new irrigation (hm)3/year) |
|---|---|---|---|---|---|
| Andalusia | 23.803 | 4.000 | – | 27.803 | 146 |
| Aragon | 26.393 | 20.967 | – | 47.360 | 278 |
| Asturias | – | – | – | – | 0 |
| Balearics | – | 2.250 | – | 2.250 | 9 |
| Canary Islands | – | 4.500 | – | 4.500 | 31 |
| Cantabria | – | 2.500 | – | 2.500 | 0 |
| Castilla la Mancha | 11.910 | 17.000 | – | 28.910 | 148 |
| Castile and León | 43.555 | 6.400 | – | 49.955 | 264 |
| Catalonia | 4.652 | 6.200 | – | 10.852 | 17 |
| Estremadura | 16.450 | 6.950 | – | 23.400 | 139 |
| Galicia | – | 2.500 | – | – | 10 |
| Madrid | – | – | – | – | 0 |
| Region of Murcia | – | – | – | – | 0 |
| Navarre | 6.894 | 2.887 | – | 9.781 | 43 |
| the Basque Country | – | 5.000 | – | 5.000 | 16 |
| The Rioja | 4.708 | 5.272 | – | 9.980 | 40 |
| Valencian Community | – | – | – | – | 0 |
| Without regionalizing | – | – | 18.000 | 18.000 | 922 |
| Total | 138.365 | 86.426 | 18.000 | 242.791 | 1.233 |
• It has been calculated according to the crop alternatives planned in each of the new areas.
• The improved efficiency of conveyance and distribution in newly constructed hydraulic infrastructure and the efficiency of irrigation application systems in new irrigation systems is superior to that of existing irrigation systems.
FUTURE IRRIGATION DEMAND (hm3) TO THE HORIZON 2008
| Autonomous Community | Current irrigation water demand | Increased demand for new irrigation systems | Decreased demand (prog.) Improvement | Additional resources to H-2008 | Water demand to H-2008 |
|---|---|---|---|---|---|
| Andalusia | 5.025 | 146 | 46 | 444 | 5.569 |
| Aragon | 3.225 | 278 | 131 | 125 | 3.497 |
| Asturias | 25 | 0 | 0 | 1 | 26 |
| Balearics | 136 | 9 | 3 | 7 | 149 |
| Canary Islands | 210 | 31 | 9 | 30 | 262 |
| Cantabria | 15 | 0 | 1 | 1 | 15 |
| Castilla la Mancha | 2.267 | 148 | 126 | 133 | 2.422 |
| Castile and León | 3.352 | 264 | 177 | 141 | 3.580 |
| Catalonia | 2.219 | 17 | 96 | 20 | 2.160 |
| Estremadura | 1.695 | 139 | 85 | 160 | 1.909 |
| Galicia | 619 | 0 | 14 | 3 | 608 |
| Madrid | 268 | 0 | 11 | 10 | 267 |
| Region of Murcia | 1.231 | 0 | 49 | 72 | 1.254 |
| Navarre | 514 | 43 | 26 | 42 | 573 |
| the Basque Country | 40 | 16 | 0 | 7 | 63 |
| The Rioja | 342 | 40 | 25 | 11 | 368 |
| Valencian Community | 2.115 | 0 | 139 | 91 | 2.067 |
| Without regionalizing | 102 | 102 | |||
| Total | 23.298 | 1.233 | 938 | 1.298 | 24.891 |
Irrigation includes the demand currently supplied by the PHC and the additional resources needed as provided for in the irrigation consolidation and improvement program.
5.11.1.3 Water consumption and savings in Horizon 2008
- VARIATION IN DEMAND AS OF H-2008
According to the forecasts of the degree of execution of the different programs of the PNR, for the 2008 horizon the following variations in demands will occur, calculated at the head of the irrigated areas.
| VARIATION IN DEMAND AS OF H-2008 | (hm3) |
|---|---|
| Increased demand in irrigation projects under construction | 733 |
| Increased demand in social irrigation systems | 398 |
| Increased demand in private irrigation | 102 |
| Total increase in demand to H-2008 | 1.233 |
| Decrease in demand resulting from the improvement program (50%) | 938 |
| Decrease in additional resources in consolidation program (50%) | 845 |
| Total decrease in demand to H-2008 | 1.783 |
- ADDITIONAL RESOURCES APPLIED TO THE 2008 HORIZON
It is estimated that by the 2008 horizon, 50% of the additional resource needs required for the consolidation of the under-equipped area will have been corrected, which amounts to a total of 2,143 hm³.3. From this figure we must subtract the reductions in additional resources to be obtained with this program, which amount to 845 hm3, so the total additional resources necessary for Horizon 2008 are reduced to the figure of 1,298 hm3.
| Total additional resources to H-2008 | 1.298 |
|---|
- VARIATION OF IRRIGATION RETURNS TOWARDS 2008
The PNR's action programs will cause a decrease in irrigation returns estimated at 883 hm3.
| Reduction of irrigation water returns due to improvement | 408 |
| Reduction of returns due to excess water correction | 443 |
| Increased returns from new irrigation systems | 32 |
| Total decrease in returns to H-2008 | 883 |
|---|
- DEMAND FOR IRRIGATION WATER ON THE HORIZON 2008
If we correct the current demand for irrigation with the variations produced when applying the different PNR programs, we obtain the following demand for Horizon 2008:
| Current demand for irrigation water | 23,298 hm3 |
|---|---|
| Increased demand for new irrigation systems | 1,233 hm3 |
| Reduction due to improvement program | 938 hm3 |
| Additional resources to H-2008 | 1,298 hm3 |
| Irrigation water demand at H-2008 | 24,891 hm3 |
- IRRIGATION WATER SAVINGS ON THE HORIZON 2008
Estimated water savings by Horizon 2008, decrease in gross demand (845 hm³)3/year) plus the actual water savings (938 hm³)3/year), for the entire program of consolidation and improvement of existing irrigation systems, is 1,783 hm3/year, which will produce a decrease in returns of 408 hm3, so we will obtain a net saving of 1,375 hm3.
Considering the excess water supplied to irrigation in the current situation, estimated at 3,366 hm3, And assuming that, similarly to the other action programs, this excess will have been corrected in a 50%, the water savings from this action will be 1,683 hm³3, with a decrease in returns of 443 hm3, so the savings compared to H-2008 would be:
SAVINGS AND REDUCTION IN GROSS WATER DEMAND BY H-2008
| Improvement program | 938 hm3 |
| Reduction of additional resources | 845 hm3 |
| Reduction of excess supply | 1,683 hm3 |
| Total gross savings as of H-2008 | 3,466 hm3 |
|---|
NET WATER SAVINGS AL H-2008
Taking into account the reduction in water returns resulting from the action programs, we will have a net water saving of:
| Savings and reduction of gross demand | 3,466 hm3 |
| Decreased returns per improvement program | 408hm3 |
| Decreased returns, correction of excess supply | 443 hm3 |
| Total net savings as of H-2008 | 2,615 hm3 |
|---|
- WATER CONSUMPTION ON THE HORIZON 2008
Water consumption by 2008, equal to the demand for irrigation water (24,891 hm3) minus water returns caused by irrigation (2,047 hm3), is calculated at 22,844 hm3.
WATER CONSUMPTION
| Irrigation water demand H-2008 | 24,891 hm3 |
| Water returns in the current situation | 2,866 hm3 |
| Decreased returns to H-2008 | 819 hm3 |
| Total consumption as of H-2008 | 22,844 hm3 |
|---|
- SUMMARY OF WATER CONSUMPTION AND SAVINGS ON THE HORIZON 2008
WATER CONSUMPTION
| Current consumption | 20,432 hm3 |
|---|---|
| Consumption H-2008 | 22,844 hm3 |
SAVING WATER
| Total net savings | 2,751 hm3 |
|---|---|
| Net savings H-2008 | 2,613 hm3 |
5.11.1.4 Influence of the new PNR H-2008 surfaces on the PHCs
The new areas to be transformed that are presented in the PNR action programs are contemplated in the planning of the basins in which they are located, given that the Water Administration is competent to carry out the supply of water and the corresponding conveyance infrastructures to the areas, so there is full compatibility between the actions planned in the PNR and the content of the different PHC, in order to allocate and reserve the water resource for them.
Therefore, the following should be noted:
- AREAS UNDER CONSTRUCTION
- Baza-Huéscar: It is located in the Guadiana Menor basin, part of the Guadalquivir basin, at an altitude of between 700 and 1,000 meters. The water used for this area is regulated in the Portillo, San Clemente, and Negratín reservoirs, water that could be used in other low-lying areas with significant water shortages. The productive orientation of this area suggests that its development should not continue beyond 2008.
- Northwest Coast of Cadiz: Located in the Guadalete River basin, it is almost entirely irrigated. The small area remaining to complete its transformation does not significantly affect the basin's water deficit.
- Almanzora Caves: This recently developed area draws its water from the Cueva de Almanzora dam, which regulates the waters of the Almanzora River, along with water supplied by the Tagus-Segura Water Transfer. There are no areas downstream from this zone suitable for irrigation.
- Joke: It is supplied by the regulation of the Chanza River. It currently has the water concession for its completion.
- Genil-Goat: Irrigated with regulated resources from the Genil River, the water not used in this area can be used in the lower Guadalquivir, which is experiencing water shortages. The area's agricultural focus suggests completing the sectors currently under construction and postponing the remaining projects until the results of macroeconomic analyses of the sectors currently irrigated or under construction are available.
- Guaro River: Although the southern basin is clearly deficient, the Guaro area is supplied by the Viñuela reservoir, built in an exploitation system sufficient for the transformation of this area.
- South Andévalo-Central: It draws its water from the Piedras River, a tributary of the Chanza River. Currently, irrigation is being carried out on a precarious basis. Expansion of the area is postponed to a later date.
- Bárdenas II (Part 2), Calanda-Alcañiz (Part 1), Canal del Cinca (Part 3), Canal del Civán, Monegros I 4th Section, Monegros II: These areas are supplied more or less directly by the Ebro River or its tributaries, a basin that generally has a surplus. The problems presented by converting these areas to irrigated land do not lie in the volume of water to be used, but mainly in the profitability of the farms due to their agricultural focus, which is mostly geared towards organic or forage crops.
- Albacete Channel: The water source is the Júcar River, regulated by the Alarcón Reservoir. The water is conveyed to the area via the Tagus-Segura Aqueduct. Actions are currently planned only in three municipalities, covering an irrigable area of 6,744 hectares, postponing the transformation of the remaining 24,681 hectares to a later date.
- La Sagra-Torrijos: It is located in the Tagus River basin. It has an irrigable area of 24,235 hectares, with sectors II and III currently under construction. Therefore, despite its agricultural focus on COP crops, the PNR proposes the completion of these two sectors by 2008.
- La Armuña, Las Cogotas (ZR Río Adaja), Margen Izquierda de Tera, Páramo Bajo and Riaño: These are areas dependent on the Duero River without deficit problems, but all of them have a clear agricultural vocation aimed at COP and orchard crops, so their profitability is very doubtful, and their transformation should be limited to small areas that absorb the surplus quotas caused by the abandonment of dryland farming.
- Aldea-Camarles, Alguerri-Balaguer, A. Vallfornés, Margalef, Muga MD, Perelló-Rasquera, Pla del Sas, S.Martín de Tous, Segarra-Garrigas and Xerta-Senia. The Muga, Vallfornés, and San Martín de Tres Arroyos areas belong to the Catalonia Irrigation District, while the rest belong to the Ebro Irrigation District. Work has already been carried out in Alguerri, Vallfornés, Margalef, and Muga, with the remaining areas being newly constructed. In Segarra-Garrigas, the Ministry of Environment and Natural Resources (MIMAM) has begun construction of the main pipelines.
- Ambroz, Central Extremadura and Zújar: The Ambroz irrigation zone is located in the Tagus River basin, and due to its small size, it does not create a water deficit, so its completion is proposed. The Central Extremadura and Zújar zones are in the Guadiana River basin. In the Central Extremadura zone, there is already significant investment in the main and primary irrigation canals, under the jurisdiction of the Ministry of Environment, Natural Resources and Environment (MIMAM); its biggest problem, besides the environmental aspect, is the viability of future crop alternatives. In the Zújar irrigation zone, it is proposed to complete the work on the last two sectors (V and VIII) needed for their full transformation.
- Navarre Canal: The irrigation water for the area comes from the Itoiz reservoir and will reach the area via the recently begun Navarra canal. The transformation of a small area is proposed for completion by 2008.
- Mendavia: It is supplied with water resources from the Ebro River itself, diverted at the Mendavia weir; it has no supply problems and the works are in an advanced state of execution.
- Najerilla: Exclusive OH action area pending completion; it is located on the Najerilla river, regulated by the Mansilla reservoir, in the Ebro basin; without deficit problems.
- SOCIAL IRRIGATION
They all share the common characteristic of not exceeding 2,500 hectares and being located in areas where there should foreseeably not be significant problems with water supply; their main function is to settle population in the territory.
5.11.2 The actions of the PNR H-2008 and the National Energy Plan
The increases in electricity consumption due to the PNR action programs have been calculated, as a result of the improvements to existing irrigation systems and the new transformations in irrigation.
Said increase broken down by activities can be estimated in the following amounts:
| Programs | ∆ Consumption (GW.h) |
|---|---|
| Irrigation consolidation and improvement program | 450 |
| Irrigation projects under construction | 157 |
| Potential irrigation | 95 |
| Private irrigation systems | 57 |
| Total | 759 |
This increase of 690 GW.h represents 1.8% annually over a period of ten years, a percentage that coincides with the current irrigation consumption and is lower than the energy consumption increases foreseen by the PEN.
Irrigation improvement programs are not specifically designed to save on electricity; on the contrary, as previously mentioned, they will lead to increased consumption due to the use of irrigation systems that require more energy. Some irrigation improvement projects aim to utilize energy during off-peak hours by pumping water and storing it at higher elevations, allowing for its later use during peak hours. This approach aims to lower electricity rates, but not to reduce energy consumption.
In areas with the highest electricity consumption, those that use groundwater, their only possibilities for energy savings come from possible changes from high-pressure irrigation application systems to low-pressure ones, and from hypothetical recoveries of dynamic aquifer levels.
Diesel consumption, quantitatively minor in relation to electricity consumption, has greater margins for reducing its consumption, by using mobile installations with pumps not adjustable to the service needs, although they are gradually being replaced by motor pump groups adapted to the available flows or by electric installations, when the size of the plot economically advises it.
Diesel fuel consumption, quantitatively a minority compared to electricity consumption, has greater potential for reduction when using mobile pumping systems that are not adjustable to service needs. Currently, these systems are being replaced by motor-pump units adapted to available flow rates and crop requirements, or by electric systems when the size of the plots makes it economically advantageous; therefore, the process of reducing diesel fuel consumption for irrigation has already begun.
5.11.3 The actions of the PNR H-2008 and employment
The transformation from dryland to irrigated land generates a greater demand for employment, not only because of the irrigation activity itself but also because of the possibility of implementing crops with greater economic profitability that generally require a greater number of days (vegetables, fruit trees, fodder).
The increases in wages caused by irrigation are highly variable throughout the national territory, depending mainly on the possible changes in crop alternatives, the irrigation systems used and the cultivation systems, thus it can vary from 10% for a cereal with sprinkler irrigation with total coverage, to 100% in continental crops with gravity irrigation, to 400% in fruits and vegetables and to 4000% in forced crops.
The PNR, among its objectives, includes the stabilization of the rural population; this can be achieved through the implementation of intensive crops with a greater demand for labor or by increasing the profitability of current agricultural holdings in such a way as to prevent them from being abandoned by farmers.
The PNR has analyzed for each of the planned action programs the creation of permanent employment due to the agricultural activity itself and that generated as a result of the execution of the works, not including the indirect employment that will be generated as a result of the action programs.
These calculations have been carried out by agricultural regions in the study of irrigation and the economy included in section 8.4, and the analysis of these shows that the greatest increases in the workforce occur in the Mediterranean and southern Atlantic regions.
Due to the large number of regions analyzed, the attached table presents the variations in labor costs (UTH) generated by Autonomous Community and for each of the action programs. It shows the variations in labor costs (UTH) resulting from the implementation of the action programs included in the National Irrigation Plan Horizon 2008.
- Consolidation and improvement program.
The consequences of the different programs on rural employment have been analyzed separately, obtaining highly variable figures, depending not only on the actions themselves but also on the region where they are implemented, leading to the following conclusions:
For the irrigation consolidation and improvement program, in some Autonomous Communities there is a decrease in agricultural employment, mainly due to the modernization of facilities and the improvement in management, with better application of water and a saving of labor.
Among the Autonomous Communities with a positive sign, Andalusia stands out, where this modernization entails a change in land use towards intensive crops, which demand a greater workforce, in a greater proportion than in the rest of the territory.
Among the Autonomous Communities with a negative sign, the Region of Murcia and the Valencian Community stand out, where a large proportion of the irrigated area is dedicated to intensive horticultural crops, and where this program is expected to act mainly on the modernization of existing structures and on the change in irrigation systems, aimed at a better use of the water resource, which together with a lower use of labor, will improve the profitability of agricultural holdings.
This program for consolidating and improving existing irrigation systems will generate 14,574 permanent UTH and 45,702 UTH/year for the 8-year implementation period of the PNR.
- Irrigation program underway.
Analyzing irrigation projects underway reveals significant variability in the labor force generated, resulting from the diversity of crops planted and the cultivation systems employed. Thus, in the Autonomous Community of Andalusia, where development of new irrigated land is concentrated along the coast (the irrigated areas of Chanza, Guaro, and Cuevas de Almanzora), the greatest increases in labor force are observed. The smallest increases per hectare transformed are seen in the Autonomous Communities of the interior of the Iberian Peninsula (Aragon, Castile-La Mancha, Castile and León, and Extremadura).
The irrigation program currently underway will create 18,255 UTHs permanently nationwide, and as a result of the construction work, 12,140 UTHs/year will be created throughout the 8 years of the PNR's validity.
- New irrigation program.
By their very definition, in social irrigation systems where the areas to be transformed are small and where the aim is to retain the rural population and prevent depopulation, the percentage of intensive crops will be higher than those planned in the extensive irrigation areas under construction. Therefore, for each of the Autonomous Communities, as a general rule, there is greater job creation per hectare in social irrigation systems than in irrigation systems under construction.
For the national whole, the social interest irrigation program is expected to create 6,551 permanent UTH and 9,033 UTH/year derived from the execution of the social interest irrigation works for the period of 8 years, and the private irrigation program 976 permanent UTH and 1,108 UTH/year generated by the execution of the work.
Taking into account all the action programs of the National Irrigation Plan Horizon 2008, 40,356 permanent UTHs and 67,983 UTH/year will be created as a result of the execution of the works throughout the 8-year period of validity of the PNR.
This summary of the National Irrigation Plan for H-2008 and job creation does not include the investment/job creation ratio, as a superficial analysis of it could lead to erroneous conclusions for the following reasons:
In the program for consolidating and improving existing irrigation systems, one of the main objectives is to improve the profitability of farms and the quality of life of farmers, with job creation being secondary in this program, so the investment/job generated ratio is not indicative.
In the irrigation projects underway, the PNR calculates the investments of the Agricultural Administrations necessary for the transformation into irrigated areas included in the action program, finding that in certain sectors where their implementation depends on the latest actions, a much lower investment/employment ratio would be obtained than in those whose transformation has barely begun.
VARIATION IN LABOR AT UTH ACCORDING TO ACTION PROGRAMS
| Autonomous Community | Consolidation and improvement | Irrigation projects under construction | Social irrigation | Private irrigation systems | Total | |||||||||
|---|---|---|---|---|---|---|---|---|---|---|---|---|---|---|
| Area (ha) | Labour | Area (ha) | Labour | Area (ha) | Labour | Area (ha) | Labour | Labour | ||||||
| Permanent e (UTH) | Eventual UTH/year | Permanent (UTH) | Eventual UTH/year | Permanent e (UTH) | Eventual UTH/year | Permanent e (UTH) | Eventual UTH/year | Permanent (UTH) | Eventual UTH/year | |||||
| Andalusia | 288.733 | 18.792 | 7.444 | 23.803 | 14.272 | 3.270 | 4.000 | 1.640 | 720 | – | – | – | 34.704 | 11.434 |
| Aragon | 142.332 | 29 | 5.000 | 26.393 | 1.056 | 2.045 | 20.967 | 839 | 1.816 | – | – | – | 1.924 | 8.861 |
| Asturias | 207 | – | 10 | – | – | – | – | – | – | – | – | – | – | 10 |
| Balearics | 4.531 | – | 351 | – | – | – | 2.250 | 225 | 405 | – | – | – | 225 | 756 |
| Canary Islands | 11.273 | – | 654 | – | – | – | 4.500 | 1.800 | 766 | – | – | – | 1.800 | 1.420 |
| Cantabria | 1.276 | – | 12 | – | – | – | 2.500 | 125 | 455 | – | – | – | 125 | 467 |
| Cast-Mancha | 91.925 | -223 | 2.945 | 11.910 | 596 | 663 | 17.000 | 680 | 1.715 | – | – | – | 1.053 | 5.323 |
| Castile and León | 192.502 | -59 | 9.863 | 43.555 | 435 | 4.167 | 6.400 | 64 | 581 | – | – | – | 440 | 14.611 |
| Catalonia | 77.880 | -686 | 3.775 | 4.652 | 465 | 298 | 6.200 | 310 | 620 | – | – | – | 89 | 4.693 |
| Estremadura | 63.925 | -265 | 1.928 | 16.450 | 987 | 378 | 6.950 | 372 | 695 | – | – | – | 1.094 | 3.001 |
| Galicia | 6.456 | – | 251 | – | – | – | 2.500 | 250 | 455 | – | – | – | 250 | 706 |
| Madrid | 13.550 | – | 335 | – | – | – | – | – | – | – | – | – | – | 335 |
| Murcia | 69.872 | -1.478 | 3.955 | – | – | – | – | – | – | – | – | – | -1.478 | 3.955 |
| Navarre | 32.505 | 23 | 1.792 | 6.894 | 209 | 784 | 2.887 | 86 | 283 | – | – | – | 318 | 2.859 |
| P. Vasco | 4.371 | 26 | 252 | – | – | – | 5.000 | 146 | 459 | – | – | – | 172 | 711 |
| Rioja | 18.037 | -149 | 1.622 | 4.708 | 235 | 535 | 5.272 | 264 | 518 | – | – | – | 350 | 2.675 |
| Valencian | 115.519 | -1.436 | 5.513 | – | – | – | – | – | – | – | – | – | -1.436 | 5.513 |
| Without regionalizing | – | – | – | – | – | – | – | – | – | 18.000 | 857 | 973 | 857 | 973 |
| Total | 1.134.894 | 14.574 | 45.702 | 138.365 | 18.255 | 12.140 | 86.426 | 6.801 | 9.488 | 18.000 | 857 | 973 | 40.487 | 68.303 |
5.11.4 Expected effects on agricultural production
The increase in production that this represents for all and for each of the action programs has been calculated at the national level in two scenarios: Proposal of the PNR to the horizon 2008 and full execution of all the programs of the PNR to the horizon 2008.
- Consolidation and improvement of irrigation systems
An estimate has been made, according to the methodology advocated by the FAO, of the increases in production due to the reduction of water stress existing in the under-endowed areas according to the values of the Ky response factor, for the crop distributions existing in the under-endowed areas.
Since the corresponding quotas have been exceeded, certain production increases, such as beetroot, will require their marketing at market prices.
The irrigation consolidation program includes among the under-irrigated areas those farms that currently have irrigation infrastructure but are not being irrigated due to a lack of water. The distribution of crops, similar to the previous section, will be similar to the current distribution of cultivated areas in the existing irrigated areas of the surrounding region.
- Areas of new irrigation
For the purposes of production analysis, a distinction has been made between irrigation systems of social interest and individual irrigation systems corresponding to private initiatives.
In the first case, a total of 86,426 ha has been considered, with a distribution of areas by crops, obtained from the PNR database, so that the alternative for each proposed area is similar to that of the irrigated areas in its surroundings.
In the case of irrigation systems transformed by private initiative, the estimated 35,000 ha (including the 18,000 ha subsidized) have been assigned a crop distribution of 40% olive groves, 15% citrus and fruit trees, 15% vineyards, 15% horticultural crops, 10% herbaceous crops (COP) and 5% alfalfa and forage.
- Irrigation projects under construction
For each of the irrigable zones under development, future crop alternatives have been selected according to the productive orientations of each zone and the current distribution of irrigated crop areas in the irrigation areas where they are located, obtained from the Characterization and Typification Studies.
5.11.4.1 Production balances when applying the action programs
- Balance with the proposed actions of the PNR to H 2008
Starting from the current balance, the situation to H 2008 is estimated, calculating the decreases due to the abandonment of dryland crop areas and the losses of production derived from the decrease in dryland areas as a consequence of the transformations to irrigated land and the increases due to all the Action Programs to H-2008, consolidation and improvement of irrigation, irrigation in execution, new social and private irrigation, obtaining the balances of productions by crop and action programs to H-2008.
YoNCREMENTS OF DRYLAND-IRRIGED PRODUCTIONS (THOUSANDS OF t) ACCORDING TO THE PROGRAMS PROPOSED BY THE PNR TO H-2008
| COP | Corn | Rice | Potato | Beet | Cotton | Forages | Fruit and vegetable grower | Vineyard | olive grove | |
|---|---|---|---|---|---|---|---|---|---|---|
| Consolidation and improvement of irrigation systems H 2008 | 334,1 | 144,6 | 2,6 | 108,4 | 173,3 | 24,6 | 156,8 | 1.747,30 | 63,8 | 120,6 |
| Irrigation projects under construction H-2008 | 116,1 | 123,0 | 21,2 | 173,0 | 0,0 | 6,1 | 412,5 | 940,9 | 1,8 | 3,4 |
| New irrigation systems of social interest H-2008 | 49,1 | 63,5 | 0,6 | 160,1 | 224,7 | 0,8 | 38,2 | 240,8 | 24,9 | 17,1 |
| land abandonment | -291,8 | 0 | 0 | -40,3 | -33,1 | 0 | -142,6 | -15,4 | -60 | -66,3 |
| Private irrigation systems | -15,6 | 14,5 | 0 | -3,5 | -2,9 | 0 | 81,4 | 244,9 | 35,3 | 33,3 |
| Variation of PNR productions H-2008 | 191,9 | 345,6 | 24,4 | 397,7 | 362,0 | 31,5 | 546,3 | 3.158,5 | 65,8 | 108,1 |
| % Increase over national production H-2008 | 0,8 | 9,0 | 3,2 | 9,5 | 4,2 | 11,3 | 3,0 | 17,6 | 1,3 | 2,5 |
- Balance with the proposal of the total actions of the PNR
YoNCREMENTS OF DRYLAND-IRRIGED PRODUCTIONS (THOUSANDS OF t) ACCORDING TO THE TOTALITY OF THE PNR PROGRAMS
| COP | Corn | Rice | Potato | Beet | Cotton | Forages | Fruit and vegetable grower | Vineyard | olive grove | |
|---|---|---|---|---|---|---|---|---|---|---|
| Consolidation and improvement of irrigation systems | 690,5 | 316,8 | 13,3 | 253,4 | 359,9 | 50,9 | 414,1 | 3.661,7 | 128,8 | 246,8 |
| Irrigation projects under construction | 676,1 | 722,3 | 116,5 | 759,0 | 0,0 | 22,4 | 2.552,2 | 1.905,8 | 40,0 | 37,8 |
| New irrigation systems of social interest H-2008 | 866,6 | 883,0 | 20,0 | 1.599,1 | 1.770,4 | 7,3 | 2.250,0 | 2.986,2 | 50,2 | 182,8 |
| land abandonment | -291,8 | 0,0 | 0,0 | -40,3 | -33,1 | 0,0 | -142,6 | -15,4 | -60,0 | -66,3 |
| Private irrigation systems | -15,6 | 14,5 | 0,0 | -3,5 | -2,9 | 0,0 | 81,4 | 244,9 | 35,3 | 33,3 |
| Production variation. Total PNR | 1.925,8 | 1.936,6 | 149,8 | 2.567,7 | 2.094,3 | 80,6 | 5.155,1 | 8.783,2 | 194,3 | 434,4 |
| % Increase over national production H-2008 | 8,4 | 50,6 | 19,6 | 60,3 | 24,8 | 29,0 | 28,4 | 49,3 | 3,9 | 9,8 |
- Increase in surface area when applying action programs
The increases in surface area caused by the PNR's action proposals have been calculated.
VARYoA.C.YoONES OF DRYLAND-IRRIGED AREAS (THOUSANDS OF ha) RESULT OF APPLYING THE PNR PROGRAMS TO H 2008
| COP | Corn | Rice | Potato | Beet | Cotton | Forages | Fruit and vegetable grower | Vineyard | olive grove | |
|---|---|---|---|---|---|---|---|---|---|---|
| Irrigation projects under construction | -40,3 | 18,4 | 3,5 | 6,1 | -0,2 | 1,6 | 12,5 | 34,3 | -0,3 | 0,0 |
| New irrigation systems of social interest H 2008 | -16,6 | 10,5 | 0,1 | 5,2 | 4,5 | 0,3 | -2,3 | 10,5 | -0,1 | 0,7 |
| New private irrigation systems | -23,8 | 3,3 | 0,4 | 0,1 | 0,0 | 0,2 | 2,0 | 14,1 | 2,0 | 8,5 |
| land abandonment | -347,0 | 0,0 | 0,0 | -3,5 | -1,5 | 0,0 | -7,5 | -4,0 | -40,0 | -68,5 |
| Surface area variation H 2008 | -427,7 | 32,2 | 4,0 | 7,9 | 2,8 | 2,1 | 4,7 | 54,9 | -38,4 | -59,3 |
| % Variation of surface area as a percentage of the national total in H-2008 | -3,8 | 6,7 | 3,7 | 3,7 | 1,6 | 2,6 | 1,2 | 5,5 | -3,4 | -2,8 |
VARYoA.C.YoONES OF DRYLAND-IRRIGED AREAS (THOUSANDS OF ha) RESULT OF APPLYING ALL OF THE PROGRAMS OF THE PNR
| COP | Corn | Rice | Potato | Beet | Cotton | Forages | Fruit and vegetable grower | Vineyard | olive grove | |
|---|---|---|---|---|---|---|---|---|---|---|
| Irrigation projects under construction | -183,7 | 112,3 | 20,4 | 28,3 | 0,0 | 6,8 | 82,1 | 85,6 | -0,5 | 0,0 |
| New irrigation systems of social interest | -227,1 | 151,6 | 3,2 | 51,3 | 36,3 | 2,3 | 17,0 | 148,2 | -1,7 | 24,2 |
| New private irrigation systems | -23,8 | 3,3 | 0,4 | 0,1 | 0,0 | 0,2 | 2,0 | 14,1 | 2,0 | 8,5 |
| land abandonment | -347,0 | 0,0 | 0,0 | -3,5 | -1,5 | 0,0 | -7,5 | -4,0 | -40,0 | -68,5 |
| Total transformation | -781,6 | 267,2 | 24,0 | 76,2 | 34,8 | 9,3 | 93,6 | 243,9 | -40,2 | -35,8 |
| % Variation of surface area over national total | -6,8 | 55,1 | 22,5 | 36,1 | 21,8 | 12,0 | 20,6 | 24,7 | -3,1 | -1,6 |
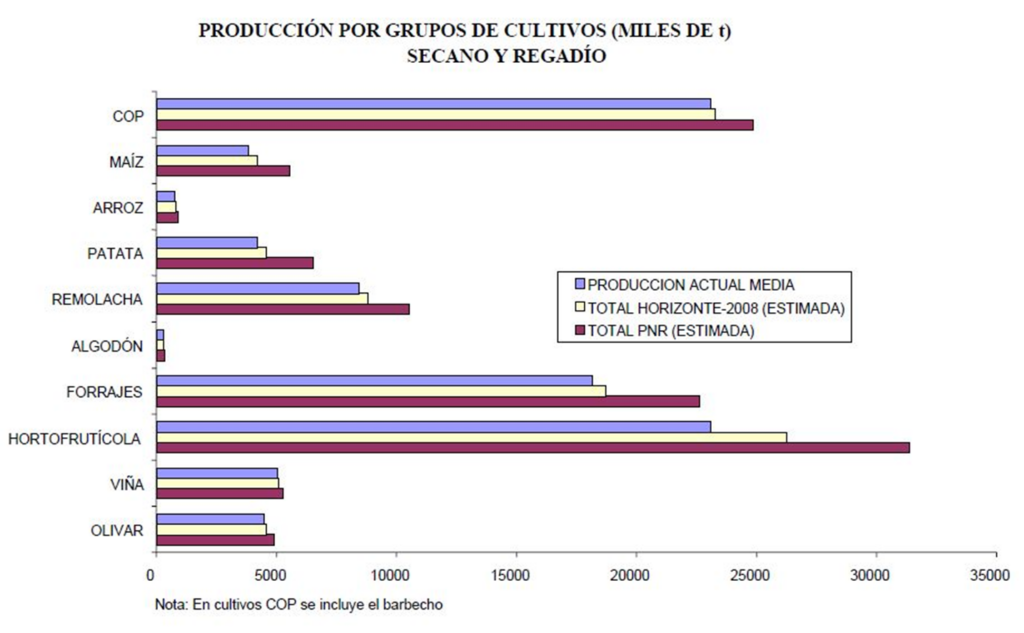
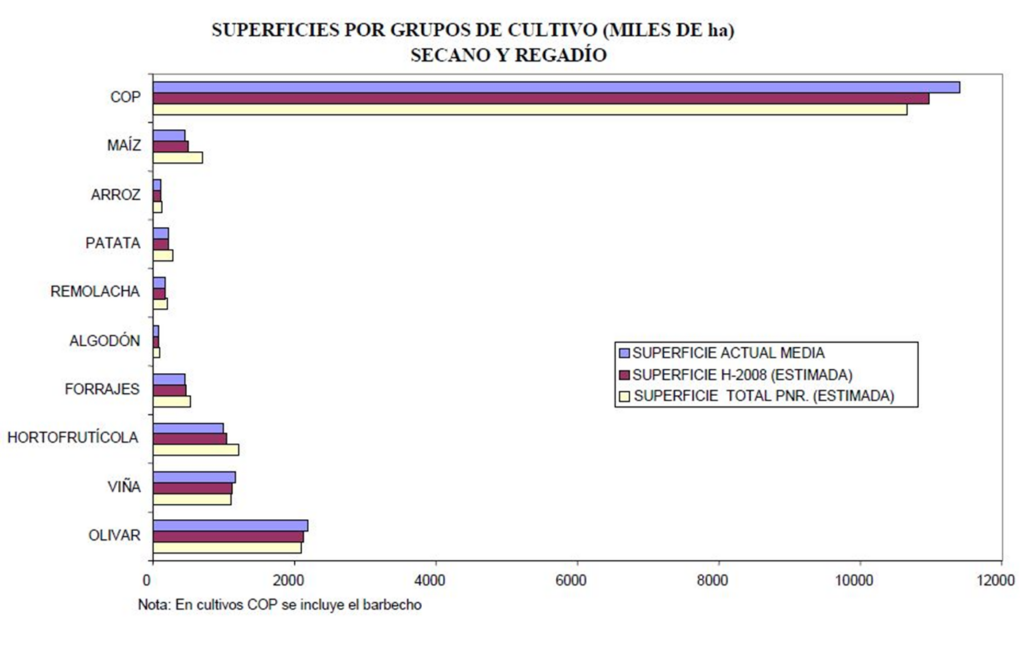
- Summary of the influence of performance programs
In the analysis of the influence of the action programs on total productions and dryland and irrigated area, it should be noted that the area corresponding to the COPs includes traditional fallow, and the reference productions have been taken from the data corresponding to the average data.
From the study of the tables included above, the conclusions are drawn, the summary of which is set out in the following sections.
- Influence of the program of actions proposed for H 2008
Analysis of production increases in the 2008-2008 period compared to the reference year (1996) shows a slight increase of 0.81 TP3T in COP crops, along with a notable increase in maize (9.01 TP3T). The reduction in cereal acreage is fourteen times greater than the increase in maize acreage; this decrease is mainly due to the abandonment of marginal rainfed crops.
There will be slight increases, close to 3% in rice, fodder and olive groves and around 1% for vineyards.
Significant increases and of great importance in the market will occur for potatoes (9.5%), cotton (11.3%) and fruit and vegetable products (17.6%).
- Influence of the execution of all PNR programs
In the hypothetical scenario where all the programs contemplated in the National Irrigation Plan (PNR) are implemented—including consolidations and improvements, completion of areas currently under development, and the development of all potential irrigation areas—within the analyzed timeframe and under the current European Union agricultural policy, the resulting imbalances in the national agricultural market would be significant and extremely difficult to manage. Therefore, without prejudice to the necessary prior verification of water availability that must be included in the River Basin Management Plans, any future irrigation developments must be carefully studied from this perspective before proceeding with their final implementation.
6 Development and implementation of the National Irrigation Plan
6.1 Introduction
The Horizon 2008 Irrigation Plan, prepared by the Ministry of Agriculture, Fisheries and Food (MAPA), in coordination with the Autonomous Communities (CC.AA.), requires for its implementation the definition of a management model to ensure that the actions set out in its development programs, which in turn generate a certain level of investment, are operational by the Administrations involved, with the highest level of profitability and maximum efficiency.
To achieve this, it is necessary to strengthen the establishment of a Framework Agreement for collaboration between the MAPA and the different Autonomous Communities, defining the principles that regulate the mechanisms of collaboration between the competent Administrations in matters of irrigation, for better coordination of the execution and financing of the Plan.
It is important to remember that the National Irrigation Plan (PNR) promotes maximum consensus within a framework of cooperation and collaboration between the State and the Autonomous Communities, in a shared task involving two areas of competence for the development of irrigation in Spain. The Ministry of Agriculture, Fisheries and Food (MAPA) and the Autonomous Communities agree on territorial objectives, coordinate actions, and jointly establish the implementation instruments, including the aforementioned Framework Agreement for the Development of the PNR and the Specific Collaboration Agreements, which take into account the specific characteristics of each Autonomous Community, within the general criteria and guidelines of the PNR.
6.2 Frame of reference
First, it is necessary to outline the overall financial framework of the National Rural Development Plan (PNR), which amounts to 836,005 million pesetas in investment, both public and private, with co-financing from the General State Budget not exceeding 237,996 million pesetas as of December 31, 2008. Joint investment from the budgets of the Autonomous Communities will also not exceed 264,035 million pesetas as of the same date, with 333,974 million pesetas allocated to farmers benefiting from the Plan's various action programs.
For each Autonomous Community, a budgetary and financial framework is defined in accordance with the cost of the actions agreed with each Administration.
Secondly, it is considered that, in addition to regional regulations, the State Agricultural Infrastructure Companies (SEIASAS) constitute one of the basic instruments for the promotion and execution of irrigation improvement and consolidation works, in coordination with the Autonomous Communities. Actions whose execution is agreed to be carried out through the SEIASAS will require the prior declaration of general interest, which will be proposed by the National Government at the request of the Ministry of Agriculture, Fisheries and Food (MAPA), after agreement with the Autonomous Community and after consulting the Irrigation Communities and Users, as potential beneficiaries.
Thirdly, it is the responsibility of MAPA to carry out the procedures before the Community and National Institutions to obtain the corresponding community returns.
Finally, the Autonomous Communities will co-finance the actions of all the programs of the PNR under the terms provided within the Horizontal Operational Program for the Improvement of Structures in the Objective 1 regions, the Rural Development Program for the improvement of production structures in regions located outside Objective 1 and the Integrated Operational Program of Cantabria as a region in transition.
6.3 Acceptance of the Plan
Following multiple bilateral and multilateral agreements with the Autonomous Communities, the Government proposes the National Renewal Plan - Horizon 2008 as the single, basic consensus text to be submitted to the relevant authorities. Any modifications that may be proposed, for any reason, at any stage of the process leading up to its final approval, will require prior agreement with the affected administrations.
For their part, the Autonomous Communities accept the content of the PNR, the result of consensus with them, assuming the content of all the action programs for their territory.
6.4 Flexibility and dynamism of the Plan
Irrigation planning must respond to a series of principles that are capable of incorporating institutional, economic and social changes, new trends and criteria contained in the Treaty of the Union and in the Regulations and Directives that indirectly or directly affect the development of irrigation.
Among these principles, we can cite flexibility, which involves adapting irrigation planning to the changing market conditions driven by political, social, and economic shifts. Ultimately, flexible planning that is reviewed periodically is the only way to protect oneself in an uncertain environment.
These principles are incorporated for the first time into a national irrigation plan and are the basis and guarantee of the necessary consensus that favors the balance between legitimate territorial interests.
6.5 Review of actions
As a consequence of the introduction of the flexibility principle into the PNR, the date of December 31, 2003, is set to begin its consensual review, taking into account a series of basic criteria.
Among others, we can point to the analysis of the degree of compliance with what was foreseen in the PNR to that date; the consideration of the needs or priorities that arose up to 31-12-2003, which would advise considering new actions within those not foreseen or not endowed in the PNR; the state of execution and financing of the Horizontal Programs as of 31-12-2003; the volume of actions initiated; the public spending committed up to 31-12-2008 and the maximum financial availability for the period 1-1-2004 to 31-12-2008.
The Sectoral Conference on Agriculture and Rural Development will establish a weighting of the above criteria and, in view of this, the MAPA, after hearing the Autonomous Communities, will decide before 31-3-2004, the incorporation of new actions that are not foreseen or not endowed.
The expansion or transfer of actions may only be carried out on the number of hectares not acted upon contemplated in the PNR – H-2008 and on a proposed catalog of actions.
Regarding the areas included in this catalog, proposed by the Autonomous Communities, the Ministry of Agriculture, Fisheries and Food (MAPA) undertakes their analysis and joint study with the Autonomous Communities and the Ministry of Environment, Water and Environment (MIMAM), both in terms of water availability and their technical, economic, social, and environmental viability. Based on the results of these analyses, MAPA and the corresponding Autonomous Communities will decide on their implementation. If the implementation of projects in some areas included in the catalog, belonging to an Autonomous Community, proves unfeasible, MAPA will request a new list from the corresponding Autonomous Community, which will be processed using the methodology described above.
6.6 Plan Monitoring
The analysis and monitoring of the PNR will be carried out by the Interterritorial Council for the Management of the National Irrigation Plan, which, chaired by the Minister of Agriculture, Fisheries and Food, will resolve any incident relating to the correct execution of the Plan throughout the period of validity.
6.7 Execution of the works of the Plan
For the execution of the works for the improvement and consolidation of irrigation systems declared to be of general interest and included in the Plan, the structure and financing mechanisms of the SEIASA will be used, in accordance with a series of basic action criteria.
If there is no declaration of general interest for the aforementioned work, SEIASA may only intervene in its financing under the terms provided for in the Statutes of the company.
Improvement and consolidation works for irrigation systems affecting small-scale Irrigation Communities will be carried out primarily through the mechanisms of the General State Budgets and those of the Autonomous Communities.
The order of commencement and execution of the improvement and consolidation works will be determined in accordance with the provisions of the competent Public Administrations, in agreement with the affected Irrigation Communities.
In addition to the participation of SEIASA, the actions contemplated in the PNR may be carried out in accordance with the regulations of the General State Administration or Autonomous Administration, previously agreed between the affected Administrations and intended for the development of actions related to irrigation in execution, new transformations or existing irrigation, in accordance with the provisions of the Law on Agrarian Reform and Development.
6.8 Management and administrative coordination of the works
The Ministry of Agriculture, Fisheries and Food (MAPA), through its Directorate General for Rural Development, will be responsible for the administrative management and coordination of the works and actions included in the National Rural Development Plan (PNR) by the central government. The Autonomous Community, in accordance with its powers, will designate its responsible management and administrative bodies.
The Autonomous Community may propose the appointment of a Member-Counselor on the Board of Directors of SEIASA who will act within its territorial scope, after modification of the company's bylaws.
6.9 Review of the regulatory system
The MAPA will promote a Working Group to present to the Sectoral Conference on Agriculture and Rural Development a proposal regarding the review of the regulatory system applicable to the execution of the PNR works not executed at the expense of the SEIASA.
6.10 Special agreements
In addition to and complementing the provisions of the National Irrigation Plan (PNR), it is necessary to include within the general planning those specific actions that, due to territorial characteristics, warrant the establishment of technical and financial support mechanisms from the General State Administration for the implementation of certain specific irrigation projects. Without prejudice to other actions that may be established in the future, the following reference agreements have currently been formalized.
b) Protocol of intent between the MAPA and the Ministry of Agriculture, Trade and Industry of the Government of the Autonomous Community of the Balearic Islands for the execution of irrigation works and optimization of water resources.
In April 1999, the aforementioned Protocol was signed with a maximum duration of December 31, 2012.
Law 30/98, of July 29, on the Special Regime of the Balearic Islands, recognizes the existence of the insular fact, and that this must be taken into account when formulating specific policies in order to try to compensate economically for the imbalance that insularity may generate.
This Protocol is complementary to the National Irrigation Plan in the Balearic Islands, recognizing the specific nature of the water problems of that Autonomous Community, and providing for a series of additional investments with a longer time horizon to effectively alleviate them.
c) Protocol of intent between the Ministry of Agriculture, Fisheries and Food and the Department of Agriculture, Livestock, Fisheries and Food of the Government of the Canary Islands for the execution of irrigation works and optimization of water resources in the Autonomous Community of the Canary Islands.
In January 2000, the Protocol was signed with a duration until December 31, 2012.
Law 19/1994, of July 6, on the Modification of the Economic and Fiscal Regime of the Canary Islands, recognizes the insular fact of the Canary Islands which makes it an outermost region of the European Union, and therefore it must be compensated through specific and sufficient policies.
This Protocol is complementary to the PNR in the Canary Islands, recognizing the specific nature of water problems in the archipelago, establishing a commitment to develop one or more multi-year investment plans to be implemented within the stated timeframe.
- Consideration of the principles of cohesion and equity within irrigation planning suggests introducing a series of actions that, under the same name, are developed in the territory of two adjacent Autonomous Communities, as is the case of the Basque Country and Castile and León.
Ultimately, the aim is to reduce the difference in income, quality of life and territorial cohesion between neighboring rural areas, in farms with a territorial base in the two aforementioned Autonomous Communities, which also have a high acceptance among the affected farmers, and which seeks to maintain the balance between the different groups of farmers so that there is no discrimination based on residence status.
It should not be forgotten that the State, through article 149.1.13 of the Spanish Constitution, has as its exclusive competence "the basis and coordination of the general planning of the economy", which together with the development of the constitutional doctrine regarding the collaboration and cooperation between the State and the Autonomous Communities, in cases of concurrence of two areas of competence, such as the issue of irrigation, legitimizes the Government to make these decisions.
It should also be noted that the special administrative organization of the Institutions of the Autonomous Community of the Basque Country, in which there are powers that are developed through the Provincial Councils of the different Historical Territories, as is the case of the Provincial Council of Alava, in matters of irrigation, which has an Irrigation Plan drawn up by its Department of Agriculture, and in which the aid and investments in irrigation are legislated by Provincial Decree 705/1992, of October 6, and Provincial Decree 29/1994, of March 15, these aids being established for the development of infrastructures, directly linked to the agricultural activity foreseen in article 20 of EEC Regulation 2328/91.
All of this makes it necessary to include within the framework of the National Irrigation Plan (PNR) the actions in three irrigated areas, whose improvement and consolidation works were declared to be of general interest in Article 78 of Law 14/2000, of December 29. These areas are:
| Alaves Valleys | 9,200 hectares in Álava 2,800 ha in Burgos |
|---|---|
| Red River-Berantella | 744 hectares in Treviño County 756 hectares in Álava |
| Rioja Alavesa (eastern zone) | 4,500 hectares in Álava |
It should be noted that, as the first two zones extend, as previously mentioned, across the territory of the neighboring Autonomous Communities, the third is an expansion of an irrigable zone included in the social irrigation program of the PNR.
6.11 Warranty clause
Once the PNR is in force, all modifications that need to be introduced during its development will be processed and therefore decided within the framework of the INTERTERRITORIAL COUNCIL FOR THE MANAGEMENT OF THE NATIONAL IRRIGATION PLAN, mentioned in point 6.6, as a guarantee of correct and efficient execution of the PNR throughout its period of validity, this Council beginning its functions simultaneously with the final approval of the Plan, and regulating its action by its own internal operating rules, agreed with the Autonomous Communities.